


Servicios Personalizados
Articulo
 Inglés (pdf)
 Articulo en XML
 Referencias del artículo
Indicadores

Links relacionados
-
 Citado por Google
 -
 Similares en Google
Compartir

 Permalink
Journal of the South African Institution of Civil Engineering
versión On-line ISSN 2309-8775
versión impresa ISSN 1021-2019
J. S. Afr. Inst. Civ. Eng. vol.65 no.3 Midrand sep. 2023
http://dx.doi.org/10.17159/2309-8775/2023/v65n3a3
TECHNICAL PAPER
http://dx.doi.org/10.17159/2309-8775/2023/v65n3a3
Experimental comparison of active seismic surface wave tests on shallow and deep bedrock sites
M C Ntaote; G Heymann
ABSTRACT
Active seismic surface wave tests are tests during which signals are generated by artificial sources such as sledgehammers, drop weights and fixed or variable frequency shakers. A number of active seismic surface wave tests have become popular in the geotechnical industry. Interestingly, different surface wave tests are popular in different regions of the world, presumably because the tests require different equipment, expertise and numerical analysis techniques. Few studies have been done to compare seismic surface wave tests directly. This study investigated the performance of three active seismic surface wave tests, namely the spectral analysis of surface waves (SASW), multi-channel analysis of surface waves (MASW) and continuous surface wave (CSW) tests. This paper reports the performance of the three tests with regard to repeatability, susceptibility to near-field effects, and maximum and minimum measurement depths at both a shallow and a deep bedrock site.
Keywords: SASW, MASW, CSW, near-field effects, measurement depth
INTRODUCTION
Numerous laboratory and in situ tests are used to characterise geomaterial behaviour. These include seismic tests which measure the velocity at which mechanical seismic waves are propagated in the material. Parameters determined from these tests can be utilised in dynamic problems such as site response evaluation, liquefaction potential evaluation, earthquake engineering and machine foundations (Strobbia 2003). Another important application of seismic tests is the determination of soil stiffness which can be used in the design of geotechnical structures such as foundations, excavations and tunnels to predict ground movements, both during and after construction (Matthews et al 1996).
Seismic testing can be done in the field, as well as in the laboratory. When conducted in the field, the tests can be intrusive or non-intrusive. Intrusive methods require a drilled borehole or insertion of a probe into the soil. However, seismic surface wave tests are non-intrusive, as the seismic source and receivers are all located on the surface of the ground. Methods that measure the propagation of Raleigh waves have gained significant popularity (Foti et al 2018; Stokoe et al 2004). Seismic surface wave methods can be divided into two broad categories - active and passive types - and they differ by means of the signal source. Active tests use a signal that is generated artificially by means of a sledgehammer, a weight drop or a fixed or variable frequency shaker. For passive tests, the signal source is environmental and is mainly due to different causes, such as wind, sea wave motion, vibrations from structures and vehicle traffic, and other cultural activities (Bignardi 2011).
Active seismic surface wave methods have gained popularity internationally and are widely used in geotechnical engineering. These tests have a number of advantages, including the fact that they do not require drilling, which results in significant time and cost savings. In addition, surface wave tests avoid any potential environmental hazards associated with drilling. Also, since they do not require sampling, no sample disturbance occurs, making it an attractive test for hard-to-sample geomaterials. Unlike some other geophysical methods, surface wave methods are capable of detecting soft layers beneath stiffer layers, as well as soft layers sandwiched between two stiff layers.
The three most widely used active seismic surface wave tests are: spectral analysis of surface waves (SASW), multi-channel analysis of surface waves (MASW), and the continuous surface wave (CSW) method (Stokoe et al 2004). The advantages and limitations of each of these tests have been well documented in the literature. However, few direct comparisons of these tests have been reported. In cases where such comparisons have been made, tests were not performed with the same equipment, time sampling parameters, array configurations (spatial sampling range) and sometimes not on sites of the same geological nature (Kim et al 2013; Omar et al 2011). This paper reports the findings of an investigation comparing the performance of these three tests as objectively as possible.
SITE DESCRIPTIONS
Shallow bedrock site
SASW, MASW and CSW tests were conducted on the University of Pretoria experimental farm near the Civil Engineering Laboratory (Engineering 4.0). The site topography is generally flat, with vegetation comprising mainly grass and shrubs, with some trees. This is a shallow bedrock site with residual lava soils that had formed from the weathering of andesite lava, with the bedrock at a depth of about 3.0 m. The site is relatively quiet, as the only source of noise is the traffic from the N1 and N4 highways on the northern boundary of the site. This background noise was minimal, as the test site was about 230 m away from the nearest highway. The coordinate of the test position is 25°44'36.57"S, 28°15'34.48"E.
Deep bedrock site
The deep bedrock site is located near Vredefort in the Free State Province of South Africa. This site is located in the vicinity of an inactive bentonite mine near positions where piles had been installed to study their behaviour in expansive clays. The topography of this site is flat with vegetation consisting of dense grass and some scattered small trees. The bedrock is at a depth of about 12.0 m. The site was also quiet, as it is located far from any public roads or other activities that may cause background noise. The coordinate of the test position is 27°15'15.95"S, 27°16'00.90"E.
EQUIPMENT
For the continuous surface wave (CSW) tests two mechanical shakers were used, namely a low- and a high-frequency shaker.
The low-frequency shaker had a total mass of 80 kg and a peak force of 6.3 kN at a frequency of 22 Hz and was operated between 10 Hz and 22 Hz. The high-frequency shaker had a total mass of 70 kg and a peak force of 8.0 kN at a frequency of 90 Hz and was operated in the frequency range of 22.5 Hz to 90 Hz. A variable frequency drive (VFD) was used to adjust the frequency of the shakers as required.
For the SASW and MASW tests, the seismic energy was produced by impacting a steel plate 185 mm in diameter and 30 mm thick, placed on the ground, with 2.2 kg, 6.3 kg and 9.2 kg sledgehammers. Seismic signals were acquired using 4.5 Hz resonant frequency geophones with spikes to hold them firmly into the ground. The signals detected by the geophones were recorded with a PASI GEA 24 seismograph.
EXECUTION OF FIELD TESTS
SASW test execution
Common midpoint two-receiver SASW tests were conducted for this study. The tests were done for six sets of receiver spac-ings which were 1 m, 2 m, 4 m, 8 m, 16 m and 32 m. For each receiver spacing the ground was impacted three times on both sides of the centreline of the receivers using each of the 2.2 kg, 6.3 kg and 9.2 kg sledgehammers. The reason for the three shots was not for stacking of the data to improve the signal-to-noise ratio, but rather for assessment of the repeatability of the SASW test. Data was recorded for a period of 2 seconds with a logging frequency of 500 Hz.
MASW test execution
Two sets of MASW tests were conducted using a linear array of 24 geophones. Some researchers have suggested using a geophone spacing of 1 m, while others suggested a spacing of 2 m. For this reason, two sets of MASW tests were conducted using both 1 m and 2 m geophone spacings. Multiple source offsets for both sets of tests were used. These were 1 m, 2 m, 4 m, 8 m and 16 m for the 1 m geophone spacing, and 2 m, 4 m, 8 m, 16 m and 32 m for the 2 m geophone spacing. The variation of source offset was for investigation of near-field effects. Also, each one of the 2.2 kg, 6.3 kg and 9.2 kg sledgehammers was used at each source offset, impacting the steel plate three times for the assessment of the repeatability of the MASW test. As with the SASW test, the data was recorded for a period of 2 seconds with a logging frequency of 500 Hz.
CSW test execution
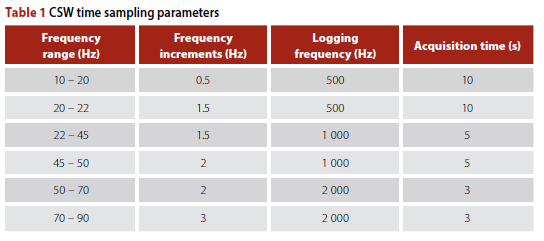
Monotonic and sweep CSW tests were done using an array of five geophones spaced at 1 m. For a monotonic test the frequency at which the shaker vibrates is held constant, and for a sweep test the frequency is varied from the lowest frequency of interest to the highest. The low- and high-frequency shakers were used to provide ground vibration in the frequency ranges of 10 to 22 Hz, and 22.5 to 90 Hz, respectively. Table 1 shows time sampling parameters for the different frequency ranges in which the shakers were operated. The tests were done at three different source offsets, which were 1 m, 2 m and 4 m for the investigation of near-field effects.
RESULTS AND DISCUSSION
Repeatability comparison
In this study, SASW data and CSW data were analysed using Python codes developed in-house using procedures that have been well documented in the literature (McCaskill 2014; Groenewold 2016; Strobbia 2003; Hebeler & Rix 2001; Heisey et al 1982; Bouazza & Kavazanjian 2000; Heymann 2007). The Python codes are available in Ntaote (2022). The MASW data was analysed using Geopsy software (www.geopsy.org) to produce dispersion overtone images. The dispersion data was extracted from the overtone images using the Geopsy extraction algorithm. A typical Geopsy's overtone image and the extracted dispersion data are shown in Figure 1.
The following nomenclature is used for CSW and MASW throughout the article:
■ CSWlm - CSW performed with the source at 1 m offset
■ CSW2m - CSW performed with the source at 2 m offset
■ CSW4m - CSW performed with the source at 4 m offset
■ MASWlm - MASW performed with 1 m geophone spacing
■ MASW2m - MASW performed with 2 m geophone spacing
■ MASW(geophone spacing)(source offset)(sledgehammer size) - MASW test performed at a particular geo-phone spacing and source offset using a specific sledgehammer size, e.g. MASW1m2m2.2kg for MASW performed at 1 m geophone spacing, 2 m source offset and 2.2 kg sledgehammer.
For this study, only the fundamental mode dispersion data was used for analysis. Figures 2, 3 and 4 show the dispersion data for the three surface wave tests for the shallow bedrock site, while Figures 5, 6 and 7 show the data for the deep bedrock site. The figures show that the frequency ranges for the three tests were different. The SASW test achieved the highest frequencies of up to 150 Hz. The CSW test measured frequencies up to 90 Hz; however, at frequencies above approximately 70 Hz, higher modes were excited at the shallow bedrock site, whereas higher modes were excited above frequencies of about 60 Hz at the deep bedrock site. Higher modes contain valuable information, but the inversion of higher mode data requires more sophisticated inversion algorithms than when using only fundamental mode dispersion data. As stated earlier, for this investigation, only fundamental mode dispersion data was used. The two MASW tests measured maximum frequencies of between 35 Hz and 74 Hz at both sites. When conducting seismic surface wave tests at low frequencies, dispersion data points become scattered as a result of low energy generated at these low frequencies. The SASW dispersion data became scattered below about 8 Hz and the dispersion data for the MASW tests became scattered below about 10 Hz. As stated earlier, for this investigation, for the CSW test, the frequency range used for the two shakers was 10 Hz to 90 Hz. Measurements at lower frequencies would be possible with larger shakers designed to be used at such low frequencies. For the SASW test, the dispersion data had very good repeatability between 8 Hz and 80 Hz. Above about 80 Hz, differences in the measured phase velocity can be observed. It is worth mentioning that, for the investigation of the repeatability of the SASW test, the data in the frequency range over which the hammers could produce a good signal was considered, because the objective of the repeatability assessment was to investigate if the test is capable of yielding the same results when done repeatedly, irrespective of the frequency range of the data. However, the data that was considered admissible to build composite dispersion data for determination of measurement depths is the data that had a coherence larger than 0.9 and whose plot of wrapped-phase angle against frequency showed a saw-tooth pattern. Observation of a clear saw-tooth pattern, as the phase angle changes from -n to n radians, is one of the quality control measures used for the SASW test (Stokoe et al 2004).
The MASW1m and MASW2 dispersion data showed good repeatability for most of the frequencies for which the overtone image displayed clear fundamental mode data, except near the upper end of the frequency range and below about 10 Hz. The CSW dispersion data showed predominantly fundamental mode Rayleigh wave propagation with some higher modes at frequencies above 60 Hz to 70 Hz. Although some of the data points are scattered, good repeatability is observed throughout the entire frequency range over which the shakers operated. This can be seen for both the fundamental mode as well as on higher modes. The good repeatability of CSW can be attributed to the fact that the source (shaker) generates a near sinusoidal wave at a single frequency, unlike for the SASW and MASW tests where the frequency content generated by the sledgehammer could vary from test to test. It should also be noted that, due to the high level of repeatability of the CSW test, the dispersion data for the three times that the test was repeated plot on top of each other, hence this makes it appear as if only one data set has been plotted (Figures 3 and 5).
All three seismic surface wave tests showed good repeatability of the measured dispersion data at both sites, and the depth of the bedrock appeared not to influence the repeatability of the data. When ranking the three tests in order of repeatability performance for the measured frequency range for each test, the CSW test performed the best, followed by the MASW test and then the SASW test. However, it should be noted that the SASW dispersion data had a larger frequency range, which may cause a negative bias of the test when compared with the other two tests which had smaller frequency ranges.
Near-field effects comparison
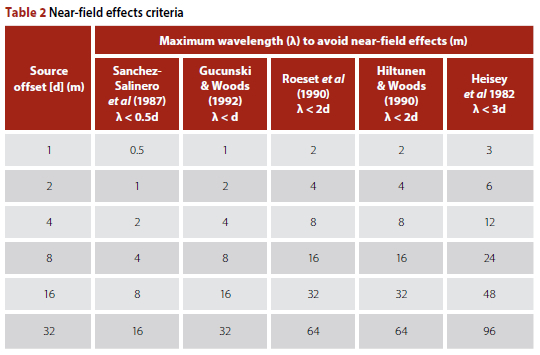
Close to the seismic source, cylindrically propagating Rayleigh waves occur, and further from the source the waves become near-plane Rayleigh waves. The region where the assumption of plane Rayleigh waves is not valid is called the near-field, and any adverse effects resulting from the invalid assumption are called near-field effects. Numerous authors have suggested near-field effects criteria. The maximum wavelength to avoid near-field effects range from 0.5d to 3d, where d is the distance between the source and the nearest receiver (Heisey et al 1982; Sanchez-Salinero et al 1987; Roesset et al 1990; Hiltunen & Woods 1990; Gucunski & Woods 1992; Hunter & Crow 2015). Most of these authors developed their criteria using numerical methods with only limited results from experimental work. Hiltunen and Woods (1990) used experimental data to suggest a maximum wavelength of 2d to avoid near-field effects. In this study, tests were performed with the source placed at multiple distances (offsets) from the nearest receiver, in order to investigate the susceptibility of the SASW, MASW and CSW tests to near-field effects. As explained in the test execution sections above, SASW was performed using source offsets of 1 m, 2 m, 4 m, 8 m, 16 m and 32 m. MASW1m tests were performed at source offsets of 1 m, 2 m, 4 m, 8 m and 16 m, whereas MASW2m tests were performed at source offsets of 2 m, 4 m, 8 m, 16 m and 32 m. The CSW tests were performed using offsets of 1 m, 2 m and 4 m.
Table 2 shows maximum wavelengths (X), in terms of minimum source offsets, at which near-field effects will start to occur, according to the criteria suggested by different authors. It is apparent that the shortest wavelength at which near-field effects are suggested to occur is 0.5 m for a 1 m source offset, as suggested by Sanchez-Salinero et al (1987), and may be as much as 96 m for a test performed at a source offset of 32 m, as suggested by Heisey et al (1982). When surface waves propagate in the near field, the measured Rayleigh wave phase velocity is slower than in the far field. Near-field effect can therefore be identified when the phase velocity is slower than the phase velocity for the same geophone positions, but the source placed at a larger offset. For the analysis of the dispersion data from this study, the data is displayed in Figures 8 to 10 for the shallow bedrock site, and in Figures 11 to 13 for the deep bedrock site. Lines of constant wavelength (i.e. X = 0.5, X = 1, etc) are shown to assist with the identification of wavelengths at which near-field effects start to occur.
The X values for diagonal lines range from 0.5 m to the maximum X corresponding to the maximum source offset used for that test, as shown in Table 2 (e.g. X ranges from 0.5 m to 24 m for SASW performed up to a source offset of 8 m, and X ranges from 0.5 m to 48 m for MASW performed up to a source offset of 16 m).
SASW dispersion data obtained with a 2.2 kg sledgehammer, as shown in Figure 8, shows no clear signs of near-field effects. However, for SASW tests performed with the 6.3 and 9.2 kg sledgehammers it can be seen that the phase velocity was underestimated when the tests were performed at a 1 m source offset, and this effect appears to be significant starting from wavelengths of at least 3 m, as can be seen in Figures 9 and 10, respectively. Therefore, near-field effects started to occur when the wavelength was longer than 3d, where d is the source offset.
MASW1m dispersion data for the source placed at 1 m, 2 m and 4 m is scattered and does not show clear fundamental mode trends. For the 6.3 kg and 9.2 kg sledgehammers there is a clear underestimation of the phase velocity at wavelengths (X) of 8 m and 12 m, respectively, when data from the 8 m and 16 m source offsets is compared. Near-field effect therefore occurred for wavelengths longer than the source offset. For the MASW2m dispersion data, near-field effects were less clear, but when again comparing the results for the 6.3 kg and 9.2 kg sledgehammers, an underestimation of the Rayleigh wave phase appears to occur for a wavelength (X) of 16 m when comparing the results for source offsets of 8 m and 16 m, indicating that near-field effects occurred if the wave-length was longer than the source offset.
For the CSW test, phase velocities measured at frequencies below 20 Hz were lower for source offsets of 1 m and 2 m than for a source offset of 4 m. At 20 Hz a wavelength of 8 m was generated at the shallow bedrock site. The results therefore indicate that near-field effects started to occur at wavelengths longer than 2d, where d is the source offset.
Figures 11 to 13 compare the dispersion data for the tests at the deep bedrock site. Near-field effects appeared to be more pronounced at this site than at the shallow bedrock site. For the SASW tests performed with the three hammer sizes, some higher mode excitation clearly occurred, so it is not possible to compare fundamental mode data at all frequencies. However, it appears that the data for the 1 m source offset underestimated the measured phase velocities compared with the other source offsets at wavelengths longer than 1 m, indicating that near-field effects start to occur when the source is less than one wavelength from the first receiver. For the MASW1m tests, underestimation of phase velocities measured at a source offset of 4 m, occurred at wavelength of between 3 m and 4 m, when compared to the larger offsets, suggesting that a minimum source offset of one wavelength is required to avoid near-field effects. For the MASW2m, underestimation of the phase velocities started to occur at wavelengths larger than 8 m for offsets less than 8 m, also indicating that near-field effects occur for a source offset less than one wavelength. For the CSW test, when comparing the data measured at a source offset of 4 m with the data for the 1 m and 2 m offsets, underestimation of the phase velocity started to occur at a wavelength of between 3 m and 4 m. This again suggests that the near-field effect becomes important when the source offset is less than about one wavelength.
Measurement depth comparison
This section focuses on the maximum and minimum measurement depths of the three tests at the two sites.
When comparing different seismic surface wave tests with regard to the maximum and minimum depth measured, the key parameters are the frequencies and wavelengths of the generated Rayleigh waves. High frequencies generate short wavelengths which are required to measure the shallow material with adequate resolution. In contrast, to determine the behaviour of deep geomaterials, long wavelengths are required which occur at low frequencies. When designing an active seismic surface wave test, some control is possible over the desired source frequency content. For instance, for a CSW test, high frequencies or low frequencies can be targeted by appropriate design of the shaker. However, there are some complexities that have to be considered. The CSW test is prone to generating higher modes at high frequencies. This can clearly be seen in the last graphs of Figures 2 to 13.
Inversion analysis with dispersion data that contains higher modes is done routinely, but requires an appropriate inversion algorithm and also judgement from the analyst to correctly identify the modes. For low-frequency deep measurements, a shaker capable of generating low frequencies is required. However, low frequency measurements require a powerful shaker, as a large volume of ground has to be excited. Hence, often the limitation of the shaker is not its lowest frequency, but the energy that can be generated at low frequency.
For the SASW and MASW test, when using a sledgehammer, the operator has little control over the frequency content and energy level of the source other than the type and size of hammer and anvil used. Common practice is to use steel-headed hammers of various sizes striking a steel plate. These factors make it difficult to compare the maximum and minimum depths that can be achieved by each of the three tests in a completely unbiased way. However, for this investigation the aim was to compare the maximum and minimum depth measurements that can be achieved using equipment that is often used in industry.
The maximum and minimum depths measured are shown in Figures 14 and 15 for the shallow bedrock site, and in Figures 16 and 17 for the deep bedrock site. Measurement depths were determined using Equation 1 which has been used by many researchers (Olafsdottir et al 2018; Hunter & Crow 2015; Park et al 2000; Yuan 2011).
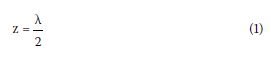
Where: z is the measured depth and X is the measured wavelength.
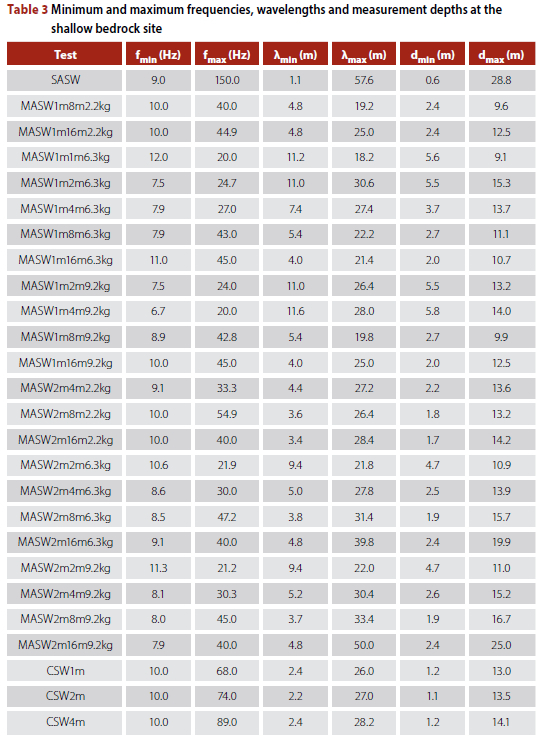
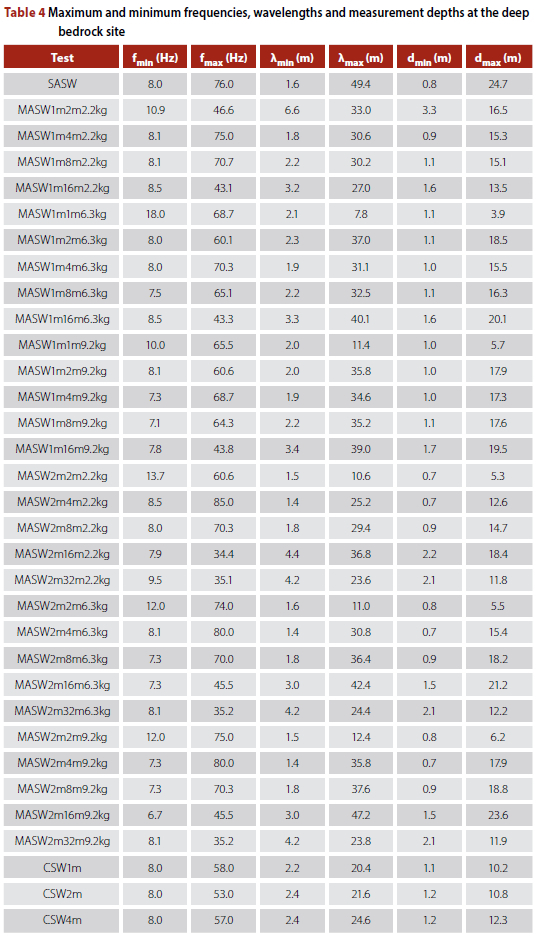
As explained earlier, only fundamental mode dispersion data was used to determine the measurement depths. The points in the low frequency range where the dispersion curves started to exhibit scatter were used to evaluate the maximum measurement depths, whereas the points at the high frequency end of the fundamental mode data were used to determine the minimum measurement depths. The maximum and minimum frequencies, wavelengths and measurement depths for the three tests at the shallow and deep bedrock site are shown in Tables 3 and 4 respectively. Depth comparisons are shown in Figures 14 and 15 for the shallow bedrock site, and in Figures 16 and 17 for the deep bedrock site. As explained in the SASW test execution section, common midpoint two receiver SASW tests were conducted for this study. The composite dispersion data was determined for six sets of receiver spacings and three impacts of each hammer. The source and receiver positions did not change for each common midpoint stage of the test, and hence the composite test is regarded as one test and not multiple tests. Therefore, in Figures 14 to 17 and in Tables 3 and 4, only one SASW test result is shown.
From Figure 14 it is clear that SASW was able to measure shallower than both the MASW and CSW, and the CSW test measured shallower than the MASW test. From Figure 15 it is also clear that SASW measured deeper than both MASW and CSW. The MASW and CSW tests measured to similar depth, except for very large MASW source offsets, where the MASW test measured deeper.
Table 4 shows the maximum and minimum frequencies, wavelengths and measurement depths at the deep bedrock site. The results of maximum and minimum measurement depth are plotted as bar charts in Figures 16 and 17 respectively. For MASW2m, performed at source offsets of 2 m and 4 m, the minimum depths were less than those obtained with the SASW and CSW tests. However, for offsets beyond these, the minimum depths measured by MASW2m were deeper than those of SASW and CSW. Clearly, for the MASW test the test geometry has to be chosen carefully when targeting shallow measurements. It is noteworthy that SASW measured slightly shallower than CSW regardless of the source offset used for CSW. With regard to maximum measured depth, SASW was able to measure deeper than MASW and CSW. The CSW measured deeper than the MASW with small offsets of 1 m and 2 m, but at larger offsets the MASW test measured deeper than the CSW test.
Summary
Table 5 gives a summary of the ranking of SASW, MASW (MASW1m and MASW2m) and CSW in terms of repeatability, resistance to near-field effects, as well as the minimum and maximum measurement depths. Near-field effects were less pronounced at the shallow bedrock site than at the deep bedrock site. All three tests performed similarly with regard to near-field effects at the deep bedrock site and are given an equal ranking.
CONCLUSIONS
This investigation compared the performance of three popular seismic surface wave tests in terms of repeatability of the test data, susceptibility to near-field effects, as well as the maximum and minimum depths that were measured.
All three surface wave tests performed well with regard to repeatability of the data. The CSW test data was the most repeatable. This may be attributed to the well-defined characteristics of the source, which was a mechanical shaker generating a monotonic Rayleigh wave. For the SASW and MASW tests, sledgehammers were used which do not generate an impact with exactly the same frequency content each time. Nonetheless, both tests exhibited good repeatability, with the MASW test slightly outperforming the SASW test. However, this has to be seen in the context of the frequency range measured by each test. The frequency range measured by the SASW test was significantly larger than that measured by the MASW test for the two chosen MASW test geometries. This may cause a bias against the SASW test when evaluating the repeatability of the data, because at frequencies below about 80 Hz the SASW test results were more repeatable than at frequencies above 80Hz.
With regard to near-field effects observed at the shallow bedrock site, the SASW test performed best with near-field effects being observed at wavelengths longer than 3d, where d is the source offset (distance between the source and the first receiver). For the CSW test near-field effects were observed for wavelengths longer than 2d and for the MASW tests at wavelengths longer than 1d. At the deep bedrock site near-field effects were observed for all three tests at wavelengths longer than 1d.
As noted in the discussion, the maximum and minimum depths that can be measured by each test are dependent on the choice of equipment, making it difficult to compare the tests in a completely unbiased way. However, for this investigation the aim was to compare the maximum and minimum measurement depths that can be achieved using equipment that is often used in industry. The SASW test was able to measure shallower and deeper than both the MASW and CSW tests at both sites. The reason for this is the fact that the SASW test is conducted with multiple test geometries. Measurements are taken at small geophone spacings and source offset to capture the short Rayleigh waves, and the spacings are progressively increased to also capture long Rayleigh waves. This benefit comes at the time cost of having to change the setup several times during the test. At the shallow bedrock site, the CSW test was able to measure to shallower depths than the MASW test; however, at the deep bedrock site the MASW measured to shallower depths than the CSW test when using short source offsets of less than 4 m. When using source offsets of more than 4 m, the CSW test measured to shallower depths than the MASW test.
At both the shallow and deep bedrock sites, the MASW test measured to greater depths than the CSW test when long source offsets were used for the MASW test. When short MASW source offsets were used, the CSW test was able to measure to greater depths than the MASW test. This indicates the importance of selecting the appropriate test geometry, according to the measurement depth of interest, when conducting the MASW test.
This investigation attempted to compare the performance of the three popular seismic surface wave tests (SASW, MASW and CSW) when using equipment that is often used in practice. The tests were only compared with regard to repeatability of the test results, susceptibility to near-field effects and depth of measurement. An aspect that was not considered was production rate of the tests, because this is dependent on the number of personnel on site, their experience, and ease of site access. The SASW and MASW test require significant space to conduct the tests, whereas the CSW test uses only a small number of geophones that do not have to be moved during the test and therefore require much less space. This is clearly an advantage on congested sites. Also, the CSW test allows for easy automation of the test, by stepping or sweeping through the frequencies of interest, significantly reducing the time required to conduct the CSW test.
REFERENCES
Bignardi, S 2011. Complete waveform inversion approach to seismic surface waves and adjoint active surfaces. Doctoral Thesis. Ferrara, Italy: Universitàdegli Studi di Ferrara. [ Links ]
Bouazza, A & Kavazanjian, E 2000. Characterization of municipal solid waste sites using the continuous surface wave method. Proceedings, International Society for Rock Mechanics and Rock Engineering (ISRM) International Symposium, November, Melbourne, Australia. [ Links ]
Foti, S, Hollender, F, Garofalo, F, Albarello, D, Asten, M, Bard, P Y et al 2018. Guidelines for the good practice of surface wave analysis: A product of the InterPACIFIC project. Bulletin of Earthquake Engineering, 16(6): 2367-2420. [ Links ]
Groenewold, F 2016. Comparison of SASW systems for coastal and offshore applications. Master's Dissertation. South Kingston, RI: University of Rhode Island. [ Links ]
Gucunski, N & Woods, RD 1992. Numerical simulation of the SASW test. Soil Dynamics and Earthquake Engineering, 11(4): 213-227. [ Links ]
Hebeler, G L & Rix, G J 2001. Site characterization in Shelby County, Tennessee, using advanced surface wave methods. Urbana, IL: MAE Center CD Release 06-02. [ Links ]
Heisey, J S, Stokoe, K H, Hudson, W R & Meyer, A H 1982. Determination of in situ shear wave velocities from spectral analysis of surface waves. Master's Dissertation. Austin, TX: University of Texas at Austin. [ Links ]
Heymann, G 2007. Ground stiffness measurement by the continuous surface wave test. Journal of the South African Institution of Civil Engineering, 49(1): 25-31. [ Links ]
Hiltunen, D R & Woods, R D 1990. Variables affecting the testing of pavements by the surface wave method. Transportation Research Record, 1260: 42-52. [ Links ]
Hunter, J A M & Crow, H L 2015. Shear wave velocity measurement guidelines for Canadian seismic site characterization in soil and rock. Ottawa: Natural Resources Canada, Geological Survey of Canada. [ Links ]
Kim, D S, Park, H J & Bang, E S 2013. Round Robin test for comparative study of in situ seismic tests. [ Links ]
Geotechnical and geophysical site characterization: Proceedings, 4th International Conference on Site Characterization (ISC-4), Vol 1. Abingdon, UK: Taylor & Francis, 1427-1434. [ Links ]
Matthews, M C, Hope, V S & Clayton, C R I 1996. The use of surface waves in the determination of ground stiffness profiles. International Journal of Rock Mechanics and Mining Sciences and Geomechanics Abstracts, 8(33): 360A-361A. [ Links ]
McCaskill, A 2014. A study on the benefits of including near-field effects in active-source surface wave data collection and interpretation. Doctoral Thesis. Columbia, MI: University of Missouri-Columbia. [ Links ]
Ntaote, M 2022. Experimental comparison of active seismic surface wave tests on shallow and deep bedrock sites. MEng Dissertation. University of Pretoria. [ Links ]
Olafsdottir, E A, Erlingsson, S & Bessason, B 2018. Tool for analysis of multichannel analysis of surface waves (MASW) field data and evaluation of shear wave velocity profiles of soils. Canadian Geotechnical Journal, 55(2): 217-233. [ Links ]
Omar, M N, Abbiss, C P, Taha, M R & Nayan, K A M 2011. Prediction of long-term settlement on soft clay using shear wave velocity and damping characteristics. Engineering Geology, 123(4): 259-270. [ Links ]
Park, C B, Miller, R D, Xia, J & Ivanov, J 2000. Multichannel seismic surface-wave methods for geotechnical applications. Proceedings, First International Conference on the Application of Geophysical Methodologies to Transportation Facilities and Infrastructure, 11-15 December 2000, St. Louis, MO, pp 11-15. [ Links ]
Roesset, J M, Chang, W, Stokoe, K H & Aouad, M 1990. Modulus and thickness of the pavement surface layer from SASW tests. Transportation Research Record, 1260, 53-63. [ Links ]
Sanchez-Salinero, I, Roesset, J M, Shao, K Y, Stokoe, K H & Rix, G J 1987. Analytical evaluation of variables affecting surface wave testing of pavements. Transportation Research Record, 1136. [ Links ]
Stokoe, K H, Joh, S H & Woods, R D 2004. Some contributions of in situ geophysical measurements to solving geotechnical engineering problems. Proceedings, International Conference on Site Characterization (ISC-2), 19-22 September 2004, Porto, Portugal, pp 97-132. [ Links ]
Strobbia, C 2003. Surface wave methods: Acquisition, processing and inversion. PhD Thesis. Turin, Italy: Politecnico di Torino. [ Links ]
Yuan, J 2011. Field studies comparing SASW, beamforming and MASW test methods and characterization of geotechnical materials based on Vs. Doctoral Thesis. Austin, TX: University of Texas at Austin. [ Links ]
 Correspondence:
M C Ntaote
Department of Civil Engineering, University of Pretoria
Private Bag X20, Hatfield, Pretoria, 0028, South Africa
E: mosito@ecoe.co.za / mositontaote@gmail.com
G Heymann
Department of Civil Engineering, University of Pretoria
Private Bag X20, Hatfield, Pretoria, 0028, South Africa
E: gerhard.heymann@up.ac.za

MOSITO NTAOTE (AMSAICE) is a geotechnical engineer in South Africa and a member of the SAICE Geotechnical Division. He holds BEng, BEng(Hons) and MEng degrees from the University of Pretoria. He practises mainly in the field of tailings where he is involved with design and assessment of the stability oftailings dams and other mine residue deposits. This paper formed part of his MEng research project at the University of Pretoria.

PROF GERHARD HEYMANN (Pr Eng, FSAICE) is a professor in the Department of Civil Engineering at the University of Pretoria. He holds BEng, BEng(Hons) and MEng degrees from the University of Pretoria, and a PhD from the University of Surrey. He has been involved with teaching and research in geotechnical engineering for many years. His fields of interests include the characterisation of soil behaviour and its application in geotechnical engineering. He is a past chairman of the SAICE Geotechnical Division. In 2 0 02 and 2016 he received the Jennings Award for the best geotechnical paper by a South African author, and in 2018 he received the South African Geotechnical Medal for his contribution to geotechnical engineering in South Africa.

