


Servicios Personalizados
Articulo
 Inglés (pdf)
 Articulo en XML
 Referencias del artículo
Indicadores

Links relacionados
-
 Citado por Google
 -
 Similares en Google
Compartir

 Permalink
Journal of the South African Institution of Civil Engineering
versión On-line ISSN 2309-8775
versión impresa ISSN 1021-2019
J. S. Afr. Inst. Civ. Eng. vol.65 no.3 Midrand sep. 2023
http://dx.doi.org/10.17159/2309-8775/2023/v65n3a2
TECHNICAL PAPER
http://dx.doi.org/10.17159/2309-8775/2023/v65n3a2
The status of water for firefighting in South Africa
A Ilemobade
ABSTRACT
It is mandatory in South Africa that water for firefighting is included in the demand estimates input when designing municipal water networks. To this end, guidelines for determining fire flows for different risk categories have been developed. The most commonly used guidelines are the South African National Standard (SANS) 10090 of 2018 and the Department of Human Settlements (DHS) guide of 2019 (also called the Red Book). The evolution of the built environment, firefighting technologies and approaches, and the availability of freshwater resources all require that the fire flows in the guidelines are current and adequately protect communities from the devastating impacts of fires - this while conserving depleting freshwater resources and contributing to optimal water network design. Currently, empirical research into the appropriateness of the fire flows in SANS 10090 and the Red Book to firefighting efforts in South African municipalities is limited. This paper therefore compares water for firefighting in these two guidelines with some international companions and local firefighting data, and also compares similar data from the six studies published on this topic in South Africa. Some highlights from this investigation include: (i) the fire risk categories and fire flows in SANS 10090 and the Red Book are misaligned, and are contradictory in at least one instance; (ii) when compared with firefighting data, the fire flows in SANS 10090 and the Red Book are conservative; (iii) a significant percentage of fires were extinguished between 30 and 120 minutes; (iv) 10 kl or less of water was employed to extinguish more than 87% of fires; and (v) the frequencies of fires were positively related to dry and/or cold weather conditions.
Keywords: water for firefighting, guidelines, fire flows, SANS 10090, Red Book
BACKGROUND
Firefighting infrastructure, although rarely used when compared to infrastructure that provides basic services, protects communities from the devastating impacts of fires. Sadly, fires have been shown to be devastating on many levels, including socioeconomic, financial, environmental and fatalities. The Department of Cooperative Governance (DCG 2020) estimates that R300 million is spent annually in South Africa to care for burns from paraffin stove incidents, while indirect costs such as lost wages, prolonged care for deformities, emotional trauma and commitment of family resources also contribute to the socioeconomic impacts of fires. In 2021, financial losses due to fires in South Africa were estimated at R23 billion (Walls et al 2022).
Several agents may be employed to extinguish fires, with water being the most popular due to several reasons, including its ease of availability, its relatively affordable cost, and its ability to extinguish most types of fires. Unfortunately, increasing aridity in many communities is negatively impacting the availability of freshwater resources, not only for firefighting, but more importantly, for meeting basic needs, sustaining economic development and maintaining environmental flows.
South African municipalities are legally obligated to provide water for firefighting (DHS 2019), and thus water for firefighting is given equal importance as drinking water when designing water networks. Water networks are therefore designed for both peak water demand plus fire demand, and as a result this may increase network capacity by as much as 20% (CSIR 2005).
Over the past thirty years, only six studies have been published in South Africa that analyse in detail, water for firefighting in various communities. These studies are: Van Zyl and Haarhoff (1997; 2007), Van Zyl et al (2011), Myburgh and Jacobs (2014), Mac Bean and Ilemobade (2019), Essack and Ilemobade (2022), and Thage and Ilemobade (2023). While these studies have been driven by similar objectives, their analyses have not produced results that can easily be compared and made generic to render firefighting efforts more efficient. This paper therefore addresses two objectives: (i) it presents the guidelines popularly used to estimate water for firefighting in South Africa, and compares same with some international companions and local firefighting data, and (ii) it compares similar data from the six studies published in South Africa and discusses some implications for firefighting.
THE SOUTH AFRICAN WATER FOR FIREFIGHTING GUIDELINES AND SOME INTERNATIONAL COMPANIONS
The South African National Standard specifying water for firefighting in different communities, SANS 10090, is titled Community Protection Against Fire (SANS 2018). The other well-known guideline specifying water for firefighting is called the Red Book and is titled The Neighbourhood Planning and Design Guide (DHS 2019). When water for firefighting values in both guidelines are compared (Table 1), the following is evident:
i. Both guidelines present different fire risk categories.
ii. The total fire flows in the Red Book are lower than the minimum values in the SANS 10090 for similar risk categories.
iii. Column 2 presents descriptions for "Fire risk categories" and column 3 presents descriptions for "Possible fire sizes", both of which are in Table 8 (Minimum fire flow) of the SANS 10090. While the descriptions for residential users (Category D1, D2, D3 and D4) in columns 2 and 3 are aligned, this is not the case for non-residential users in Categories A, B and C.
iv. Determination of the minimum fire flows for Categories C and D1 in SANS 10090 is misleading. For example, a residential area of conventional construction, where houses are spaced further than 30 m apart, would have SANS 10090 specify two minimum fire flows of 6 000 £pm (Fire risk categories, Category C) and 1 900 lpm (Possible fire sizes, Category D1).
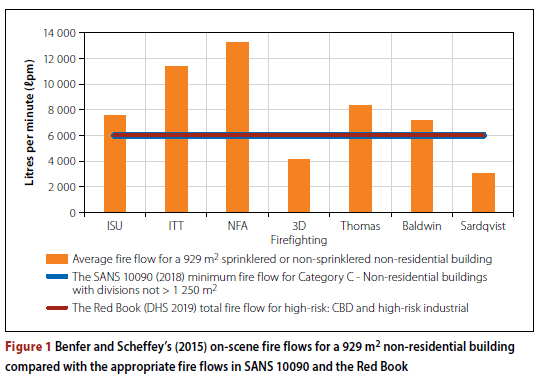
v. Both guidelines only address on-scene water for firefighting. On-scene water for firefighting refers to fire flow that is calculated (using simple, scientifically-based formulas) at the scene of the fire based on fire area or volume. On-scene water for firefighting allows firefighters on the scene to assess whether they need more hose lines or apparatus to fight the fire (Benfer & Scheffey 2015).
Benfer and Scheffey (2015) examined several fire flow calculation methods from the USA, UK, France, Australia, Germany, the Netherlands, New Zealand and Canada.
Eleven of the methods specifically addressed pre-incident building planning, and at least five addressed on-scene firefighting. The on-scene firefighting methods were: the Iowa State University method, ISU (USA); the Illinois Institute of Technology method, IIT (USA); the National Fire Academy method, NFA (USA); the 3D Firefighting method (USA/UK/Australia); and the Thomas, Sardqvist and Baldwin methods (UK, UK and USA respectively).
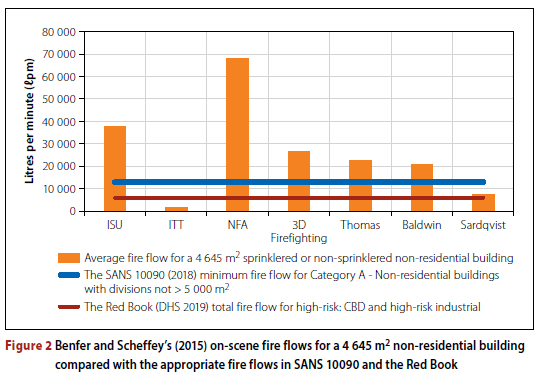
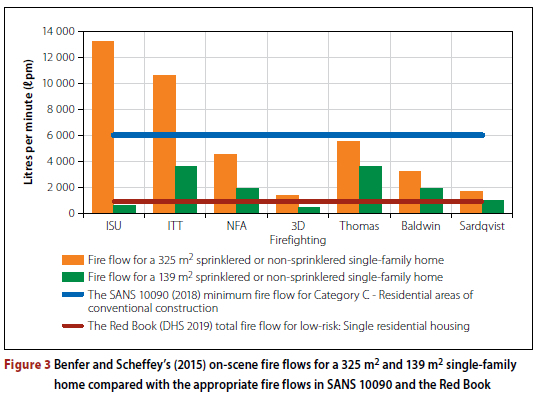
The fire flow methods were applied to two differently sized non-residential buildings and two differently sized single-family residential buildings. Their study included both sprinklered and non-sprinklered calculations. For on-scene firefighting, highlights from their study, compared with SANS 10090 and the Red Book, were: (i) fire flows varied greatly across the countries (Figures 1, 2 and 3); (ii) for residential buildings, all on-scene firefighting methods required the same fire flows irrespective of whether the buildings were fitted with or without sprinklers (Figure 3); and (iii) the appropriate SANS 10090 and the Red Book fire flows for non-residential buildings (929 m2 and 4 645 m2) are lower than most of the average fire flows determined by Benfer and Scheffey (2015) (Figures 1 and 2). For residential buildings, while this observation is similar for the Red Book total fire flow for the "Low-risk: Single residential housing" category, it is not for the minimum fire flow for the SANS 10090 Category C (Figure 3). In summary, the comparisons shown in Figures 1, 2 and 3 illustrate that, in general, the SANS 10090 and the Red Book fire flows are lower than the average fire flows determined by Benfer and Scheffey (2015) for more developed countries.
STUDIES ON WATER FOR FIREFIGHTING IN SOUTH AFRICA
Van Zyl and Haarhoff (1997; 2007) investigated fire incidents spanning 1980 to 1991 within a section of the Central Business District (CBD) in the City of Johannesburg (CoJ), Gauteng, and a residential area in the Province of Mpumalanga. Highlights of their study were: (i) extinguishing large fires in the CoJ over the 11-year period typically took between 30 and 90 minutes, with fire flows ranging between 300 and 2 100 tpm (large fires are fires that require more than 5 k£ to extinguish); (ii) 90% of the large fires investigated were extinguished using fire flows of 3 120 £pm or less and 440 k£ of water or less; and (iii) peak consumer demands were observed only at small intervals during the year, and usually did not coincide with fire events that typically took place in mid-winter.
Van Zyl et al (2011) studied water for firefighting in the Greater City of Cape Town area between 1 January 2005 and 21 April 2010. Highlights of their study include: (i) vegetation fires predominated the categories investigated and occurred mostly during the summer (no rain) months when weather conditions were conducive to vegetation fires; and (ii) 98%, 95% and 87% of residential, commercial and industrial fires respectively were extinguished in 120 minutes or less. Industrial fires had the longest durations and required the largest volumes of water to extinguish, while residential fires had the shortest durations and required the smallest volumes of water.
Myburgh and Jacobs (2014), employing a filtered database containing 554 records with water volumes and 546 records with computed fire flows from 1 January 2010 to 31 December 2010, analysed fire incidents within five towns (i.e. three municipalities) in the Province of the Western Cape (WC). Prior to filtering, the total number of records were 2 450. Highlights were: (i) more than 90% of fires were extinguished using less than 10 k£ of water while the average water volume used to extinguish 77 large Category 2 (structural and industry) fires was 8.60 1<£; and (ii) 91.4% of the 546 fires were extinguished using non-reticulated water supplies, i.e. municipal water supply was only directly used to extinguish 8.6% of the total number of fires and this was achieved because fire fighters used the pre-filled water tanks of emergency vehicles as the first line of defence in all fire calls.
Mac Bean and Ilemobade (2019) analysed about ten years (from 1 January 2006 to 30 September 2017) of 3 859 billable fire incident reports that occurred within the CoJ. The initial dataset comprised 4 556 records. Some highlights of their study were: (i) about 75% of fire incidents were extinguished using 6.60 k£ of water or less; 87% of fires were extinguished using 10 k£ of water or less, and 99% of fires were extinguished using 100 k£ of water or less; (ii) while the frequency of fire occurrence was strongly related to weather conditions, the volume of water used to extinguish fires was not; (iii) fire flows for 99.90% and 99.60% of the fire incidents were less than the minimum and total fire flows for the lowest fire risk categories in SANS 10090 and the Red Book respectively; and (iv) the peak of the start times of fires did not coincide with the typical peak period when residential water demand occurred (in fact, the least number of fires occurred during the typical peak period of residential demand).
Essack and Ilemobade (2022), using better representative criteria, re-analysed the initial CoJ database employed by Mac Bean and Ilemobade (2019), and in particular addressed 89 large fires from an initial dataset of 4 479 records (spanning 24 February 2003 to 26 September 2017). Some highlights of their study were: (i) an average of 32 incidents occurred per 30-day month, with an increase in the average number of fire incidents during Johannesburg's dry and cold months (i.e. May to September); the higher average number of fires during the cold months was attributed to households using unsafe appliances for heating and cooking, especially in informal settlements; and (ii) fire flows ranged between 0 and 180 £pm. With particular reference to large fires, additional highlights were: (iii) the duration of 60% of the large fires was between 30 and 120 minutes; (iv) the average volume of water employed to extinguish the large fires was 9.63 k£; (v) the fire flows employed to extinguish the 89 large fires were less than the minimum and total fire flows for the lowest fire risk categories in SANS 10090 and the Red Book respectively; and (vi) municipal water was used to supplement water conveyed in the vehicles in about 99% of 84 large structural and industry fires.
Thage and Ilemobade (2023) analysed 3 236 fire incident reports at the Sol Plaatje Municipality (SPM) in the Northern Cape during the period 21 July 2017 to 27 August 2020. After filtering, 2 060 reports remained. Some highlights of this study were: (i) the SPM experienced the highest number of fires in its predominant land uses, i.e. open veld (bush, grass, vacant/unspecified) and then the built environment; (ii) the average fire flow employed at the SPM to extinguish each category of fire was notably lower than the fire flow specified in SANS 10090 and the Red Book - this highlight is corroborated by the above studies; (iii) the average volume of water employed to extinguish all categories of fires at the SPM was 6 k£ or less, with 93.3% of SPM fires extinguished using 7 k£ of water or less; (iv) the average number of fire incidents in SPM peaked during the winter (July and August) and early spring (September) months. These months experience the least rain and the highest energy (electricity, wood, paraffin) consumption for heating and cooking use; (v) while fires in the SPM typically occurred between 11h00 and 20h00, the peak of the start times of fires during the course of a typical day was observed between 15h00 and 16h00. As a result, while the peak of the start times of fires and the peak of the residential water demand do not coincide in the morning, this is not the case in the afternoon; and (vi) about 81% of fires were extinguished in less than 135 minutes.
COMPARISON OF THE HIGHLIGHTS OF THE SOUTH AFRICAN STUDIES
A fire incident report (also called fire information report form) is a physical document that is filled out and typically submitted to emergency services after each fire incident attended to by the fire brigade (a template is presented in SANS 10090 2018:
Annexure B.2). Only billable fire incident reports were employed in the above studies. Billable fire incident reports are incidents that the fire department charges (or should have charged) the property owner for firefighting services rendered and is best explained by Sections 10.1 and 10.2 (Fees) of the Fire Brigade Services Act No 99 (Republic of South Africa 1987).
Fire incident reports that were legible, correctly completed, and had entries that were considered reasonable, were assumed to be a true reflection of the fires attended to by the emergency services. In the studies undertaken in the CoJ (Mac Bean & Ilemobade 2019; Essack & Ilemobade 2022), the five WC towns (Myburgh & Jacobs 2014), and the SPM (Thage & Ilemobade 2023), random and difficult-to-understand data in some fire incident reports were verified with emergency services personnel.
Typically, on-site calculations, based on water meter readings taken from different appliances, are carried out to estimate the total volume of water released over the duration of the incident. These calculations account for water obtained from fire trucks, water tankers and hydrants (Mac Bean & Ilemobade 2019). Seeing that physical records were employed (and still are) to capture details of fire incidents in the different communities, it is impossible to verify that the physical records provided represent all the fire incidents that took place within those communities.
Figure 4 on page 23 shows average fire flows employed to extinguish fires in Myburg and Jacobs (2014), Mac Bean and Ilemobade (2019), Essack and Ilemobade (2022), and Thage and Ilemobade (2023), plotted alongside the minimum and total fire flows in SANS 10090 and the Red Book, respectively. What is plainly obvious is that, over the approximately 15 years of data spanning 2003 to 2017, the minimum and total fire flows in SANS 10090 and the Red Book, respectively, are conservative (i.e. much higher than actual). Since these conservative fire flows must be incorporated into the design of water networks, it is inevitable that larger water network components (and consequently, longer retention times that negatively impact water quality) will result.
The average volume of water employed to extinguish 77 large structural fires in the WC study was 8.60 k£ (Myburgh & Jacobs 2014); 75% of fires were extinguished in the CoJ using 6.6 k£ of water or less (Mac Bean & Ilemobade 2019); the average volume of water employed to extinguish fires in the CoJ was 9.63 k£ (Essack & Ilemobade 2022); and 93.3% of fires were extinguished in the SPM using 7 k£ of water or less (Thage & Ilemobade 2023). Similarly, in the Davis (2000) study in New Zealand, the average volume of water used to extinguish 89.5% of 4 336 fire incidents was 10.228 k£. The implication of these results is that a large percentage of fires in these studies could be extinguished using water conveyed in the tanks of certain emergency vehicles employed to extinguish fires. For example, some water tankers can transport up to 10 k£ of water.
Figure 5 shows that at the CoJ (Mac Bean & Ilemobade 2019; Essack & Ilemobade 2022) and at the SPM (Thage & Ilemobade 2023), the frequency of fire incidents increases and peaks during the dry months (April/May to September) and is the lowest during the rainy periods (December to March). In the WC (Van Zyl et al 2011), the rainy months are between March and November, and this explains why the chart for the WC displays marginally lower frequencies between March to October when compared with frequencies at other times of the year. These results confirm the impact dry and/or cold weather has on the frequency of fires. It therefore makes sense for emergency services to annually plan and prepare for increased fire events occurring during the dry and/or cold periods.
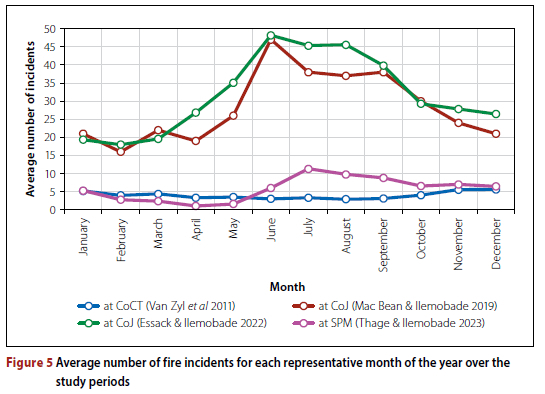
Figure 6 shows that, while the peak of the start times of fires and the peak of the typical residential water demands (DHS 2019) do not coincide in the morning (where the larger of the two residential peak demands occur in the diurnal pattern), this is not the case in the afternoon, as the start times of fires in the CoJ (Mac Bean & Ilemobade 2019) and SPM (Thage & Ilemobade 2023) peak at 15h00, about an hour prior to the afternoon peak demand. This is likely because heating (during the dry and cold months) and cooking facilities are mostly employed in the afternoons when children/families start to arrive home from school/work. The peaks of the start times for the commercial/business/industrial water demands also do not coincide with the peaks of the start times of fires.
Figure 7 shows the frequency distribution of the duration of large fires at the CoJ (Van Zyl & Haarhoff 1997, 2007; Essack & Ilemobade 2022) and at the SPM (Thage & Ilemobade 2023). In the three studies, more than 60% of the large fires were extinguished between 30 and 120 minutes, while in the CoJ, Essack and Ilemobade reported that ~20% of large fires were extinguished between 120 and 165 minutes.
CONCLUSION
This paper addressed two objectives. Each objective, and key highlights from addressing each, are presented below:
Objective 1:
To present the SANS 10090 (SANS 2018) and the Red Book (DHS 2019) guidelines for estimating water for firefighting in South Africa, and to compare same with some international companions and local firefighting data.
Key highlights:
i. The fire risk categories and fire flows in SANS 10090 and the Red Book are not aligned and are contradictory in one instance. It is imperative therefore that this misalignment is speedily resolved to prevent the haphazard selection of fire flows from either guideline during water network design.
ii. Minimum and total fire flows in SANS 10090 and the Red Book are conservative (i.e. much larger than the average fire flows employed to extinguish fires in the six studies reviewed) and therefore do not promote the optimal design of water networks. For SANS 10090 this may be attributed to the fact that the fire flows in the first edition were likely over-estimated for South Africa since they were compiled with the assistance of organisations from the United Kingdom, United States of America, Canada, New Zealand and Germany, and have not notably changed since then. For the Red Book, while fire flows were recently revised, the empirical data presented in this paper shows that these values are still conservative. While adequate fire protection must be provided to communities, it is recommended that the current fire flows be reduced in light of dire water scarcity and the need to design optimal water networks.
Objective 2:
To compare data from the six studies published in South Africa and to discuss implications for firefighting.
Key highlights:
i. In four of the six studies, the typical duration of fires did not exceed 120 minutes.
ii. The volume of water employed to extinguish 90%, 87% and 96% of fires in five towns in the WC, the CoJ and the SPM respectively, was 10 k£ or less. These results are especially important for developed communities that experience sub-optimal and/or erratic municipal water supply, as the possession of functional fire engines that can convey at least 10 k£ of water to site will result in extinguishing a significant percentage of fires in these communities.
iii. The frequencies of fires are related to weather conditions, with a higher number of fires occurring during the cold and dry months.
iv. Since there is a legal requirement to design water networks to cater for both peak and fire demand, further research into this aspect is necessary. If empirical firefighting data in other communities is similar to that shown in Figure 6 for the CoJ and SPM, this may provide additional evidence for reducing the peak factor employed in water network design.
ACKNOWLEDGEMENTS
Access to data has been fundamental to this study, and therefore emergency services in the following municipalities are gratefully acknowledged for providing access to primary data: the City of Johannesburg, the City of Cape Town, the five towns in the Western Cape, and the Sol Plaatje Local Municipality.
ETHICS CLEARANCE
Ethical clearance for each of the studies employed in the synthesis undertaken herein was separately obtained from the relevant authorities and acknowledged in each publication.
REFERENCES
Benfer, M E & Scheffey, J L 2015. Evaluation of Fire Flow Methodologies. Springer Briefs in Fire Series. New York: Springer. https://doi.org/10.1007/978-1-4939-2889- . [ Links ]
CSIR (Council for Scientific and Industrial Research) 2005. Guidelines for human settlement planning and design. Pretoria: CSIR Building and Construction Technology. [ Links ]
Davis, S K 2000. A review of firefighting water requirements. MEng Thesis. New Zealand University of Canterbury. https://ir.canterbury.ac.nz/items/88da908b-9520-4883-91e6-3bc87a494439. [ Links ]
DCG (Department of Cooperative Governance) 2020. White Paper on Fire Services. Notice 515 of 2020. Pretoria: DCG. https://www.gov.za/sites/default/files/gcis_document/202009/43734gen515.pdf. [ Links ]
DHS (Department of Human Settlements) 2019. The Neighbourhood Planning and Design Guide: Creating Sustainable Human Settlement (the Red Book). Pretoria: DHS. https://www.csir.co.za/neighbourhood-planning-and-design-guide-red-book. [ Links ]
Essack, F & Ilemobade, A 2022. Water for fighting large structural fires: A South African study. Urban Water Journal. https://doi.org/10.1080/1573062X.2022.2050928. [ Links ]
MacBean, C B & Ilemobade, A A 2019. An evaluation of the primary South African standard and guideline for the provision of water for firefighting. Water SA, 45(4): 691-699. https://doi.org/10.17159/wsa/2019.v45.i4.7551. [ Links ]
Myburgh, H M & Jacobs, H E 2014. Water for firefighting in five South African towns. Water SA, 40(1): 11-17. https://doi.org/10.4314/wsa.v40i1.2. [ Links ]
Republic of South Africa 1987. Fire Brigade Services Act 99 of 1987. Government Gazette 11006. Pretoria: Government Printer. https://www.gov.za/sites/default/files/gcis_document/201503/act-99-1987.pdf. [ Links ]
SANS (South African National Standard). SANS 100902018. Community Protection Against Fire (Edition 3.1). Pretoria: SABS Standards Division. [ Links ]
Thage, T & Ilemobade, A 2023. Water for firefighting in the Sol Plaatje Municipality. Civil Engineering, 31(5): 19-22. https://www.flipsnack.com/BE95BDAA9F7/civil-engineering-june-2023/full-view.html. [ Links ]
Van Zyl, J E & Haarhoff, J 1997. South African fire water guidelines and their impact on water supply system cost. Journal of the South African Institution of Civil Engineering, 39(1): 16-22. [ Links ]
Van Zyl, J E & Haarhoff, J 2007. Reliability analysis of municipal storage reservoirs using stochastic analysis. Journal of the South African Institution of Civil Engineering, 49(3): 27-32. https://saice.org.za/downloads/journal/vol49-3-2007/vol49_n3_d.pdf. [ Links ]
Van Zyl, J E, Davy, M & Haihambo, F 2011. Water used for firefighting in Cape Town. Proceedings, Computing and Control for the Water Industry (CCWI) Conference, University of Exeter, UK, pp 107-112. [ Links ]
Walls, R, Evans, J & Quiroz, N F 2022. SAICE Infrastructure Report Card 2022 - Fire engineering infrastructure summary report. Civil Engineering, 30(2): 58-63. https://saice.org.za/downloads/monthly_publications/2022/Civil-Engineering-March-2022/59/. [ Links ]
 Correspondence:
A Ilemobade
School of Civil and Environmental Engineering, University of the Witwatersrand
Private Bag 3, Wits, 2050, South Africa
E: adesola.ilemobade@wits.ac.za

PROF ADESHOLA ILEMOBADE (Pr Eng, FSAICE, FWISA) is currently at the School of Civil and Environmental Engineering, University of the Witwatersrand, Johannesburg, where he teaches infrastructure planning and water engineering subjects at undergraduate and postgraduate levels. His research interests are in the areas of water conservation, water demand and water supply. He is an NRF-rated researcher, has published extensively, received awards for research conducted and supervised, has led several multi-disciplinary research and consulting teams, and is an associate editor of several initiatives.

