


Services on Demand
Article
 English (pdf)
 Article in xml format
 Article references
Indicators

Related links
-
 Cited by Google
 -
 Similars in Google
Share

 Permalink
Journal of the South African Institution of Civil Engineering
On-line version ISSN 2309-8775
Print version ISSN 1021-2019
J. S. Afr. Inst. Civ. Eng. vol.65 n.1 Midrand Mar. 2023
http://dx.doi.org/10.17159/2309-8775/2023/v65n1a5
TECHNICAL PAPER
Evaluation of using local information from donor catchments to improve the performance of selected deterministic and empirical design flood estimation methods in South Africa
S Khoosal; J Smithers
ABSTRACT
There are a number of design flood estimation methods routinely used in South Africa. Flood Frequency Analysis (FFA) remains the preferred technique in instances where adequate records of observed data are available. However, in many parts of South Africa, rivers are not gauged for continuous streamflow monitoring. In the case of ungauged catchments, hydrologists and engineers generally make use of methods based on deterministic and empirical approaches for design flood estimation. Due to the limitations and performance of these methods, improved approaches need to be developed for design flood estimation in ungauged catchments. International practice has shown that making use of local information transfer from nearby gauged catchments, also referred to as donor catchments, can improve flood estimation in ungauged catchments. The main considerations for implementing such methods are the type of information transferred and selection of suitable donor catchments. Approaches for donor catchment selection include physical similarity, spatial proximity and integrated similarity. Some studies have also shown that the use of multiple donor catchments can offer further improvements. Thus, a methodology is proposed and evaluated in this paper for using local information transfer in the form of a method and location-specific adjustment factor from gauged donor catchments to improve the performance of selected deterministic and empirical flood estimation methods widely used in South Africa. The pilot study was undertaken at 48 catchments located in the north-eastern part of South Africa, with river flow data provided by the Department of Water and Sanitation. The results show that the degree of improvement for each of the methods is largely dependent on the approach used for donor catchment selection. Even though the best approach for donor catchment selection varied for the different design flood estimation methods, the integrated similarity approach performed consistently well for all methods considered. Similar to the use of single donor catchments, the results obtained from the use of multiple nearest donor catchments also varied for each of the methods used. Due to the general improvements, and the promising results and success of the simple approach used in this study, it is recommended that further refinements of the proposed methodology and approaches to donor catchment selection be considered for future research projects in order for the method to be used by engineers and hydrologists in practice.
Keywords: design flood estimation, donor catchments, spatial proximity, physical similarity, integrated similarity
INTRODUCTION
Road networks and developments are important for the economic, social and environmental development of a country. Flooding poses an important threat to road transport and can lead to massive obstruction of traffic and damage to road structures, with possible long-term effects (Rogelis 2015). In addition, excessive runoff can lead to damage to the environment and nearby properties, and in some instances can also result in loss of life.
Design Flood Estimation (DFE) is required for a wide range of applications, such as the design of road infrastructure (culverts, road-over-river bridges, etc) and flood risk assessments. There are three primary approaches to DFE used in South Africa - statistical, deterministic and empirical. The approach that is used depends largely on the historical data that is available at the site of interest (Parak 2007). Statistical methods make use of historical data to estimate design floods for a given Recurrence Interval (RI). Their use is thus limited to gauged catchments for which suitable flow records are available at the site of interest, or for catchments where records from adjacent gauged catchments are comparable and may be used (Van Vuuren et al 2013). Deterministic methods estimate the expected runoff from driving and contributing factors such as rainfall, based on the assumption that the RI of the estimated runoff is the same as the RI for the rainfall, while being influenced by catchment characteristic inputs and Model Parameters (MPs) (Gericke 2010). Empirical methods relate peak discharge and derived catchment descriptors in order to establish general regional parameters or at-site quan-tiles (SANRAL 2013). Empirical methods are better suited for checking the order of magnitude of quantiles estimated using other methods (SANRAL 2013). According to a survey conducted by Van Vuuren et al (2013), deterministic methods are the most commonly applied methods amongst hydrologists and engineers in South Africa due to the lack of available observed data at sites where hydraulic designs are required.
Standard techniques for DFE in ungauged catchments have been developed for most countries. Numerous DFE methods have been developed for use in South Africa and these are summarised in SANRALs Drainage Manual (SANRAL 2013) as statistical, deterministic and empirical methods. Some investigations have been undertaken to evaluate the performance of the methods by, for example, Van Bladeren (2005), Hogan (2007), Gericke and du Plessis (2012), Smal (2012), Nathanael (2015), Nathanael et al (2018), Smithers et al (2015a), Naidoo (2020) and Smithers et al (2021). These various studies have generally shown poor performance of the DFE methods commonly used in South Africa when compared to estimates from at-site Flood Frequency Analysis (FFA) of observed runoff data. Previous floods in South Africa, such as those of February 2000 in the north-eastern part of South Africa, Zimbabwe and Mozambique, and the Western Cape in 2005, and floods in the Free State and Eastern Cape in 2011, highlight the need to re-assess the risks associated with floods (Smithers 2012). In more recent times, devasting flood events have re-emphasised this need, most notably in the coastal regions of KwaZulu-Natal (KZN) in 2016, 2017, 2019 and 2022. The urgency for new approaches to DFE in South Africa was emphasised by Alexander (2002), Smithers and Schulze (2002), and Görgens et al (2007), and a National Flood Studies Programme (NFSP) has been initiated as reported by Smithers et al (2015b) to update and modernise DFE methods used in South Africa.
The aim of the pilot study reported in this paper was to assess the performance of incorporating local information transfer from donor catchments to improve DFE using selected existing deterministic and empirical flood estimation methods currently utilised in South Africa. The existing methods used in the study included the Standard Design Flood (SDF) with no adjustments made, as developed by Gericke and du Plessis (2012), Synthetic Unit Hydrograph (SUH), Rational Method (RM) and the HRU 1/71 empirical method, all of which are detailed in SANRAL (2013) and are currently used by engineers in practice. The following objectives were set:
■ To develop a methodology for incorporating local information transfer in conjunction with existing DFE methods used in South Africa.
■ To assess the performance of selected DFE methods before and after applying adjustment factors based on local information transfer from donor catchments using different approaches for donor catchment selection.
■ To determine the best method for donor catchment selection using a single donor catchment.
■ To determine the optimal number of donor catchments when using local information transfer from multiple nearest donor catchments.
INFORMATION TRANSFER FROM DONOR CATCHMENTS
In order to improve the confidence and accuracy of flood estimation in ungauged catchments and in catchments with limited hydrological data, local information from nearby gauged donor catchments can be incorporated to improve design flood estimates using existing techniques. This approach involves the transfer of information such as Model Parameters (MPs), hydrologic indices, streamflow data and, in some cases, global uncertainty from gauged to ungauged catchments. In international studies, these gauged catchments are often referred to as donor catchments.
The transferring of information from nearby gauged catchments is recommended for flood frequency and continuous runoff analysis for ungauged catchments. These 'donor' catchments aim to compensate for the local flood controlling factors that cannot easily be represented in the lumped catchment descriptor equations (Fleig & Wilson 2013). Improved estimation of streamflow in ungauged catchments thus requires the transfer of hydrologic information such as MPs, ratios, flow quantiles and predictive uncertainty from gauged donor catchments to ungauged subject catchments (Patil & Stieglitz 2012).
The major challenge in applying the principle of information transfer from gauged to ungauged catchments is identifying suitable donor catchments (Patil & Stieglitz 2012). Many methods exist for donor catchment selection. These include determining catchment similarity between gauged and ungauged catchments based on Physical Similarity (PS), Spatial Proximity (SP) and Integrated Similarity (IS).
The PS approach aims to transfer information between catchments which are similar in terms of observable catchment characteristics (Oudin et al 2008). In some cases, climatic information is considered in determining similarity (Li et al 2019). This method assumes that the hydrological behaviour of selected gauged catchments should be similar to that of the ungauged catchment (Hermanovský & Pech 2013).
The SP approach consists of transferring information from the nearest neighbouring donor catchment(s) to the subject ungauged catchment with the spatial proximity of the catchments measured by the distance between catchment centroids (Bourgin et al 2015). This approach assumes that catchments that are close to each other behave hydrologically similarly (Begou 2016).
Zhang and Chiew (2009) describe the IS approach as a combination of the PS and SP approaches. The geographic distance (SP) between the catchments is taken as an attribute together with other catchment attributes when determining catchment similarity.
In some cases, information transfer from multiple donor catchments are used for prediction at the subject site, i.e. ungauged catchment. In a multiple donor approach, several gauged catchments are used for information transfer to one subject site by transferring MPs (Zhang & Chiew 2009) or streamflow data to the ungauged site (Patil & Stieglitz 2012).
The transfer of local information such as MPs, hydrologic indices and global uncertainty from donor to subject sites has been shown to significantly improve the performance of existing methods. The ReFH method in the UK (Flood Estimation Handbook) makes use of local information from donor catchments by adjusting each parameter by the ratio of the observed and simulated parameter value at the donor. A similar approach is used for an index flood method. In the studies done in Australia by Zhang and Chiew (2009) and in France by Oudin et al (2008), the entire MP dataset was transferred from donor to subject ungauged catchments. Patil and Stieglitz's (2012) study in the United States (US) transferred flood quantiles from donor to subject ungauged catchments using an Inverse Distance Weighting (IDW) method.
Kjeldsen and Jones (2007) found a correlation between error and distance between donor and ungauged subject sites when using a transfer scheme for the index flood method in the United Kingdom (UK). A similar trend was also noticed by Patil and Stieglitz (2012) in their study in the US using the spatial proximity approach. Zhang and Chiew's (2009) study in Australia found that an integrated approach (combination of SP and PS) performed the best, followed by the spatial proximity and physical similarity methods, respectively. Oudin et al (2008) investigated the performance of the various approaches in France and found that the SP method was the best performing method compared to the PS and regression approaches. While most studies showed donor site selection can be successfully done using the SP method (relationship of distance between donor and receiver catchment), it was also evident that other factors such as topography, catchment characteristics and other physical parameters can also play a vital role in the performance of the approach.
Many of the studies reviewed agree that the use of multiple donor catchments can offer further enhancements for local information transfer from gauged donor catchments as opposed to using a single donor catchment. The optimum number of donors can vary anywhere between one and eight donors from the various studies in Australia, France, the UK and the US. The optimum number of donors was also found to vary for the different methods.
METHODOLOGY
This section outlines the method and procedure used for data collation and donor catchment selection. Furthermore, this section also details the assessment criteria used to evaluate the performance of the selected deterministic and empirical flood estimation methods before and after the inclusion of local information from one or more donor catchments.
Study area for pilot study
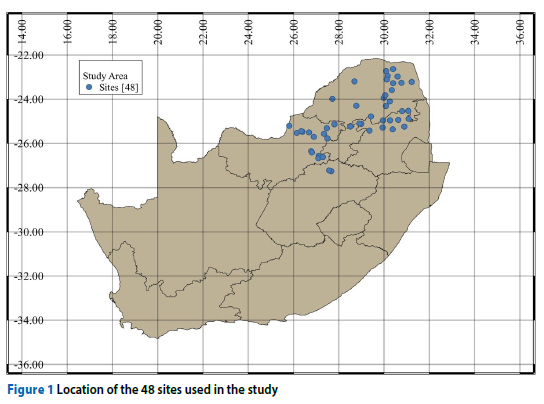
The gauged sites used in the study were obtained from the Flood Studies Group (FSG) of the Department of Water and Sanitation (DWS). The information obtained was derived from dam safety surveillance assessments undertaken by the FSG, and consisted of comprehensive and high-quality information related to design flood peaks for various DFE methods and estimated from synthesised inflow annual maximum flood peaks at various dam sites across South Africa (Naidoo 2020). For the purposes of this pilot study, 48 dam sites in the north-eastern part of South Africa were selected based on the record length of the observed data and good spatial density of the sites. The location of these sites are in five provinces, namely, North West, Free State, Gauteng, Limpopo and Mpumalanga, as illustrated in Figure 1. The database includes information such as catchment area (A), length of longest watercourse (L), length to catchment centroid (Lc), slope of longest watercourse (SL), time of concentration (Tc), mean annual precipitation (MAP), and design flood estimates using various DFE methods. The catchment areas ranged from 28 to 23.406 km2.
Donor catchment selection
In order to determine suitable donor catchments, three approaches were used in this study, which included the SP, PS and IS approaches. Each of the approaches and manner in which they were used are briefly described below.
Spatial Proximity (SP)
The SP criteria for the selection of a suitable donor catchment was based on the distance measured between the locations of the flow gauges of the subject catchment (treated as 'ungauged') and nearest gauged donor catchments determined using QGIS software (QGIS Development Team 2009).
Physical Similarity (PS)
The PS approach was based on catchments most similar to the subject catchment, based on physical catchment attributes. A, L, Lc, S and MAP were considered for determining PS. For a selected site, all other catchments within the study area were considered to be possible donor catchments. For each catchment attribute, the catchment with the most similar attribute to the subject catchment was ranked number one, the catchment with the second most similar attributes ranked number two, and so on. Each attribute was given an equal weighting. The ranks for each attribute were then summed and the donor catchment with the lowest value of summed ranks was chosen as the most similar donor catchment in terms of physical parameters.
Integrated Similarity (IS)
The IS approach incorporates both the SP and PS approaches. This was achieved by including the spatial distance between the donor catchment and subject ungauged catchment as an additional attribute. As above, the closest catchment was given a rank of number one. The rank for each of the attributes including SP was assigned equal weights.
Multiple nearest neighbour donor catchments
The multiple donor catchment approach considered all possible catchments in the study area as potential donor catchments, thus the number of multiple donor catchments for each subject catchment varied from 1 to 47 donors per site, based on the nearest donor catchment.
Information transfer from donor catchments
This section describes the approach developed to incorporate information transfer after identifying suitable donor catchment(s) using the various approaches detailed above.
Information transfer - single donor
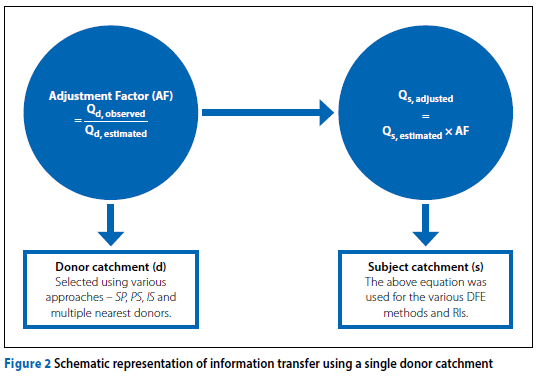
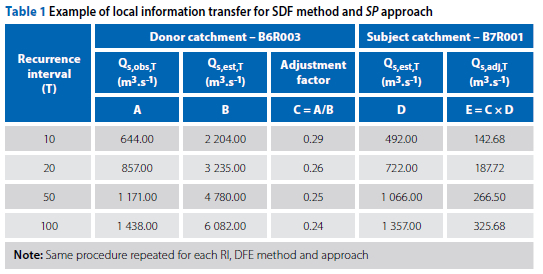
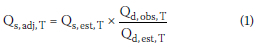
In order to adjust the flood estimates at a subject catchment, an adjustment factor was calculated based on the ratio of design floods estimated from the selected deterministic and empirical methods and the FFA of observed data at the donor catchment. This adjustment factor was transferred to the subject catchment as a multiplicative factor to adjust the estimated design flood using the original deterministic and empirical methods at the subject site. This adjustment factor was unique for each DFE method and RI. Equation 1 and Figure 2 describe the process used, and Table 1 further illustrates the concept with the aid of an example.
Where:
Qs adj T = adjusted DFE at the subject
catchment for T year RI (m3.s-1)
Qs, est, T = DFE at the subject catchment for T year RI (m3.s-1)
Qd, est, T = DFE at the donor catchment for T year RI using selected deterministic and empirical methods (m3. s-1)
Qd, obs, T = observed design flood at the donor catchment for T year RI (m3.s-1).
Information transfer - multiple donors
To establish a relationship between an optimal number of donor catchments, the number of nearest donors was varied from 1 to all possible gauged catchments within the study area, i.e. 47, and calculating the adjusted flood estimate Qs, adj, T using Equation 2, which is based on the output averaging technique.
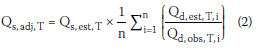
Where:
Qs, adj, T = adjusted DFE at the subject catchment for T year RI (m3.s-1)
Qd est T i = estimated DFE for the i-th donor catchment for T year RI (m3.s-1)
Qd, obs, T, i = observed design flood for the '-th donor catchment for T year RI (m3.s-1)
n = number of donor catchments.
In addition to the output averaging technique, the multiple donor approach was conducted using the median of the adjustment factors determined from the multiple sites.
Evaluation criteria
Various assessment criteria were used to determine the performance of the DFE methods, both before and after applying the adjustment factors using donor catchment(s).
Scatter plots
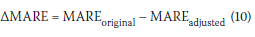
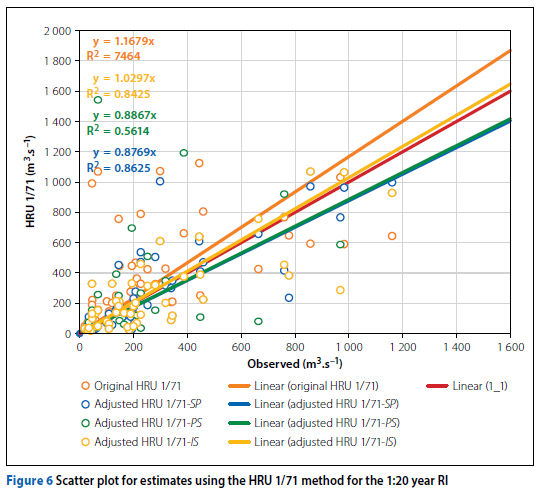
Scatter plots were produced in order to determine the performance of the DFEs from the various methods by plotting the adjusted estimates using the various approaches for donor site selection against observed estimates. The scatter plots provided a general indication of the tendency of the various methods to over- and under-estimate. The slope of the various regression lines and R-squared values (R2) were further evaluated to determine the performance of the various methods and information transfer approaches.
Relative Error
The Relative Error (RE) was used to provide an indication of the predictive accuracy of the DFEs before and after applying the adjustment factors using donor catchment(s) REoriginal and REadjusted respectively. In addition to predictive accuracy, REs also provided an indication of over-estimation (positive values) and under-estimation (negative values). REs at the subject catchments were calculated using Equations 3 and 4.
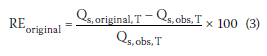
Where:
REoriginal = relative error of the original DFE methods (%)
Qs obs T = observed design flood at the subject catchment for T year RI (m3. s-1)
Qs, original, T = original peak flow at the subject catchment for T year RI (m3.s-1).
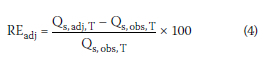
Where:
REadj = relative error of the adjusted DFE methods (%)
Qs, obs, T = observed design flood at the subject catchment for T year RI (m3. s-1)
Qs adj T = adjusted peak flow at the subject catchment for T year RI (m3.s-1).
Mean Absolute Relative Error
The Mean Absolute Relative Error (MARE) was determined for each site to quantify possible improvements of DFEs after applying the adjustment factors using donor catchment(s).
For single donor catchment transfer, the MAREs were calculated across the seven RIs for each site, i.e. 2, 5, 10, 20, 50, 100, 200-year. The MAREs were determined before and after applying the adjustment factors MAREoriginal and MAREadjusted using Equations 5 and 6, respectively.

Where:
MAREoriginal = mean absolute relative error for each site for the original estimates (%)
REoriginal t = relative error for each site for the original estimates for the T year RI (%)
T = number of T year RIs (7).

Where:
MAREadjusted = mean absolute relative error for each site for the adjusted estimates (%)
REadjusted T = relative error for each site for the adjusted estimates for the T year RI (%)
T = number of T year RIs (7).
In order to determine if each site experienced an improvement in design flood estimates, the MAREadjusted was subtracted from the MAREoriginal (see Equation 7). Positive differences indicated an improvement in MARE, while negative values indicated an increase in error, i.e. poorer estimate.

Where:
MAREadjusted = mean absolute relative error for each site for the adjusted estimates (%)
MAREoriginal = mean absolute relative error for each site for the original estimates (%).
In the case of multiple donor catchments, the MAREs were summarised over the seven RIs and sites in the study using Equations 8 and 9.
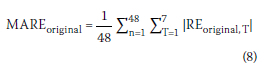
Where:
MAREoriginal = mean absolute relative error for each site for the original estimates (%)
REoriginal, t = relative error for each site for the original estimates for the T year
RI (%)
T = number of T year RIs (7)
n = number of catchments in the study area (48).

Where:
MAREadjusted = mean absolute relative error for each site for the adjusted estimates (%)
REadjusted T = relative error for each site for the adjusted estimates for the T year RI (%)
T = number of T year RIs (7)
n = number of sites in the study area (48).
Similar to the single donor catchments, the difference in MARE was calculated to determine possible improvements using Equation 10.
Where:
MAREadjusted = mean absolute relative error for each site for the adjusted estimates (%)
MAREoriginal = mean absolute relative error for each site for the original estimates (%).
RESULTS AND DISCUSSION
The results from the study are presented in this section based on the methodology outlined above. The results for the single donor transfer using the SP, PS and IS approaches are discussed first, followed by the multiple nearest donor catchment approach.
Single donor catchment transfer
The DFE methods used in this study included the SDF, SUH, RM and HRU 1/71 empirical methods. Flood estimates using these methods were adjusted by applying an adjustment factor as described in Equation 1 above. Three approaches for catchment selection were applied in order to determine which of the approaches would yield the best improvements.
Figures 3 to 6 provide scatter plots comparing the 1:20 year original and adjusted flood estimates using the various DFE methods and approaches for donor catchment selection. The scatter plots shown in Figure 3 for the SDF illustrate a significant overestimation of design flood estimates for the 1:20 year RI when applying the original SDF method, as the majority of the points lie above the 1:1 line and the slope of the regression line (4.53) is greater than 1. The slopes for the adjusted SDF estimates indicate a significant improvement, as the slopes of the regression lines are closer to the 1:1 line. While all three approaches for single donor catchment selection offer improvements, the PS approach provides a consistent improvement in terms of the slope of the regression line, and has the best correlation in terms of the R2 values for the SDF method.
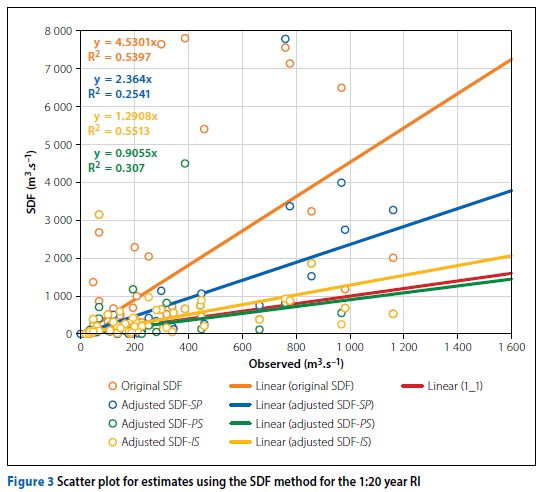
The adjusted RM estimates using the different approaches for single site transfer did not improve the original estimates, as the average slope for the regression line is closer to the 1:1 line for the original RM method and the R2 value was better than the values for the adjusted RM estimates (Figure 4).
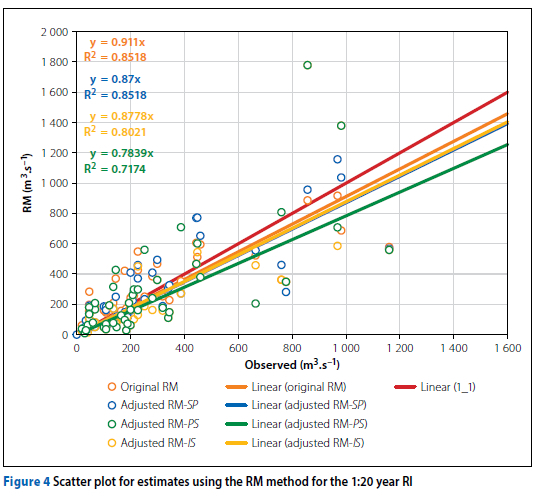
Similar to the original RM, the original SUH flood estimates generally performed well. However, the IS approach did result in improved performance, as the slopes of the regression lines are closer to the 1:1 line and there is a relatively good correlation of the data points, as can be seen in Figure 5.
Based on the slopes and R2 values it is evident that the adjusted HRU 1/71 design flood estimates, using the different approaches, offer improvements, as the slopes are closer to 1, with the IS approach performing the best. Both the SP and PS approaches generally slightly underestimate design floods; however, the SP approach produces a better correlation, as depicted in Figure 6 for the 1:20 year flood estimates.
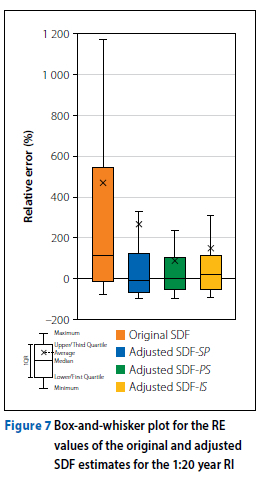
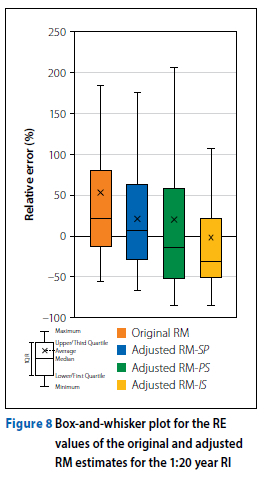
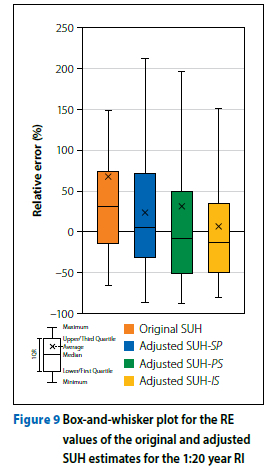
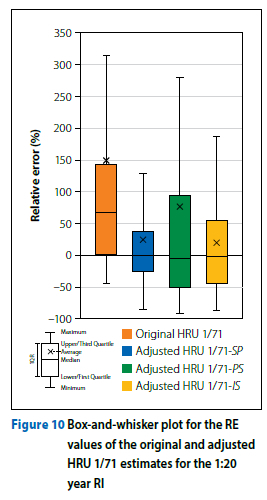
Box-and-whisker plots were produced to graphically represent the minimum, maximum and median REs. The IQR between the first and third quartile shows the spread and variability of the REs. Figures 7 to 10 provide examples of box-and-whisker plots of the median REs for the original and adjusted design flood estimates. When using a single donor catchment approach and applying the adjustment factors, the SDF method experienced the best improvement with the PS approach. The IQR of the median REs decreased from 554.6% to 161.7%, and the median RE decreased from 112.1% to 2.2% across the different RIs. As seen previously, the original RM performed relatively well before application of the adjustment factors. The RM performed the best in terms of improvements using the adjustment factors from the SP approach with a slight reduction in the range of median REs from 90.5% to 81.7% amongst improvements in the other criteria. Similar to the RM, Figure 8 illustrates that the original SUH method also performed relatively well based on this particular assessment criteria. The adjusted SUH estimates using the IS approach ranked first with slight improvements in the IQR from 88.2% to 82.2%. The adjustment factors based on the SP approach performed the best with the HRU 1/71 method, as can be seen in Figure 10 on page 52. The adjusted HRU 1/71 method using the SP approach showed a large improvement and ranked first for all of the assessment criteria.
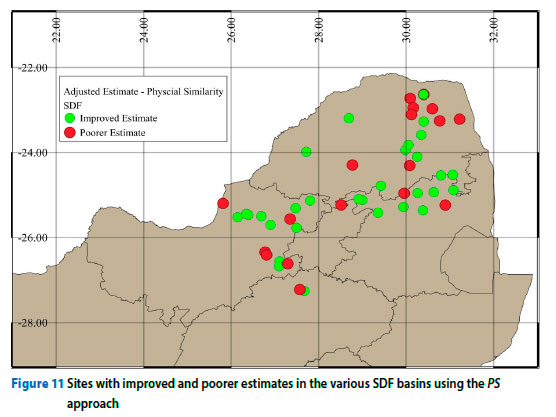
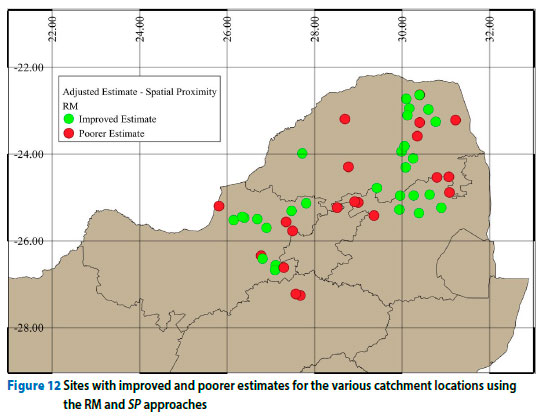
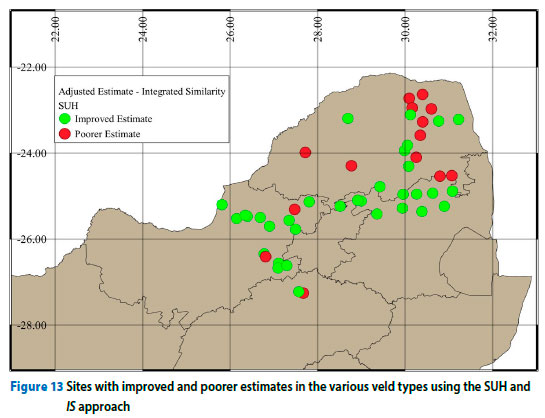
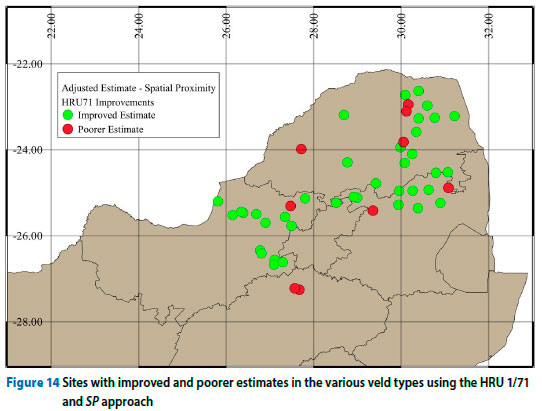
The analysis of the scatter plots and REs provided an indication of the performance of the original and adjusted design flood estimates. The MARE was calculated to determine the performance of the adjustment factors on a catchment-by-catchment basis. This was achieved by computing the MARE for the original and adjusted design flood estimates across the various RIs at each of the 48 catchments. The adjusted MARE was subtracted from the original MARE. A positive resultant for ÀMARE indicated an improvement, i.e. MAREoriginal > MAREadjusted and negative resultant indicated a poorer estimate, i.e. MAREoriginal < MAREadjusted. Figures 11 to 14 graphically illustrate the number of sites that experienced improved (green) and poorer (red) MAREs after application of the adjustment factors using the different approaches for donor catchment selection for the various DFE methods used in the study. The adjusted SDF design flood estimates performed equally well when the PS and IS approaches were used, with 30 (63%) of the 48 catchments experiencing an improvement in MARE of the design flood estimates. The adjusted RM design flood estimates experienced the most improvement using the SP approach, with 28 (58%) of the 48 catchments experiencing an improvement in MARE of the design flood estimates, as can be seen in Figure 12. The SUH and HRU 1/71 experienced the greatest number of improvements based on the MARE, with 34 (71°%) and 39 (81°%) of the 48 catchments experiencing improvements, respectively (see Figures 13 and 14).
Although the results in the figures above showed that the majority of the sites experienced improvements based on MARE, it was also important to review the catchments with poorer adjusted MAREs more closely. This was done by producing a box plot of the ÀMAREs, as shown in Figures 15 to 18, where positive values indicate an improvement and negative values indicate poorer results. Thus, while the adjustment factors offer significant improvements for a majority of the sites, it can be seen that there is significant underperformance at the catchments experiencing poorer results. For example, Figure 15 shows that the minimum values of ÀMARE are negative, i.e. poorer for the SP, PS and IS approaches, respectively, for the SDF method.
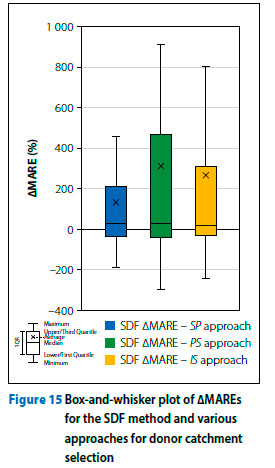
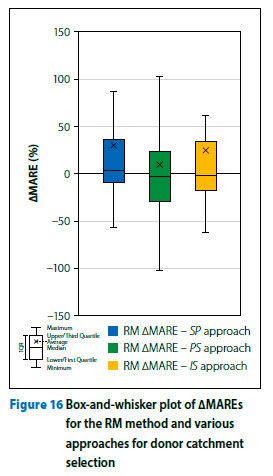
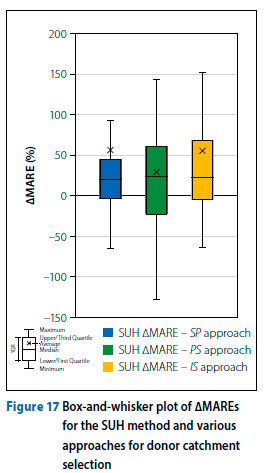
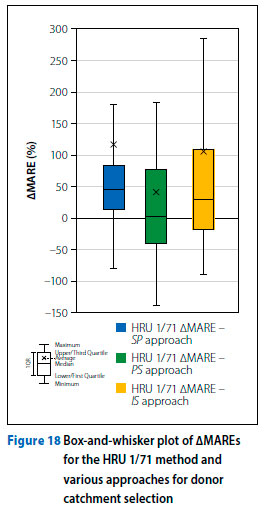
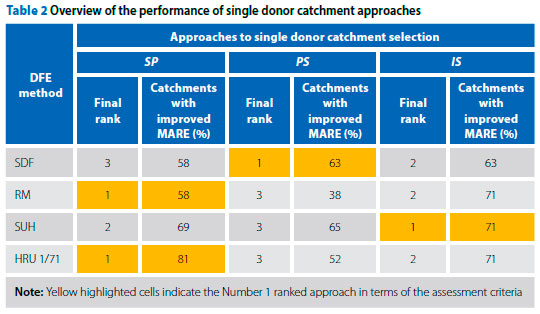
Table 2 shows the performance of the various approaches for donor catchment selection in terms of their final rank and the number of catchments with improved estimates. The SDF method experienced the best improvements using the PS approach, while the RM and HRU 1/71 experienced the best improvements using the SP approach, and the SUH experienced the best improvements using the IS approach. Even though the best performing donor catchment selection approach differed for each DFE method, the IS approach performed consistently with all methods, as it is generally ranked 2 or better and improved the DFEs at more than 63% of the sites for all DFE methods.
Multiple donor catchment transfer
The previous sections contain the results of information transfer from a single donor catchment using three approaches for donor catchment selection. This section contains the results from using information transfer from multiple nearest donor catchments using the procedure and methodology detailed above.
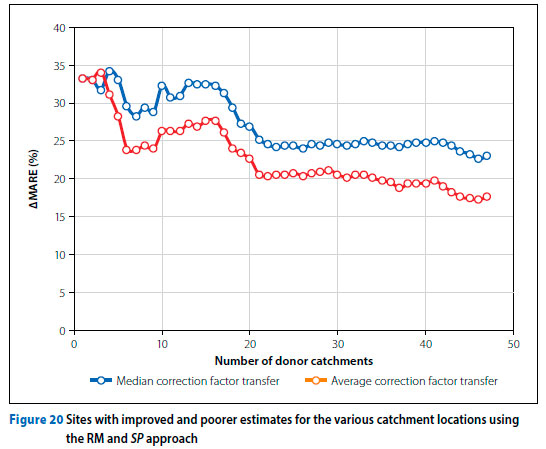
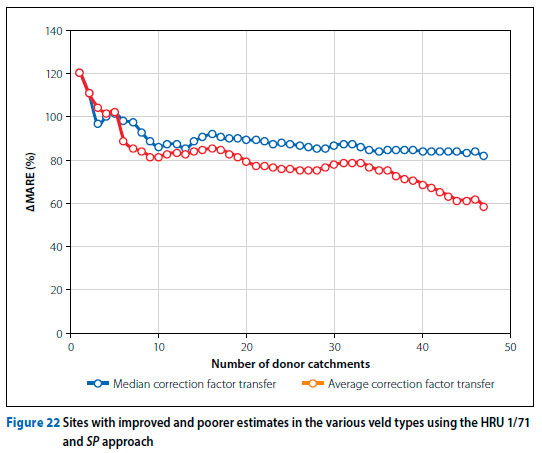
The aim of this part of the study was to determine the optimum number of donor catchments for information transfer when using multiple nearest neighbouring catchments. The adjustment factors were calculated by using an output averaging technique. In addition, median adjustment factors from the multiple donor catchments were also used for information transfer (see Equation 2). The performance of the two techniques of calculating adjustment factors was compared and is illustrated in Figures 19 to 22. In order to obtain general trends, the ÀMARE was calculated across the various RIs for each site, as described in Equations 8, 9 and 10. Figures 19 to 21 show a plot of ΔMARE versus the number of donor catchments. Positive values of ΔMARE and a rising trend with more donor catchments indicate improvements, while negative values and a downward trend indicate worsening of the MARE.
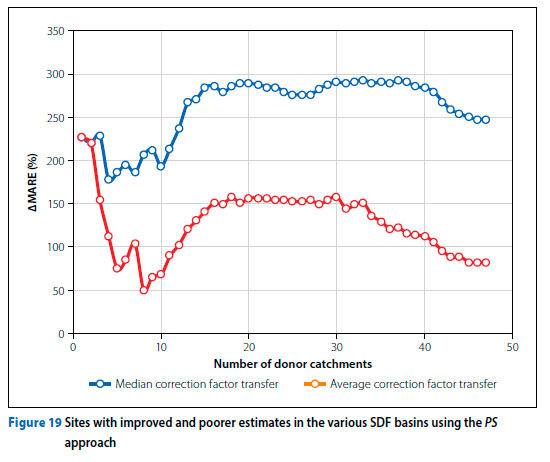
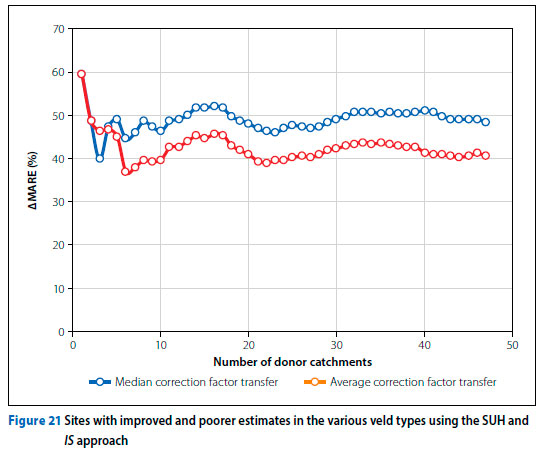
There are a number of observations that can be made from Figure 19. Firstly, the ΔMAREs using the median adjustment factors perform better than method-transferring average adjustment factors for the SDF method. Secondly, the ΔMAREs using the average adjustment factor transfer performs best when using one donor catchment, and increasing the number of donor catchments does not offer further
improvements. Furthermore, the ΔMAREs using the median adjustment factors show an improvement after increasing the number of donor catchments. A closer look at Figure 19 shows that the optimum number of donor catchments using the median adjustment factors for the SDF method is about 16 donor catchments, after which there are no significant improvements. In terms of the RM, the average adjustment factor performs best with three donor catchments, and the median adjustment factor performs best using four donor catchments compared to using a single donor catchment. However, it can also be seen from Figure 20 that the improvements using multiple donor catchments offered in both cases are small compared to using a single nearest donor catchment. Figure 20 and Figure 21 show that for both the SUH and HRU 1/71 methods the adjusted estimates perform best when using a single nearest donor catchment as opposed to using multiple donor catchments.
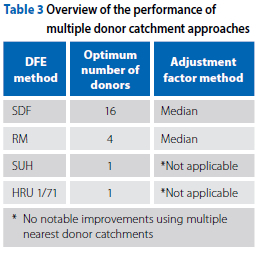
Table 3 contains a summary of the best adjustment factor method, i.e. average or median (Equation 2), and optimum donor catchments when using multiple nearest donor catchments.
DISCUSSION AND CONCLUSIONS
The study investigated the use of local information from donor catchments to improve design flood estimates calculated from selected deterministic and empirical methods in a pilot study at 48 sites located in the north-eastern part of South Africa. Data used in the study was obtained from the DWS Flood Studies Group, which was also used in a study by Naidoo (2020). The selected deterministic and empirical methods included the SDF, RM, SUH and HRU 1/71 empirical methods.
The first stage of the study was used to establish the performance of the original DFE methods. The results showed that the original methods resulted in relatively large errors compared to FFA of the observed data. The use of local information from donor catchments generally resulted in improvements. However, the quantum and quality of the improvements vary amongst the DFE methods. For example, the adjusted SDF and HRU 1/71 methods experienced more notable improvements than the adjusted RM and SUH method. It was also observed that the methods with the highest original error showed the most notable improvement when using local information transfer from single donor catchments, i.e. HRU 1/71 and SDF. This could possibly have resulted from the limited local information used in the development of the original methods.
It was further determined that, after applying the adjustment factors, the best approach for the selection of suitable donor catchments varied for each of the DFE methods. The SDF method performed the best using the PS approach, while both the RM and HRU 1/71 methods performed the best using the SP approach. The SUH method performed the best using the IS approach. Furthermore, the IS approach consistently performed well for all the DFE methods, with improvements at 63% to 71% of the sites. This range is expected, as the selected DFE methods in this study varied in terms of input parameters, information used to develop each method and different homogenous regions used in their development, i.e. SDF basins and veld zones.
The optimum number of donor catchments using multiple nearest donor catchments used two different transfer approaches, i.e. average adjustment factor transfer, and median adjustment factor transfer. In general, the results showed that the median adjustment factor transfer performed better than the average adjustment factor transfer. The optimum number of donor catchments for the SDF and RM using the median adjustment factor transfer was 16 and 4 donor catchments, respectively. It should also be noted that, although the RM showed improvements using four donor catchments, the improvements were slight improvements when compared to using a single nearest donor catchment. The SUH and HRU 1/71 did not show any further improvements using multiple nearest donor catchments. The difference in performance with various methods and number of donors is consistent with the results reported in previous studies, e.g. Zhang and Chiew (2009).
Thus, it can be concluded from this pilot study that the simple methodology of using local information from donor catchments, as used in this study, has the potential to offer improvements for estimating design floods using various existing DFE methods. With further refinement, this approach could be applied to both current and updated methods and to new methods that may be developed in the future.
RECOMMENDATIONS
While the study has shown promising results for improving the selected DFE methods by using local information transfer from donor catchments in the form of an adjustment factor, there still remains further scope for future research on this topic. Hence, the following recommendations are made for future investigations:
■ Original DFE methods: The DFE methods selected for this study showed inconsistencies and inaccuracies based on the REs and MAREs when compared to at-site FFA, thus highlighting the need for updating of these methods or the development of more reliable methods.
■ Scope of study: The pilot study included 48 sites in the north-eastern portion of South Africa. Therefore, consideration should be given to increasing the number of sites (reliable dam and weir sites) and expanding the study area across the country in order to evaluate the results at a national scale.
■ Adjustment factors: The adjustment factors determined in this particular study using donor catchments were calculated for each RI. Consideration can be given to calculating an average adjustment factor across the various RIs for information transfer from donor to subject catchments.
■ Selected DFE methods: The study considered four selected DFE methods, namely, the SDF, RM, SUH and HRU 1/71. The results showed that certain approaches for donor catchment selection performed better for certain DFE methods. Other DFE methods should be investigated using the methodology proposed in this particular study.
■ Physical and integrated similarity approaches: The PS and IS approaches for donor catchment selection used for single donor catchment transfer considered various catchment attributes where each attribute was given an equal weighting. Further investigation should be considered to reconsider appropriate attributes and to assign specific weights to each attribute based on their influence on runoff/catchment response to determine catchment similarity.
■ Multiple donor catchments: The multiple donor catchments considered the nearest donor catchments, thus relying on the proximity of donor catchments to the subject catchment. The multiple donor catchment approach can be used by also considering the PS and IS instead of the nearest donor catchments.
ACKNOWLEDGEMENTS
The study was supported by the National Flood Studies Programme (NFSP) and the South African National Roads Agency Ltd (SANRAL). The authors also wish to acknowledge Mr Jeremy Naidoo and the Department of Water and Sanitation (DWS) Flood Studies Group for providing valuable catchment characteristics and design flood estimation information used in the study.
Some acronyms used in the text:
DFE Design Flood Estimation
FFA Flood Frequency Analysis
FSG Flood Studies Group
IDW Inverse Distance Weighting
IS Integrated Similarity
MAP Mean Annual Precipitation
MARE Mean Absolute Relative Error
MPs Model Parameters
PS Physical Similarity
SDF Standard Design Flood
SP Spatial Proximity
REFERENCES
Alexander, W J R 2002. Statistical analysis of extreme floods. University of Pretoria. [ Links ]
Begou, J C 2016. Hydrological modeling of the Bani Basin in West Africa: Uncertainties and parameters regionalization. PhD Thesis. Abomey-Calavi, Benin: Universtiy of Abomey-Calavi. [ Links ]
Bourgin, F, Andréassian, V, Perrin, C & Oudin, L 2015. Transferring global uncertainty estimates from gauged to ungauged catchments. Hydrology and Earth System Sciences, 19(5): 2535-2546. [ Links ]
Fleig, A K & Wilson, D 2013. Flood estimation in small catchments. Report No 60-2013. Oslo, Norway: Norwegian Water Resources and Energy Directorate. [ Links ]
Gericke, O J 2010. Evaluation of the SDF method using a customised design flood estimation tool. MEng Dissertation. Stellenbosch University. [ Links ]
Gericke, O J & Du Plessis, J A 2012. Evaluation of the standard design flood method in selected basins in South Africa. Journal of the South African Institution of Civil Engineering, 54(2): 2-14. [ Links ]
Görgens, A H M, Loyons, S, Hayes, L, Makhabane, M & Ma luleka, D 2007. Towards the modernisation of South African design flood practice in the context of dam safety. WRC Report No 1420/2/07. Pretoria: Water Reseach Commission. [ Links ]
Hefmanovský, M & Pech, P 2013. Selection of catchment descriptors for the physical similarity approach. Part I : Theory. Soil and Water Research, 2013(3): 133-140. [ Links ]
Hogan, K D 2007. Design flood peak determination in the rural catchments of the Eastern Cape, South Africa. MEng Dissertation, University of Cape Town. [ Links ]
Kjeldsen, T R & Jones, D A 2007. Estimation of an index flood using data transfer in the UK. Hydrological Sciences Journal, 52(1): 86-98. [ Links ]
Li, Q, Peng, Y, Wang, G, Wang, H, Xue, B & Hu, X 2019. A combined method for estimating continuous runoff by parameter transfer and drainage area ratio method in ungauged catchments. Water (Switzerland), 11(5): 1-18. [ Links ]
Naidoo, J 2020. An assessment of the performance of deterministic and empirical design flood estimation methods in South Africa. MSc Dissertation. Pietermaritzburg: University of KwaZulu-Natal. [ Links ]
Nathanael, J 2015. Assessing the performance of regional flood frequency analysis methods in South Africa. MSc Dissertation. Pietermaritzburg: University of KwaZulu-Natal. [ Links ]
Nathanael, J, Smithers, J & Horan, M 2018. Assessing the performance of statistical regional flood frequency analysis methods in South Africa. Water SA, 44(3): 1-12. [ Links ]
Oudin, L, Andréassian, V, Perrin, C, Michel, C & Le Moine, N 2008. Spatial proximity, physical similarity, regression and ungauged catchments: A comparison of regionalization approaches based on 913 French catchments. Water Resources Research, 44(3): 1-15. [ Links ]
Parak, M 2007. Flood estimation for roads, bridges and dams. MSc Dissertation. Durban: University of KwaZulu-Natal. [ Links ]
Patil, S & Stieglitz, M 2012. Controls on hydrologic similarity: Role of nearby gauged catchments for prediction at an ungauged catchment. Hydrology and Earth System Sciences, 16(2): 551-562. [ Links ]
QGIS Development Team 2009. QGIS Geographic Information System. Open Source Geospatial Foundation. Available at: http://www.qgis.org. [ Links ]
Rogelis, M C 2015. Flood risk in road networks. Report No 100085. Washington DC: World Bank. [ Links ]
SANRAL (South African National Roads Agency Ltd) 2013. Drainage Manual, 6th ed. Pretoria: SANRAL. [ Links ]
Smal, R 2012. Evaluation of the Catchment Parameter (CAPA) and Midgley and Pitman (MIPI) empirical design flood estimation methods. MSc Dissertation. Stellenbosch University. [ Links ]
Smithers, J C 2012. Methods for design flood estimation in South Africa. Water SA, 38(4): 633-646. [ Links ]
Smithers, J C & Schulze, R E 2002. Design rainfall and flood estimation in South Africa. WRC Report No K5/1060. Pretoria: Water Research Commission. [ Links ]
Smithers, J C, Streatfield, J, Gray, R P & Oakes, E G M 2015a. Performance of regional flood frequency analysis methods in KwaZulu-Natal, South Africa. Water SA, 41(3): 390-397. [ Links ]
Smithers, J C, Görgens, A H M, Gericke, J O, Jonker, V & Roberts, C P R 2015b. The initiation of a National Flood Studies Programme for South Africa. Pretoria: SANCOLD. [ Links ]
Smithers, J C, Rowe, T J, Schulze, R E, Mabila, N, Dlamini, N S, Maharaj, U & Ramlall, R 2021. Further development, updating and assessment of the SCS-SA model for design flood estimation in South Africa using a continuous simulation approach. WRC Report K5/2926. Pretoria: Water Research Commission. [ Links ]
Van Bladeren, D 2005. Verification of the proposed Standard Design Flood (SDF). Report No 344512/1. Pretoria: SRK Consulting. [ Links ]
Van Vuuren, S J, Van Dijk, M & Coetzee, G L 2013. Deliverable 1: Status review and requirements of overhauling Flood Determination Methods in South Africa. WRC Report No K8/994. Pretoria: Water Research Commission. [ Links ]
Zhang, Y & Chiew, F H S 2009. Relative merits of different methods for runoff predictions in ungauged catchments. Water Resources Research, 45(7): 1-13. [ Links ]
 Correspondence:
Shaheil Khoosal
SANRAL Southern Region 20, Shoreward Drive Baywest
Port Elizabeth 6025, Eastern Cape, South Africa
E: khoosals@nra.co.za
Jeff Smithers
Centre for Water Resources Research, University of KwaZulu-Natal
Pietermaritzburg 3201, South Africa
E: smithers@ukzn.ac.za

SHAHEIL KHOOSAL (Pr Eng, MSAICE) has 11 years of experience in the roads and highways sector. After obtaining his BSc in Civil Engineering at the University of KwaZulu-Natal(UKZN) in 2011, he joined the South African National Roads Agency Ltd (SANRAL). Over the years he has been involved in the planning, design and construction of roads projects in different capacities, such as site engineer, design engineer and project manager. He is now a mentor, coach and design engineer at the SANRAL Technical Excellence Academy. During his career so far he has developed a special interest in design flood estimation for the design of roadway drainage structures. Hence the results presented in this paper are from his MSc Civil Engineering degree which he obtained from UKZN in 2021, and which also formed part of the National Flood Studies Programme (NFSP). Currently he continues to do research in design flood estimation as a part-time PhD student at UKZN.

PROF JEFF SMITHERS (Pr Eng) was awarded PhD, MSc Engineering and BSc Engineering (Agric) degrees from the University of Natal (now known as the University of KwaZulu-Natal). He is currently serving as the Umgeni Water Chair in Water Resources Research and Innovation, and is also the Director of the Centre for Water Resources Research, both at the University of KwaZulu-Natal. He has a wide range of research interests, which include engineering and design hydrology, and in this capacity he is leading the National Flood Studies Programme in South Africa, which is updating and modernising methods used for design flood estimation in South Africa. He is also associated with the National Centre for Engineering Agriculture at the University of Southern Queensland in Toowoomba, Australia, and locally with JG Afrika who are engineering and environmental consultants based in Pietermaritzburg.

