


Services on Demand
Article
 English (pdf)
 Article in xml format
 Article references
Indicators

Related links
-
 Cited by Google
 -
 Similars in Google
Share

 Permalink
Journal of the South African Institution of Civil Engineering
On-line version ISSN 2309-8775
Print version ISSN 1021-2019
J. S. Afr. Inst. Civ. Eng. vol.65 n.1 Midrand Mar. 2023
http://dx.doi.org/10.17159/2309-8775/2023/v65n1a4
TECHNICAL NOTE
Evaluation of Kovacs 1988 Regional Maximum Flood Method
J A du Plessis; S Masule
ABSTRACT
Estimation of design flood peaks is required for the design and evaluation of hydraulic structures. Methodologies developed between the 1960s and the late 1980s, such as the Regional Maximum Flood (RMF), are used to estimate extreme flood peaks in South Africa. The RMF method uses envelope curves to estimate the maximum flood that can be expected in a specific region in South Africa and neighbouring countries, and represents an indicative upper flood limit for other flood estimation methods. The method developed by Kovacs for South Africa was last updated in 1988. Using more than 30 years of additional data for analysis, this paper highlights the RMF's perceived shortcomings. In two RMF regions, updated observed flood peaks exceeded the existing envelope curves. In 78% of the catchment areas of the evaluated stations, the station RMF values were at least 50% more than the observed maximum flood peak. When the different parameters from the Kovacs 1988 and present DWS (Department of Water and Sanitation) datasets were compared, 98% of the evaluated stations had different flood peaks recorded/reported, while 33% of the stations logged different catchment area sizes. Kovacs 1988 ratios used to estimate flood peaks at different probabilities of occurrence, using the RMF, were found to generally over-estimate expected flood peaks. It is concluded that the 1988 RMF method needs to be updated to still provide relevant guidance.
Keywords: Regional Maximum Flood (RMF), flood peaks, Kovacs, envelope curves, extreme floods
INTRODUCTION
South Africa has experienced significant flooding since 1981, which include the cyclone Domonia floods in 1984, KwaZulu-Natal floods in 1987, Orange River Basin floods in 1988 and Limpopo floods in 2000 (Görgens et al 2006). Additionally, the Western Cape experienced flooding in 2005, while the Eastern Cape and Free State experienced flooding in 2011 (Smithers 2012). To design and evaluate hydraulic structures, a clear understanding of the magnitude and probability of occurrence of flood peaks is needed. According to SANCOLD (1990), the Safety Evaluation Discharge (SED) is used as a general criterion to evaluate the sufficiency of a spillway for a new or existing dam. The SED is based on an extreme flood, hence calculated using the Regional Maximum Flood (RMF) method (SANCOLD 1990). The SED is expressed as an unrouted discharge based on the calculated RMF. The RMF is also widely used by practitioners, particularly in the Department of Water and Sanitation (DWS), to assess the resulting flood peaks when using different estimation approaches. The RMF method is an empirical method that relates flood peaks to catchment size, and physiographic and meteorological characteristics (Smithers 2012). The RMF is an upper-limit extreme flood peak for a particular region, estimated using envelope curves (Kovacs 1988). The method has not been updated since 1988. The method was adopted from Francou and Rodier (1967) by Kovacs in 1980 for South Africa (Kovacs 1980). Pilon and Adamowski (1992), cited by Smithers (2012), credit the method for its ability to estimate an extreme flood without streamflow data. Several studies (Pegram & Parak 2004; Görgens et al 2007; Van Vuuren et al 2013; Smithers 2012; Nortje 2010) reviewed the method.
REVIEWS ON THE RMF
According to Pegram and Parak (2004), the RMF method is robust and simple to use in estimating maximum floods at any site using only the regional scale and catchment area. Alexander (1990) claimed that the RMF method is reliable in medium-sized catchments. However, other studies have found inconsistencies in the method. Görgens et al (2006) showed that post-1988 flood peaks may have exceeded the RMF envelopes. According to Parak (2007), the RMF does not give an exact design flood peak.
Görgens (2002) stated that "... statistically speaking, the method used to determine Kovacs (1988) RI ratios was too simplistic ..." and through a re-analysis it showed that the 1:200-, 1:100-, 1:50-year RI ratios needed to be reduced by 0.90, 0.80 and 0.70, respectively. According to Parak (2007), the recurrence interval (RI) ratios may need to be scaled down. Van Vuuren et al (2013) stated that the Kovacs procedure used in the 1988 RMF analysis should be revised to include all available data to reproduce the maximum envelope curves. According to Nortje (2010), the RMF method cannot confirm the Annual Exceedance Probability (AEP) of the RMF value for a given site. Nortje (2010) further stated that the RMF's AEP is not constant, but varies significantly between sites and regions. Smithers (2012) stated that the Kovacs (1988) RMF regions should be updated and refined. He added that it would be prudent to investigate the use of probability of exceedance associated with the RMF. Verwey (2015) stated that Kovacs's method of regionalis-ing Kr values (calculated Francou and Rodier K-value) into KE values (Kovacs Envelope Curve K-value) is inconsistent. Several deficiencies were further investigated in this review. This paper aims to evaluate the performance of the Kovacs RMF method through comparative analyses to determine the method's current applicability.
METHODOLOGY
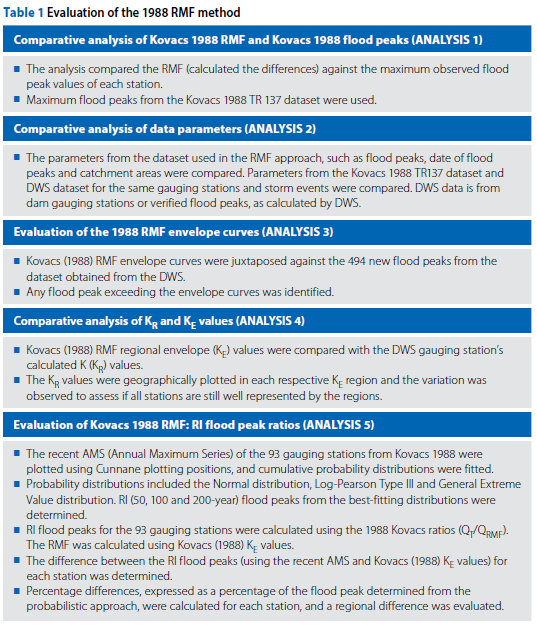
This paper used flood peak data obtained from the DWS of 93 flow-gauging stations still operational from the Kovacs 1988 TR 137 dataset, as well as 494 new flow-gauging stations from the DWS dataset. The methodology used in the review study is summarised in Table 1.
ANALYSIS AND RESULTS
Analysis 1: Comparative analysis of Kovacs 1988 RMF and Kovacs 1988 flood peaks
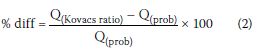
The analysis was performed to compare the RMF and observed flood peak values reported in the Kovacs 1988 TR 137 report and to highlight the differences accepted at the time of the original research. Figure 1 shows the comparison, using Equation 1, of the RMF and the observed flood peaks, for the 93 gauging stations, using only the 1988 data.
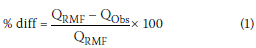
Figure 1 shows that 73 out of 93 (78%) gauging stations had a 50% or greater difference between RMF and the observed flood peak. This means that the regional maximum flood peak is 50% or more greater than the sites' observed maximum flood peak.
Analysis 2: Comparative analysis of data parameters
Kovacs (1988) determined some of his flood peaks (when the capacity of the gauging stations was exceeded) from hand-drawn log-log curves of annual maximum observed flood peaks fitted on a regression line against the gauging station weir flow depth. Kovacs, using the DWS records, discovered that some of those maximum flood peaks did not fall on the regression line, and he then adjusted these peak flow values when the gauging stations' capacity was exceeded (Verwey 2015). This analysis compares such data values, including the date of flood peak and catchment area, between the two datasets (TR137 and DWS).
Figure 2 summarises the differences between Kovacs's 1988 dataset and the DWS dataset. Only those stations that are present in both the Kovacs and DWS datasets are presented.
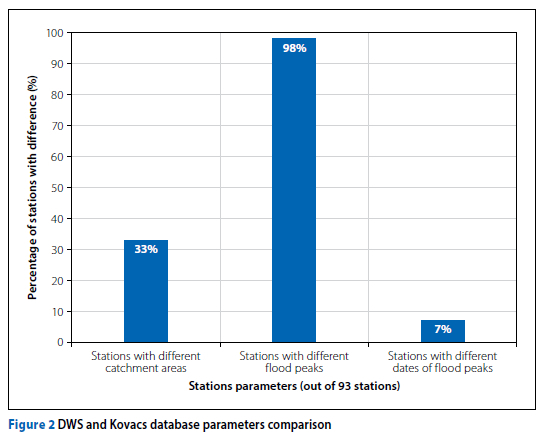
Figure 2 shows that 98% of the gauging stations reflected differences between flood peaks between the two datasets. On average Kovacs flood peaks were 27% (expressed as a percentage of Kovacs flood peaks) larger than the DWS flood peaks. It was observed that 16 stations (17% of the stations) had flood peak differences of less than 10%, 12 stations (13%) had differences in the range of 40% to 60%, and 18 stations (19%) in the range of 80% - 100%. The adjustment made by Kovacs to the observed annual maximum flood peaks to fit a regression line is sensitive to small changes, and it resulted in a consistent trend in which Kovacs-adjusted values were frequently higher than those in the DWS dataset. The comparison revealed that in 33% of the gauging stations a difference in catchment area between the two datasets was observed.
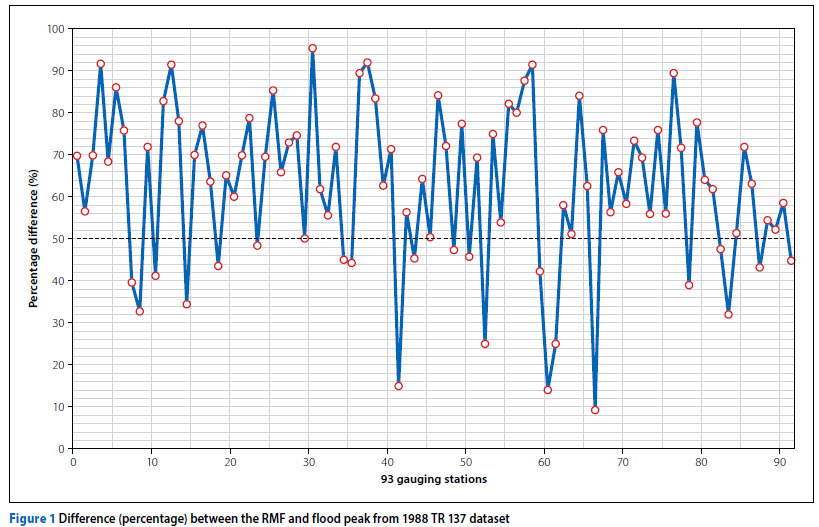
Analysis 3: Evaluation of the 1988 RMF envelope curves
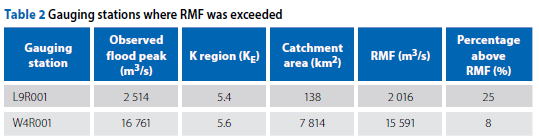
Görgens et al (2006) reported that post-1988 flood peaks may have exceeded Kovacs (1988) RMF envelope curves. To verify this, recent flood peaks (from dam and river stations) were plotted against Kovacs (1988) RMF envelope curves for each KE region. The dam station data presents calibrated dam inflow data, which includes the maximum flood peaks for South Africa's major dams. The river station data reflects the data collected at river gauges as reported by DWS. Figure 3 presents the results.
From Figure 3, as summarised in Table 2, it is clear that flood events in regions 5.4 and 5.6 exceeded Kovacs's (1988) RMF envelope curves. It is also evident that some observed flood peaks plotted very close to or on the envelope curve.
Analysis 4: Comparative analysis of KR and KE values
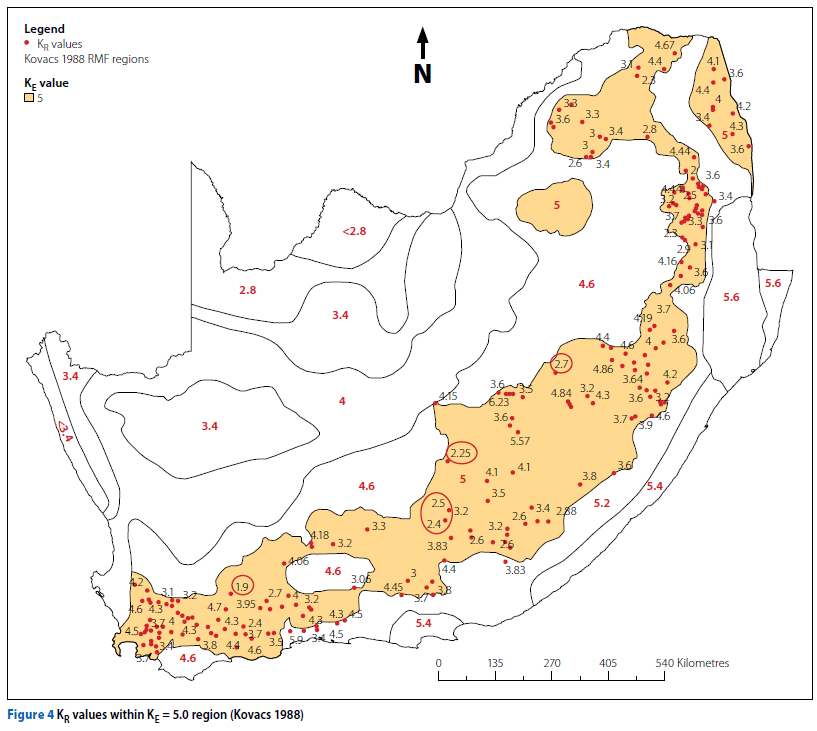
This analysis used the Kovacs 1988 TR 137 regions to evaluate the variation between Kr (station calculated K value, using the DWS dataset) and KE (regional envelope K value). Kovacs's Kr values for each station were used and regionalised to reflect a KM value (regional maximum Kr value). A safety factor of AK was then added to the highest KM to obtain KE values. Figure 4 shows Kr values within region KE = 5.0.
The presence of low KR values (1.9, 2.25, 2.4, 2.5 and 2.7), circled within KE region 5.0, suggests that its boundaries could be revised to include intermediate regions with KE values less than 5.0. Similar trends were observed in Ke regions 3.4 to 5.6. This implies that smaller, more localised regions with KE values close to gauging station KR values could be defined.
Analysis 5: Analysis of the 1988 Kovacs QT/QRMF ratios
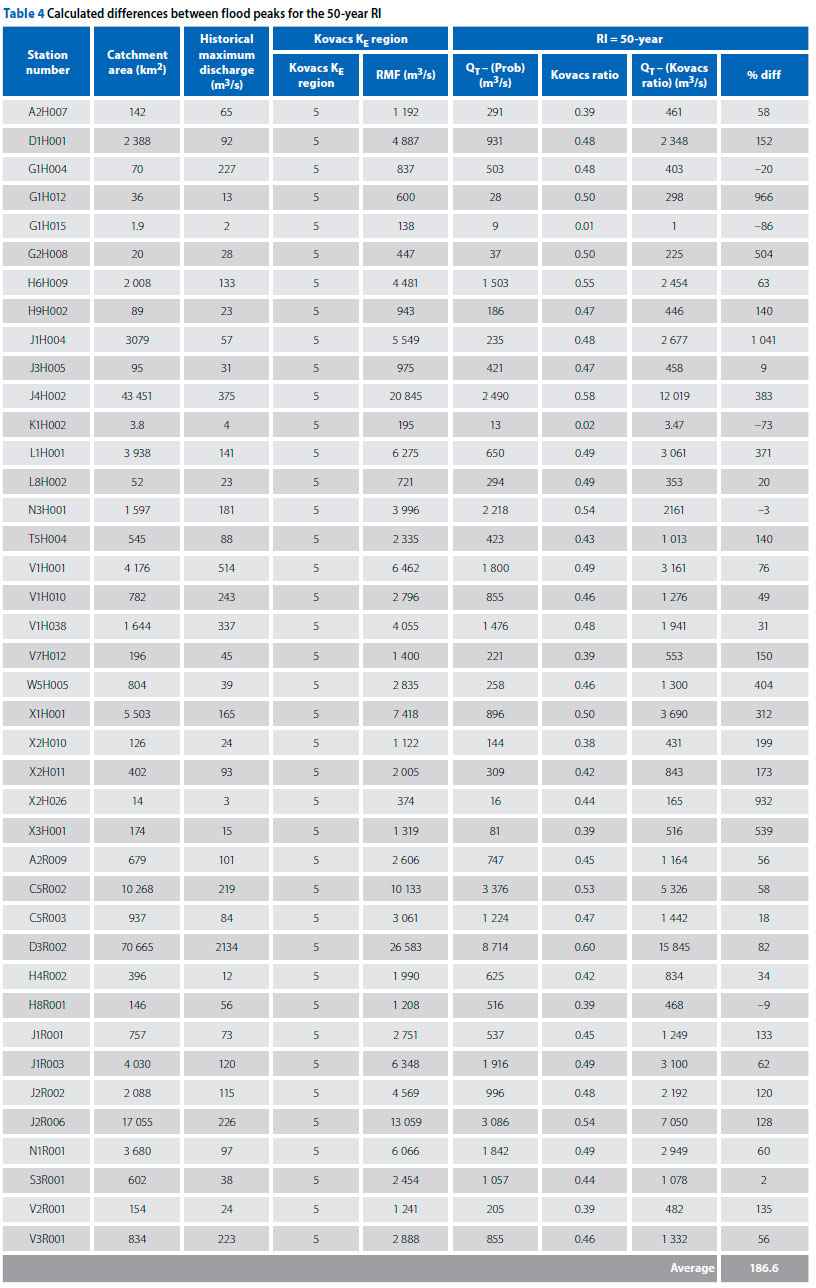
Kovacs (1988) provided ratios (Qt/Qrmf) that can be used to calculate RI flood peaks (Qt) (greater or equal to 1:50-year) using the RMF. According to Van der Spuy and Rademeyer (2010), the ratios estimate exceedance probability flood peaks which are too high. Parak (2007) also stated that the ratios may need to be scaled down. To examine these research findings, flood peak estimates from the updated DWS dataset using probabilistic approaches were compared to those calculated using Kovacs ratios, for various RIs (1:50, 1:100 and 1:200). The differences between these flood peaks are expressed as a percentage difference (% diff) of the probabilistic flood peak. Table 3 provides an explanation of the different variables used in the analysis.
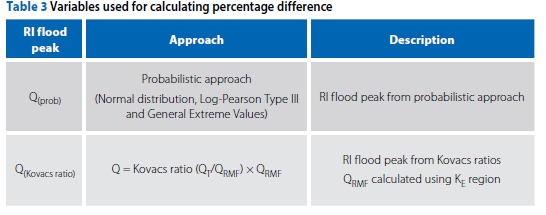
The Q(prob) and Q(Kovacs ratios) RI flood peaks were determined, and the percentage differences were calculated using Equation 2.
The percentage difference was calculated to evaluate the magnitude at which the ratios underestimated or overestimated the Q(prob) RI flood peaks. Table 4 shows the 50-year RI flood peaks and their percentage differences for gauging stations in region KE = 5.0.
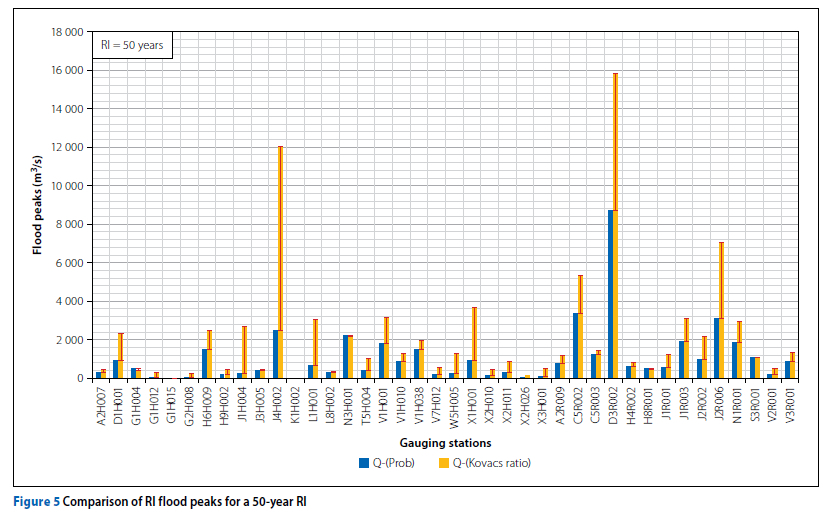
Figure 5 shows the percentage difference calculated at each station. The bars are shown relative to the Q(prob) RI flood peak.
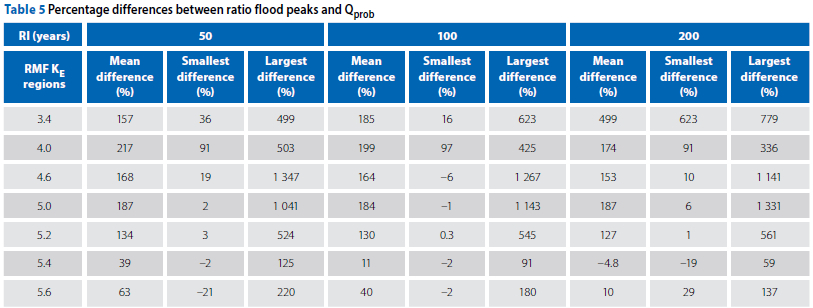
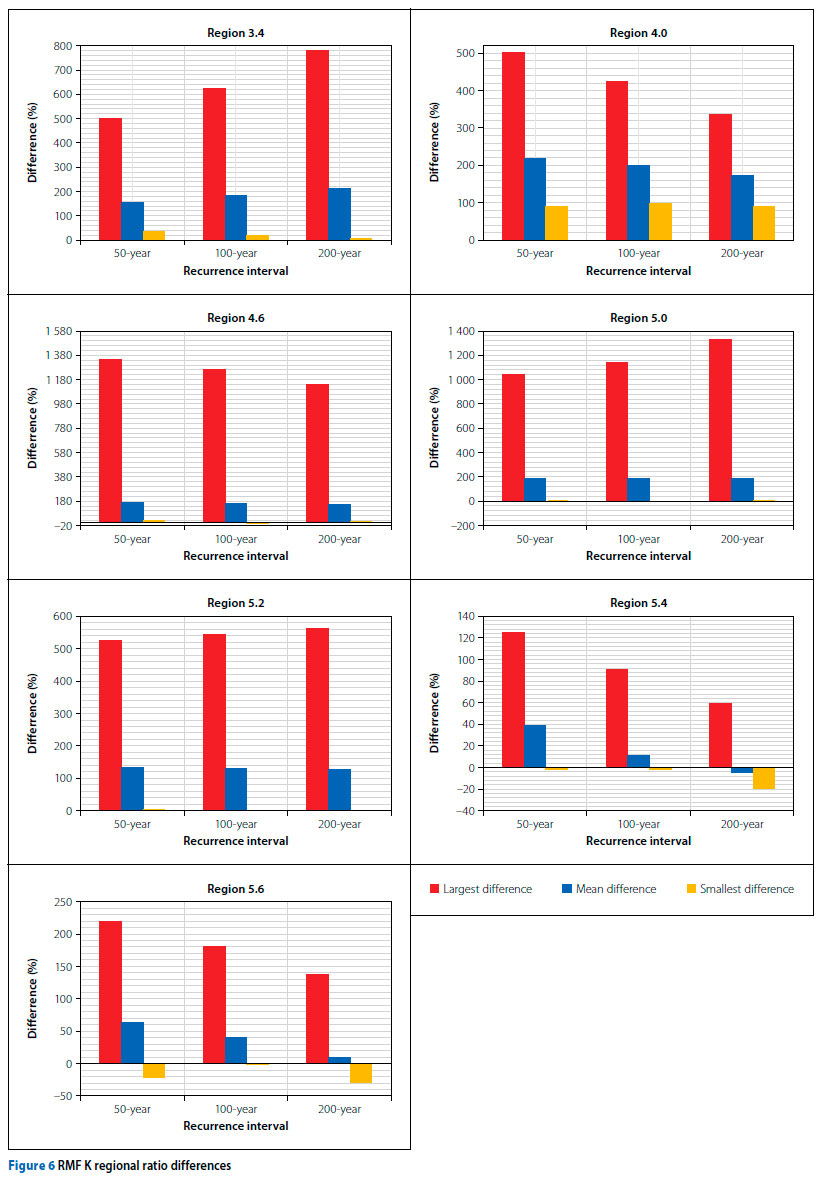
Data as presented in Table 4 was used to calculate the mean, smallest and largest difference percentages (assuming the probabilistic peak to be the correct peak) for I<e regions 3.4 to 5.6, and for RI 1:50- to 1:200-year. The results are presented in Table 5.
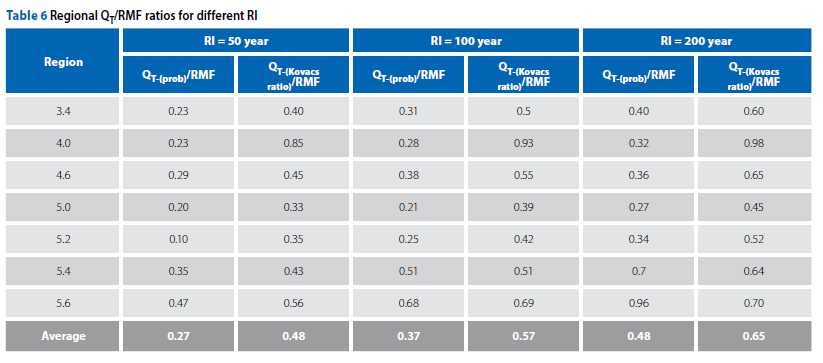
Figure 6 shows a graphical summary of percentage differences for each region. According to Kovacs (1988), the average QT (Kovacs ratio)/RMF (ratio) for the 1:50, 1:100 and 1:200 year is 0.50, 0.575 and 0.65 (Kovacs 1988), respectively. In this evaluation the average QT-(Kovacs ratio)/RMF and the QT-(prob)/RMF were determined as presented in Table 6.
DISCUSSION
From Analysis 1 it was clear that for 78% of the evaluated gauging stations in the Kovacs (1988) RMF approach, the RMF was 50% or more above the maximum observed flood peak, resulting in conservative RMF estimates.
Analysis 2 indicated the discrepancies between the DWS and Kovacs (1988) TR137 datasets. It was observed that 98% of gauging stations had different observed/ reported flood peaks for the same storm events. The average difference was 27%, with most of the Kovacs flood peaks exceeding those from the DWS dataset. While the analysis assumed that the published DWS dataset is correct and the best available data, some differences in the dataset cannot be excluded. It is, however, known that some of the flood peaks (probably those exceeding the flow-gauge capacity) used by Kovacs have been subjected to modification to enable the flood peak to fall on a regression line. A total of 33% of the gauging stations reflected different catchment areas between the two datasets, implying that these stations' RMF values, used by the DWS, are different from those used by Kovacs. The inconsistency was possibly due to the Kovacs computational and measurements methods available at the time.
Analysis 3 indicated that at two dam sites, the Kovacs (1988) RMF envelope curves were exceeded, and in some other cases the observed flood peaks were close to the 1988 RMFs.
The KE regional boundaries might need to be adjusted to accommodate the observed larger flood peaks that exceeded the envelope curves.
Analysis 4 highlighted that many flood peaks also plotted significantly below the envelope curves.
Analysis 5 investigated the validity of the ratios suggested by Kovacs to convert RMF values to RI flood peaks. RI flood peaks calculated using the Kovacs ratios were greater than the RI flood peaks using a probabilistic approach, with significant differences, as presented in Table 5. It was found that Kovacs ratios produce too conservative RI flood peak estimates. Results presented on the review of the Kovacs Qt/Qrmf ratios indicate that these ratios are typically on average 0.20 more conservative for all RIs.
CONCLUSIONS
The uncertainties resulting from this research confirm the findings of various previous researchers, and indicate clearly that an update of the 1988 RMF approach is justified. It was clear from this research that the existing RMF ratios estimate too high RI flood peaks (ratios need to be reduced with 0.2 on average for all RIs). Therefore it is proposed that, until an update of the RMF approach provides different results, alternative methods should be used to estimate RI flood peaks.
In two regions (5.4 and 5.6) the existing envelope curves were already exceeded, and it can be concluded that these regions need to be re-assessed. Further inconsistencies indicated that more intermediate KE RMF regions might be justified. However new intermediate K regions need to be justified based on, among other factors, the inclusion of hydroclimatic and geospatial characteristics. The 1988 RMF database parameter values need updating, and thereafter it is recommended that Kovacs's 1988 RMF method be updated and new RI ratios established.
REFERENCES
Alexander, W J R 1990. Flood Hydrology for Southern Africa. Pretoria: SANCOLD. [ Links ]
Francou, J & Rodier, J A 1967. Essai de classification des crues maximales observées dans le monde. Cahiers de l'ORSTOM, série Hydrologie, 4(3): 19-46. [ Links ]
Görgens, A 2007. Joint Peak-Volume (JPV) design flood hydrographs for South Africa. WRC Report No 1420/3/07. Pretoria: Water Research Commission. [ Links ]
Görgens, A H M 2002. Design flood hydrology Design and rehabilitation of dams. In Basson, G (Ed). Lecture notes from Short Course on Design and Rehabilitation of Dams, Stellenbosch University. pp 460-524. [ Links ]
Görgens A H M, Lyons S, Hayes L, Makhabane, M & Maluleke, D 2006. Modernised South African design flood practice in the context of dam safety. WRC Report K5/1420. Cape Town: Ninham Shand for Water Research Commission. [ Links ]
Kovacs, Z P 1980. Maximum flood peak discharges in South Africa: An empirical approach. Technical Report TR 105. Pretoria: Department of Water Affairs. [ Links ]
Kovacs, Z P 1988. Regional maximum flood peaks in Southern Africa. Technical Report TR 137. Pretoria: Department of Water Affairs. [ Links ]
Nortje, J H 2010. Estimation of extreme flood peaks by selective statistical analyses of relevant flood peak data within similar hydrological regions. Journal of the South African Institution of Civil Engineering, 52(2): 48-57. [ Links ]
Parak, M 2007. Flood estimation for roads, bridges and dams. MSc Eng Dissertation. University of KwaZulu-Natal. [ Links ]
Pegram, G & Parak, M 2004. A review of the regional maximum flood and rational formula using geomorphological information and observed floods. Water SA, 30(3): 377-392. [ Links ]
Pilon, P J, Adamowski, K 1992. The value of regional information to flood frequency analysis using the method of L-moments. Canadian Journal of Civil Engineering, 19(1): 137-147. [ Links ]
SANCOLD (South African National Committee on Large Dams) 1990. Guideline on safety in relation to floods. Safety evaluation of dams report. Pretoria: SANCOLD. [ Links ]
Smithers, J C 2012. Methods for design flood estimation in South Africa. Water SA, 38(4): 633-646. [ Links ]
Van der Spuy, D & Rademeyer, P F 2010. Flood frequency estimation methods as applied in the Department of Water Affairs. Pretoria: Department of Water Affairs. [ Links ]
Verwey, J W 2015. A critical evaluation of the regionalisation of Kovacs Ke values. Master's Dissertation. Stellenbosch University. [ Links ]
Van Vuuren, S J, Van Dijk, M & Coetzee, G L 2013. Status review and requirements of overhauling flood determination methods in South Africa. Report TT563/13. Pretoria: Water Research Commission. [ Links ]
 Correspondence:
J A (kobus) Du Plessis
Department of Civil Engineering, Stellenbosch University
Private Bag X1, Matieland 7600, South Africa
T: +27 83 560 5536; E: jadup@sun.ac.za
Simenda Masule
Department of Civil Engineering, Stellenbosch University
Private Bag X1, Matieland 7600, South Africa
T: +264 81 732 2722; E: simamasule@gmail.com

PROF J A (KOBUS) DU PLESSIS (Pr Eng, FSAICE, FIMESA) has more than 34 years of experience in water engineering, of which the past 21 years were spent in the Civil Engineering Department at Stellenbosch University, where he is responsible for Hydrology and Environmental Engineering. He has a special interest in integrated management of water resources in South Africa as applied by local authorities, as well as flood hydrology. He obtained his PhD (Water Governance), MEng (Water Resource Management) and BEng (Civil) from Stellenbosch University. He presently serves as an Executive Committee member of the Institute of Municipal Engineering of Southern Africa (IMESA), and as a member of the Education and Training Panel of the South African Institution of Civil Engineering (SAICE).

SIMENDA MASULE holds a BSc (Civil Engineering) from the University of Namibia and an MEng (Civil Engineering) from Stellenbosch University. His research so far has focused on the review of a Flood Estimation Method (Regional Maximum Flood (RMF)), which included the update of a historical maximum flood peaks database with the latest flood peak readings and with a re-regionalisation of the RMF according to measurable catchment variables.

