


Services on Demand
Article
 English (pdf)
 Article in xml format
 Article references
Indicators

Related links
-
 Cited by Google
 -
 Similars in Google
Share

 Permalink
Journal of the South African Institution of Civil Engineering
On-line version ISSN 2309-8775
Print version ISSN 1021-2019
J. S. Afr. Inst. Civ. Eng. vol.64 n.4 Midrand Dec. 2022
http://dx.doi.org/10.17159/2309-8775/2022/v64n4a2
TECHNICAL PAPER
Application of a modern laser technique to evaluate the performance of recycled railway ballast
G M Mvelase; J K Anochie-Boateng; P J Gräbe
ABSTRACT
The performance of railway track structure is influenced by the ballast shape properties including roundness, flatness, elongation, sphericity, angularity and surface texture. The challenge is how to accurately measure the irregular shapes of ballast materials and directly link them to performance. In this paper, a modern three-dimensional laser technique was used to determine shapes of freshly produced crushed ballast and recycled ballast sampled from the heavy-haul coal line in South Africa. The objective was to investigate the effect of ballast shapes on settlement (i.e. permanent deformation). All five ballast materials were scanned in the three-dimensional laser scanning system and the data collected was processed to reconstruct three-dimensional models of the ballast particles. The results obtained were used to develop a chart to classify ballast shapes and link these shapes physically with settlement determined from a triaxial testing programme. Based on the triaxial test results, new empirical models were developed to determine settlement on the route corridor of the heavy-haul coal line. It is anticipated that outcomes of this study would assist with quality assessments and railway ballast maintenance in the field.
Keywords: railway ballast, shape characteristics, settlement, modern laser, triaxial
INTRODUCTION
All over the world railway systems play a significant role in hauling bulk commodities to ports, and transporting freight along major corridors. Transnet Freight Rail (TFR) is the agency that manages and operates two heavy-haul lines (i.e. the coal line from Mpumalanga to KwaZulu-Natal Province and the iron ore line from Northern Cape to Western Cape Province) in South Africa. Each year, a large portion of TFR's budget is allocated to maintenance and renewal of track ballast materials to sustain performance of the railway track system. A common problem in the rail industry is the degradation of ballast under cyclic loading, especially on these heavy-haul lines.
A typical track consists of superstructure (rails, fastenings and sleepers) and substructure (ballast, subballast and formation). The function of the ballast is to transfer the load from the superstructure to the substructure. Unlike subbase/base layers in pavement structures, ballast particles tend to break down, powder and deteriorate under repeated wheel loading from heavy freight trains (Moaveni 2015). Performance of the track system depends on the effectiveness of the ballast in providing drainage, stability, flexibility, uniform support to the superstructure and distribution of the track loading to the subgrade, and facilitating maintenance. An increase in axle loads and traffic density increases the rate of settlement of the track. To thus keep settlement within permissible limits, stresses in the subgrade should be reduced suitably to ensure stability of the track (Li et al 2015).
Indraratna et al (2006) indicated that the maintenance cost of track ballast can significantly be reduced if there is a better understanding of the physical and mechanical properties of ballast. Selig and Waters (1994) demonstrated that ballast contributes most of the substructure settlement, even though one of the functions of ballast is to maintain good track geometry. Given that ballast is responsible for nearly all the track settlement, every effort to reduce settlement is focused on the ballast layer.
Ballast is usually composed of blasted rock originating from igneous, meta-morphic or well-cemented sedimentary rock quarries. Crushed angular hard rock having a uniform grading and being free of dust has been considered as acceptable ballast material. The major challenge is that ballast particles have irregular and non-ideal shapes with variable surface textures. Improved techniques for measuring and analysing ballast shapes are, however, available to explore. Hayakawa and Oguchi (2005), and Tolppanen et al (2008) reported that digital modelling of gravel particles based on three-dimensional (3-D) laser scanning could be useful, reliable, repeat-able and relatively fast to evaluate the properties of ballast material. In addition, Moaveni et al (2013) describe an image-processing and analytical technique to better quantify particle shape. Moaveni (2015) modified and applied the Enhanced University of Illinois Aggregate Imaging Analyzer (E-UIAIA) to evaluate railroad ballast field degradation. In the E-UIAIA, aggregates are individually placed on a conveyor belt, with three orthogonally positioned cameras to capture the particle projections. E-UIAIA can distinguish flat and elongated aggregates, and automatically calculates angularity and surface texture, as well as surface area and volume for a wide range of ballast particles. Recent studies in South Africa have strongly recommended the use of modern 3-D laser scanning and numerical modelling techniques to improve measurements of the shapes of aggregates and ballast materials (Mvelase et al 2017; Anochie-Boateng et al 2013; Mvelase et al 2012; Anochie-Boateng et al 2012). The use of laser improves accuracy and reliability of results. An accurate measurement of the shapes is important for the development and revision of specifications for quality control and quality assurance of ballast.
This paper focuses on the effect of shapes determined from a modern 3-D laser scanning system on settlement of railway ballast. The selected ballast materials are being investigated by TFR for their suitability in heavy-haul railroads in South Africa. The effect of ballast shape on settlement performance was further investigated through triaxial testing.
BALLAST SHAPE PROPERTIES
Parameters of ballast particle shape
In order to describe the particle shape in detail, there are a number of terms, quantities and definitions used in the literature. Shape is a first-order property that reflects variations in the overall shape of a particle (Barrett 1980). The physical dimensions, surface area and volume have been used to compute index parameters commonly used to describe the shapes of aggregate and ballast particles (Anochie-Boateng et al 2013). Although there are some differences in their precise definitions, the long, intermediate and short dimensions of a particle are frequently used to summarise its shape.
These three dimensions are sometimes referred to as the L, I and S diameters respectively. L, S and I can be obtained accurately from 3-D scanned models. It is possible to measure these dimensions manually using callipers (Krumbein & Pettijohn 1938; Krumbein 1941), although this is time-consuming, and any set of measurements may be subject to user variation.
Kuo and Freeman (2000) defined two fundamental parameters to describe the shape of a rock aggregate as elongation and flatness ratios. Flatness ratio is defined as the ratio of the particle's shortest to intermediate dimension (Equation 1: Sneed & Folk 1958). Elongation ratio is defined as the ratio of the particle's longest dimension in the plane perpendicular to the intermediate dimension (Equation 2: Sames 1966). The shape factor of an aggregate particle can be related to flatness and elongation characteristics (Equation 3: Aschenbrenner 1956). The sphericity in Equation 4 was described by Aschenbrenner (1956).

Where:
L = longest dimension of a particle
I = intermediate dimension of a particle
S = shortest dimension of a particle
Ψ = sphericity
Furthermore, Zingg (1935) proposed a classification for shapes, and established a terminology that separates flat, cubic, ellipsoid and elongated shapes with a value of 0.67. This chart is a graphical approach to relate particle dimensions. Lines of equal sphericity based on Equation 4 are added to the Zingg diagram.
Sphericity
Lim and McDowell (2005), and Hayakawa and Oguchie (2005) quantified sphericity based on the surface area and volume properties of the aggregate. Sphericity is defined as a function of the ratio of the surface area of the particle to its volume, as shown in Equation 5. Ballast particles have irregular and non-ideal shapes. It is therefore difficult to obtain a direct measurement of the surface area and volume properties using the traditional methods for quantifying the shape properties of aggregates.

Where:
A = surface area
V = volume
Among the shape indices described above, sphericity, flatness, elongation and shape factor were computed directly using the data obtained from a 3-D laser scanning device.
Current standard test to measure ballast shape index
Raymond (1985) reported that most specifications restrict the percentage of flaky particles of which the aspect ratio exceeds 3, and exclude particles with an aspect ratio exceeding 10. Flaky particles cannot be used as ballast given their long and very thin dimensions that can align and form planes of weakness in both vertical and lateral directions. The use of flaky particles appears to increase abrasion and breakage, increase permanent strain accumulation under repeated load, and decrease stiffness (Selig & Waters 1994).
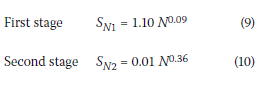
Flakiness index test procedures are contained in Technical Methods for Highways (TMH 1) Method B3 (TMH 1 1986). Under the new South African National Standards (SANS), the method will be replaced by SANS 3001-AG4 (SANS 2015). The test provides an indication of the flatness of ballast particles. The test procedure starts with performing grading analysis on the aggregate sample to be tested. Each ballast particle retained on a specific sieve size is then passed through a corresponding rectangular slot of a flakiness gauge. The particles passing the slots are regarded as flaky, whereas particles that do not pass are considered non-flaky. Flakiness index (%) is calculated by dividing the mass of ballast particles passing the slots by the total mass of the sample.
In the TFR specification, flakiness index is defined as the ratio of the total mass passing bar sieve slots to the total mass of aggregate retained on three specific sieve sizes. Figure 1 shows a photograph of the flakiness gauge apparatus.
Mathematically, the flakiness index (FI) of a ballast material can be represented by Equation 6 as follows:

Where:
Mp = total mass of aggregate passing a bar sieve slots
MT = total mass of aggregate retained on a specific sieve size (grading analysis)
EXPERIMENTAL PROGRAMME AND TESTING
Material sourcing
Four recycled ballast samples from the heavy-haul coal line in South Africa were selected for this study. A fresh ballast sample from a quarry was included to act as reference material. Recycled ballast is referred to as reclaimed material that is re-used in the track structure during rehabilitation. The parent rock of recycled ballast remains mostly the same as that of fresh, crushed ballast. Because dolerite is the most commonly used ballast type on the heavy-haul line, preliminary testing for the reproducibility of tests was conducted using a dolerite obtained from a quarry in South Africa. The same dolerite was used in the main testing programme. The four recycled ballast samples were selected from the coal line section where repetitive ballast tamping and track geometry deformation (known as cant loss on curves) were noted by line maintenance managers of TFR. The site was chosen in consultation with the Maintenance Depot experts and was based on the goals of the research.
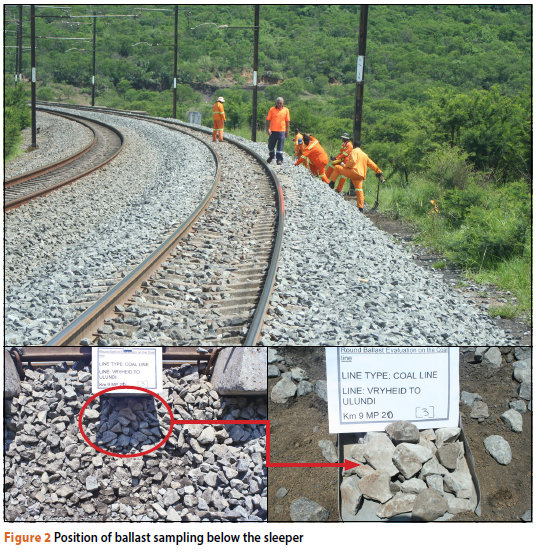
None of these selected curves were situated just before a signal, and no other rail surface defects such as locomotive wheel skid marks or ballast white spots were noted. Samples were taken below the sleeper with special focus on collecting rounded particles for the laboratory analyses on the sites provided by the maintenance depot as indicated in Figure 2. The visual examination indicated that about 90% of recycled ballast comprised semi-angular crushed rock fragments, while the remaining 10% consisted of semi-rounded river gravels. These materials were chosen so that a comparison of their physical characteristics could be made.
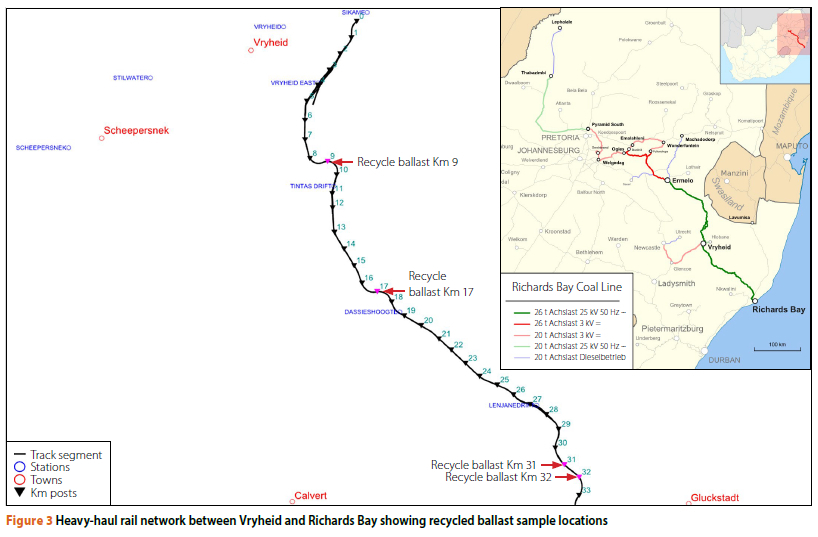
The coal line is electrified to 25 kV AC and supports 26 t/axle loading. The test section forms the southern part of the coal line, carrying mainly heavy-haul traffic with some general freight. Figure 3 shows the recycled ballast sample locations on the heavy-haul coal line between Vryheid and Richards Bay, as investigated in this paper. The recycled ballast was subjected to a traffic load of 2 738 million gross tons (MGT). This is the total tonnage carried from the inception of the line in 1976, calculated based on 76 million tonnes handled by the Richards Bay Coal Terminal annually (Kuys 2011).
Properties of the fresh ballast
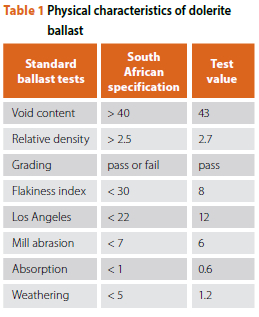
For the purpose of this study, physical property tests were performed on the fresh ballast, and the results were compared to the TFR ballast specification (TFR 2011). These tests were conducted in the geotechnical engineering laboratory of the TFR Track Testing Centre to determine whether the materials were suitable for use as railway ballast. Table 1 summarises the results of eight physical properties of the fresh ballast. These tests provide basic guidelines for acceptance of a given material as potential railway ballast. In general, ballast that satisfies the Los Angeles Abrasion Test is subjected to further tests to evaluate shape, surface characteristics, grading and unit mass. Based on the results presented in Table 1, it can be concluded that the tested sample was suitable for use as ballast in heavy-haul lines.
Selection of ballast particles for laser scanning
To establish whether the scanning technique would lead to a reasonable prediction of ballast characteristics, a quartering sampling approach was used to select particles for scanning. Prior to quartering, grading analyses were conducted on the samples to determine particle distribution according to the TFR specifications. These samples were then quartered to obtain the number of particles that were suitable for the shape characterisation. The samples were dry-sieved using a 465 mm diameter sieve set of 63, 53, 37.5, 26.5, 19, 13.2 and 9.5 mm. The reduced samples were also washed and oven-dried for scanning purposes. Figure 4 shows the grading results fitted to the TFR specifications.
Scanning of ballast particles
The 3-D laser devices at the Council for Scientific and Industrial Research (CSIR) and TFR have been calibrated to determine shape and surface properties of different types of aggregate recycled ballast (Anochie-Boateng 2014). All the ballast particles used for this study were scanned in accordance with the CSIR Guideline for Scanning of Aggregates and Ballast Particles (Anochie-Boateng 2014). The scanning system uses multiple scans to produce high reliability and complete 3-D representation of the particle being scanned. Generally, in-between scans, the ballast particle is oriented along a different axis to ensure that point clouds are obtained from as many different directions as possible; this ensures that data is obtained from all sides of the particle. After multiple scans are obtained, the individual scans are brought into a common reference system through a process that is usually referred to as alignment or registration. After the scans are registered, they are subsequently merged to create a complete 3-D ballast model of the ballast particle. The total number of 320 particles, with their corresponding sieve sizes, are presented in Table 2.
Figure 5 shows a schematic representation of the process used for the scanning of the 3-D ballast models. Figure 6 shows photographs of actual crushed ballast and models of the scanned ballast. From these images it is clear that the laser-scanning technique is capable of producing models that are similar to the actual particle. It is therefore reliable to analyse the ballast particles to obtain an indication of their shape properties.

Discussion of flatness and elongation results
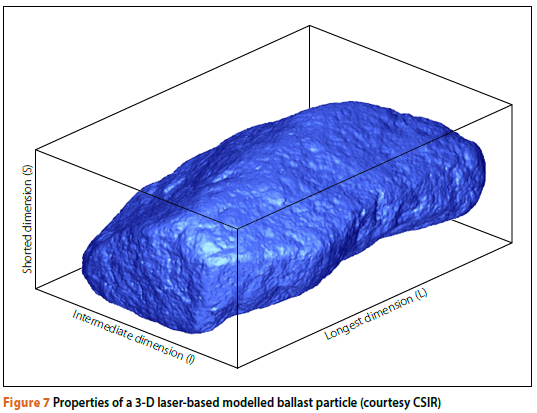
As presented earlier in Table 2, scanned particles involved about 320 particles between 9.5 mm and 63 mm sieve sizes. This data was used in the development of a classification system. Dimensions (longest, intermediate and shortest) of the individual ballast particles were obtained directly from the three-dimensional bounding box shown in Figure 7.
The following steps were followed to compute flatness and elongation ratios from the scanned results:
■ The flatness ratio of an individual ballast particle was computed by dividing the shortest dimension by the intermediate dimension (Equation 1).
■ The elongation ratio of an individual ballast particle was computed by dividing the longest dimension in the plane perpendicular to the intermediate dimension (Equation 2).
■ Furthermore, Zingg (1935) proposed a classification for shapes, and established a quadrant that separates the terms with a value of 0.67 to each other.
■ The shape factor is computed by the ratio of flatness and elongation in Equation 3.
■ The sphericity using elongation and flatness is shown in Equation 4.
Discussion of shape classification results
The classification methodology is based on measuring the shape characteristics of recycled ballast from four different positions and one freshly crushed ballast sample using a 3-D laser scanner. Scanned particles were visually classified as four shapes (cubic, flaky, elongated or flat and elongated). The chart shown in Figure 8 was used to distinguish these shapes. The sphericity value gives a very good indication on the proportions of particle dimensions. However, one cannot determine whether the sample has flat, elongated or flat and elongated particles using sphericity alone.

When all scanned particles from the four shapes were combined, grouped samples had the highest occurrence of flaky particles, namely 122 in number, followed by the cubic particles (98), elongated (57) and flat and elongated (43), as shown in Figure 8. The shaded area in the chart represents ballast shape with a limit of SF ranging between 0.67 and 1.5 and sphericity between 0.8 and 0.9. Therefore, the recommended average shape should be scattered within the shaded area. Any particle scattered below the shaded area is too flaky or flat and elongated, while any particle scattered above the shaded area is too spherical.
Several rock types may fracture to flat and/or elongated to cubic particles when crushed. It is easy to determine the main shape of the particles as cubic, flaky, elongated and flat and elongated. A desirable ballast particle should have as many sides as possible (i.e. cubic). This will ensure that different ballast particles can interlock and remain in that stable position. Flaky particles, on the other hand, have large surfaces which reduce the void spaces and can break under load.
One can more easily evaluate the shapes of particles by plotting the ratios of dimensions, elongation ratio and flatness ratio. These do not present the size of the particles but purely the shape relationship of each individual particle. Figure 9 shows the total percentage of particles that fall into the four different quadrants, namely cubic, flaky, elongated or flat and elongated particles, at the sampling points. The sample with the highest percentage of cubic particles was the recycled ballast Km 31, followed by the recycled ballast Km 32, recycled ballast Km 17 and recycled ballast Km 9. This differed from the results of freshly crushed ballast where most of the ballast particles were found to be slightly flat and elongated, possibly due to the different techniques that the quarry uses to crush stone. This could be a reason why cubic particles are mostly preferred over flaky and elongated particles, which tend to break under load. Li et al (2015) preferred cubic particles for stable and strong ballast, whereas elongated, flaky, smooth shapes should be avoided.

Flat and elongated particles
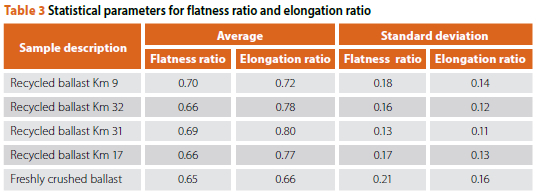
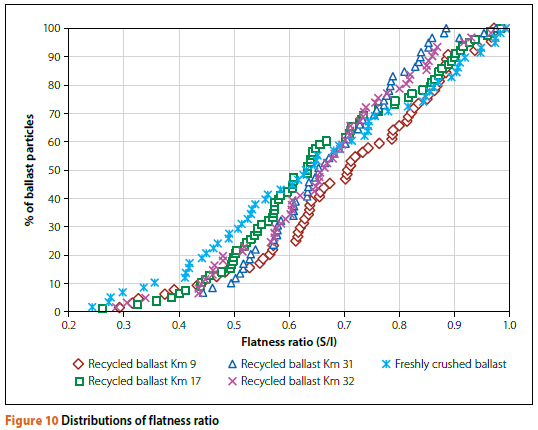
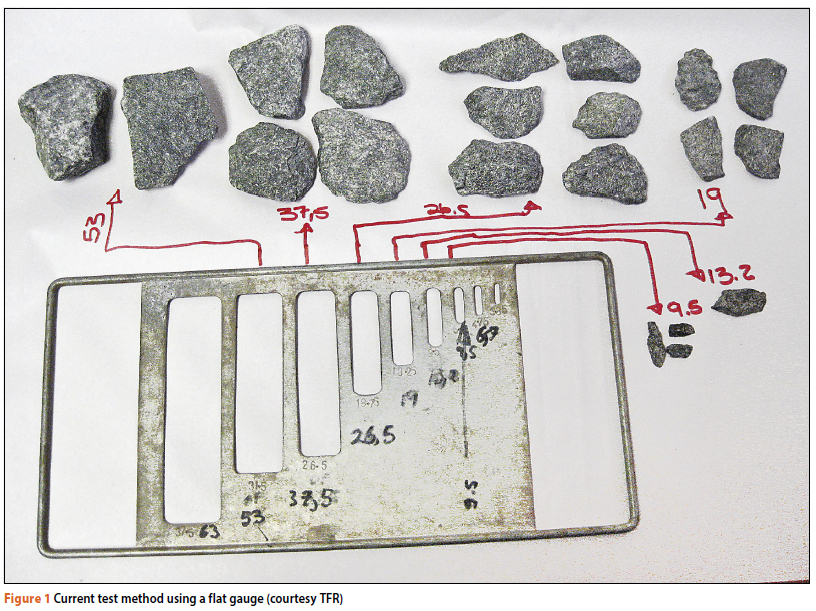
The longest, intermediate and shortest dimensions of the ballast particles were used to compute the flat and elongation ratio using Equations 1 and 2. This means that the recycled ballast samples were expected to have higher flatness ratio values, greater than 0.66, compared to freshly crushed ballast. For equal dimensional ballast particles, the flat and elongation ratio approaches a minimum value of 1. The flat and elongation ratio statistical analysis for the five types of ballast studied are presented in Table 3. The average flatness ratio of recycled ballast Km 9 was the highest, followed by recycled ballast Km 32. The average flatness ratio of freshly crushed ballast was the lowest, followed by recycled ballast Km 17, Km 31 and Km 32. It can be seen that the flatness ratios of all four recycled ballast samples were comparable to the fresh ballast, although a little bit more. However, elongation ratios of the four recycled materials were higher than the fresh ballast. This implies that broken particles become more elongated, which could affect the performance of the ballast layer. The distributions of the flatness ratio and elongation ratio of all the studied ballast samples are plotted in Figures 10 and 11, respectively. The results indicate that the particles were slightly elongated and moderately flat.

Sphericity results
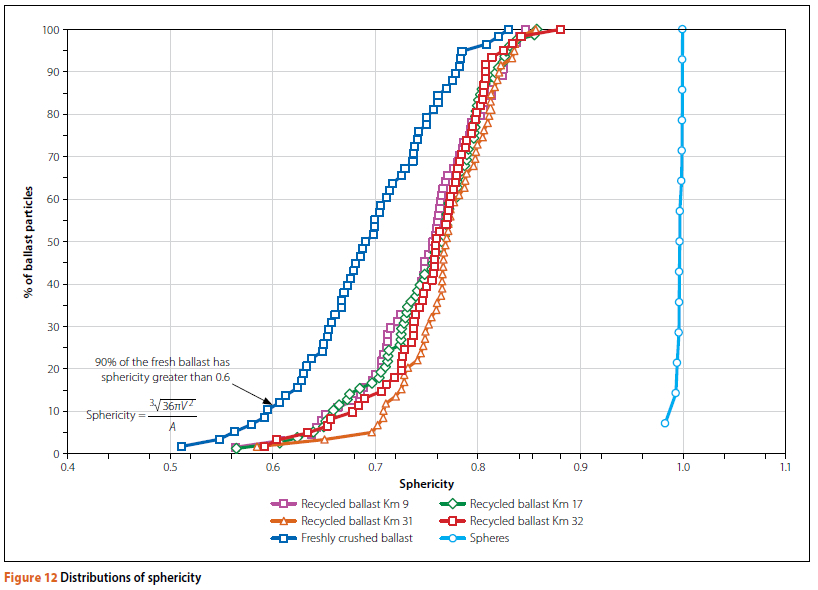
The surface area and volume of individual stone particles were used to compute the sphericity of the ballast materials using Equation 5. The sphericity approaches a maximum value of one (1) for round
shaped aggregate particles. Figure 12 shows the distributions of the sphericity computed using surface area and volume. The sphericity distributions are plotted for the 320 particles scanned. Included in the figure are sphericity values of 14 spherical objects. These spheres had different sizes and were manufactured using different types of material (steel, ceramic, rubber and plastic). All the spherical objects plotted closer to a value of one (1). Recycled ballast Km 32 had relatively higher sphericity values, followed by recycled ballast Km 31, recycled ballast Km 9 and recycled ballast Km 17.
It was also observed that the distribution of sphericity values for different samples may differ significantly, despite their average values being closer to each other. Therefore, a single property such as flakiness index cannot accurately differentiate shape properties of the ballast samples. The use of the laser scanning technique provided more information required to distinguish the shapes of the different samples used in this study. The plots of sphericity, elongation ratio and flatness ratio presented in Figures 10, 11 and 12 indicate that the recycled ballast differs from freshly crushed ballast in terms of its shape.
Correlation of flakiness index with ballast shape indices
The flakiness index values were correlated with the average sphericity and flatness ratio (see Figure 13). A reasonably good correlation was found between the sphericity and flakiness index (R2 = 0.604). However, a poor correlation was found between flakiness ratio and flakiness index (R2 = 0.360). The recycled ballast samples at Km 31 and KM 9 showed a higher flatness ratio with a lower flakiness index and hence appear to contribute to the poor correlation.
TRIAXIAL TESTING PROGRAMME
A proper evaluation of the behaviour of railway ballast requires that the specimens must be prepared to the particle size representative of the field conditions (Tutumler et al 2011). Repeated load triaxial testing was conducted in accordance with the TFR in-house triaxial testing protocol developed for granular material (Arangie 1995). The specimen dimensions, i.e. a height (H) of 385 mm and a diameter (D) of 210 mm, corresponding to an acceptable H/D ratio of 1.85, were used for the triaxial tests. A 210 mm diameter and 380 mm tall triaxial specimen yields a volume of 0.013 m3. The chamber was pressurised, carefully avoiding applying the full confined pressure before removal of the vacuum. The vacuum pipe was ventilated to prevent any back-pressure.
In this study, a deviator stress of 101 kPa and a confining pressure of 90 kPa were applied to the ballast samples to determine settlement. The cell pressure of 90 kPa is representative of field conditions on the coal line in KwaZulu-Natal. The axial loading values were obtained based on Geotrack software (Arangie 1995) to represent axle loads of 26 ton (~ 94 kPa) and 34 ton (~121 kPa) for the current and the predicted axle load due to an increasing coal export market (Arangie 1995). The 30-ton (~107 kPa) loading represents the locomotive axle load.
Repeated load triaxial testing was performed on the five ballast samples. This test closely resembles the load environment and failure mechanisms of ballast in track. All tests were conducted at the CSIR pavement materials testing laboratory. During testing, a repeated haversine load of 0.1 seconds followed by a 0.9-second rest period is applied to the ballast sample.
For the first stage, the samples were loaded at 90 kPa confining pressure and 100 kPa axial loading with 0.1-second load duration followed by a 0.9-second rest period. This was immediately followed by increasing the repeated axial stress level to 140 kPa under the same confining stress condition of 90 kPa for an additional 50 000 load application. The samples were loaded at 90 kPa confining pressure and 100 kPa, then at 140 kPa axial loading.
DISCUSSION OF TRIAXIAL TEST RESULTS
First-stage settlement
Figure 14 shows that the highest settlement was found in recycled ballast Km 32, followed by recycled ballast Km 17, recycled ballast Km 9, recycled ballast Km 31 and finally the freshly crushed ballast. A number of mathematical functions have been proposed to predict the settlement behaviour of ballast (Selig & Waters 1994; Indrarantna et al 2006). Considering the trends of permanent strains with respect to the number of load cycles in the triaxial simulation of ballast materials in the laboratory, these researchers found that semi-log and power functions better describe the behaviour of ballast material. The researchers also found the power function as presented in Equation 7 to be more accurate than the semi-logarithmic function regarding modelling the behaviour ballast settlement.

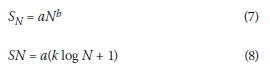
Where:
Sn = settlement of ballast
N = load cycles
a = settlement at first cycle
b & k = empirical constant
In this study a power function of settlement and number of load repetitions was used to analyse the triaxial test results.
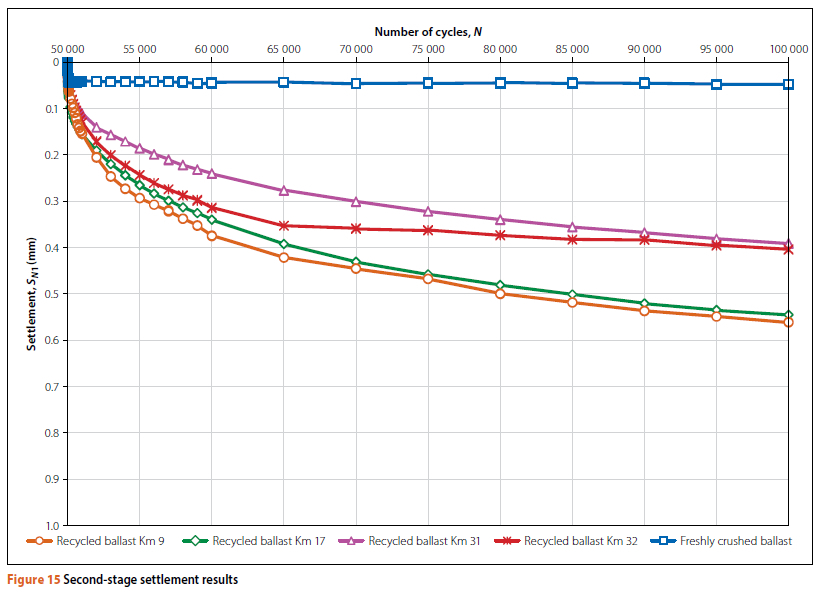
Second-stage settlement
As expected, a significant amount of settlement occurred in the first stage of testing, due to the ballast particles being free to settle and undergo reorientation during the first-stage loading. Figure 15 shows that the highest settlement was found in recycled ballast Km 9, followed by recycled ballast Km 17, recycled ballast Km 32, recycled ballast Km 31 and freshly crushed ballast.
Table 4 presents total settlement of the tested samples computed using Equation 7. The power function R2 was used to assess the accuracy of the model in estimating the settlement of recycled ballast during triaxial testing. The sample with the highest settlement was recycled ballast Km 32, followed by recycled ballast Km 17, recycled ballast Km 9, recycled ballast Km 31 and freshly crushed ballast. From Table 4 it can be observed that the recycled ballast experienced the greatest amount of settlement before the second-stage settlement.
Combined recycled ballast model
A close examination of all four recycled ballast settlement variables suggests that the individual databases could be combined for analysis. A simplified model to combine all data of the recycled ballast was therefore developed to simulate ballast values that had been subjected to repeated loading and had undergone degradation. When ballast has been in service for a significant period of time, it becomes damaged and contaminated, resulting in a change in shape and size, which in turn leads to a reduction in performance. The developed first-stage model is shown in Equation 9 and the second-stage model for recycled ballast is shown in Equation 10.
Recycled Ballast Models
EFFECT OF BALLAST SHAPE ON SETTLEMENT
Flatness ratio and sphericity
The threshold value of sphericity will be 1.0, as indicated by use of spheres in Figure 12. The flatness ratio and sphericity determined from the laser were used to evaluate the effect of ballast shape on settlement. Figure 16 shows a plot of settlement against flatness ratio and sphericity respectively. There was no proper relationship observed. Ballast deteriorates due to many reasons, including breakage of angular corners and sharp edges resulting in finer materials with minimum dimensions, as shown in Figure 4. Once the vertical alignment (track settlement) in the track reaches the allowable limit of ±3.5 mm, maintenance is necessary to return the railway track to its original position, since differential settlement can result in many problems, including derailment (Zaayman 2013).
Flakiness index
Figure 17 shows the effect of the flakiness index with settlement. An overall good correlation was observed, with a good correlation between the flakiness index and the settlement (R2 = 0.904) of the recycled materials. This shows that laser scanning is a versatile technique to determine the shape of railway ballast. The flakiness index increases linearly with increasing settlement, and therefore the performance of the rail track structure can be linked to ballast shape.

FINDINGS AND CONCLUSIONS
A modern 3-D laser scanning technique was used to determine shape properties of railway ballast materials, which were linked to the settlement performance of the materials. The 3-D laser technique was used to directly obtain the flakiness index, flatness ratio, elongation ratio and sphericity of ballast particles. Settlement of the ballast was determined in the laboratory from triaxial testing with conditions derived from railway track field loading conditions. Based on the findings and results discussed in this paper, the following conclusions are drawn:
■ Much-needed improvement in the measurement of the ballast shape has been successfully demonstrated in this study using the 3-D laser-based scanning technique. This implies that a more accurate measurement of the highly irregular shapes of ballast materials can be achieved through automation instead of the traditional methods that are susceptible to error.
■ The findings presented in this study showed that railway ballast shapes can be adequately captured by a modern 3-D laser scanning system. Furthermore, these shapes can be linked with settlement results from triaxial testing to mimic field loading of the ballast materials.
■ The desired particle shape should be distributed within the shaded area of the shape classification chart. Flaky or elongated particles have a specific dimension that is significantly greater than other dimensions and tend to produce preferential planes of weakness when present in large proportions and clustered together in the material.
■ The results of cyclic loading of the tested materials confirmed that settlement of good quality freshly crushed ballast was low when compared with recycled ballast material under the same field loading conditions.
■ The power mathematical function betters the model settlement behaviour of recycled (degraded) ballast materials. This validates the existing classical power function that is commonly used to model permanent deformation (set tlement) of the behaviour of ballast materials.
ACKNOWLEDGEMENTS
This project was funded by the Council for Scientific and Industrial Research (CSIR) and Transnet Freight Rail. The project was done at the CSIR towards a postgraduate Master's degree from the University of Pretoria.
REFERENCES
Anochie-Boateng, J K, Komba, J J & Tutumluer, E 2012. Aggregate surface areas quantified through laser measurements for South African asphalt mixtures. Transportation Engineering, 138(8): 1-11. [ Links ]
Anochie-Boateng, J K, Komba, J J & Mvelase, G M 2013. Three-dimensional laser scanning technique to quantify aggregate and ballast shape properties. Journal of Construction and Building Materials, 43: 389-398. [ Links ]
Anochie-Boateng, J K 2014. Test protocol for determining particle shape and surface properties of aggregate and ballast using laser scanning technique. CSIR Technical Manual CSIR/BE/IE/ IR/2014/0038/C. Pretoria: CSIR Built Environment. [ Links ]
Arangie, P B D 1995. The influence of ballast fouling on the functional behaviour of the ballast pavement layer. MEng Dissertation. University of Pretoria. [ Links ]
Asschenbrener, B C 1956. A new method of expressing particle sphericity. Journal of Sedimentary Petrology, 26: 15-31. [ Links ]
Barrett, P J 1980. The shape of rock particles: A critical review. Sedimentology, 27: 291-303. [ Links ]
Hayakawa, Y & Oguchi, T 2005. Evaluation of gravel sphericity and roundness based on surface area measurement with a laser scanner. Journal of Geology, 31(6): 735-741. [ Links ]
Indraratna, B, Shahin, M A & Rujikiatkamjorn, C 2006. Stabilization of rail tracks and underlying soft soil formations. Australia: University of Wollongong. [ Links ]
Krumbein, W C & Pettijohn, F J 1938. Manual of Sedimentary Petrography. New York: Appleton Century, Inc. [ Links ]
Krumbein, W C 1941. Measurement and geological significance of shape and roundness of sedimentary particles. Sedimentary Petrology, 11: 64. [ Links ]
Kuo, C Y & Freeman, R B 2000. Imaging indices for quantification of shape, angularity and surface texture of aggregates. Proceedings, Transportation Research Board 79th Annual Meeting, Washington DC, Paper No: 000686. [ Links ]
Kuys, W 2011. Heavy haul operations in South Africa. Proceedings, 2011 International Heavy Haul Association Conference, 19-22 June 2011, Calgary, Canada. [ Links ]
Li, D, Hyslip, J, Sussmann, T & Chrismer, S 2015. Railway Geotechnics. New York: Taylor and Francis. [ Links ]
Lim, W L & McDowell, G R 2005. Discrete element modelling of railway ballast. Granular Matter, 7(1): 19-29. [ Links ]
Moaveni, M 2015. Advanced image analysis and techniques for degradation characterization of aggregates. PhD Thesis. University of Illinois at Urbana-Champaign. [ Links ]
Moaveni, M, Wang, S, Hart, J M & Ahuja, N 2013. Aggregate size and shape evaluation using segmentation techniques and aggregate image processing algorithms. Transportation Research Record 2335, Paper No. 13-4167: 50-59. [ Links ]
Mvelase, G M, Anochie-Boateng, J K & Grabe, P J 2012. Application of laser-based technology to quantify shape properties of railway ballast. Proceedings, 31st Southern African Transportation Conference, 9-12 July 2012, Pretoria. [ Links ]
Mvelase, G M, Grabe, P J & Anochie-Boateng, J 2017. The use of laser technology to investigate the effect of railway ballast roundness on shear strength. Transportation Geotechnics, 11: 97-106. [ Links ]
Raymond, G P 1985. Research on railroad ballast specification and evaluation. Transportation Research Record 1006: 1-8. [ Links ]
Sames, C W 1966. Morphometric data of some recent pebble associations and their sedimentary petrology. Journal of Sedimentary Research, 26: 15-31. [ Links ]
SANS (South African National Standard) 2015. SANS 3001-AG4 Civil engineering test methods. Part AG4: Determination of the flakiness index. Pretoria: SABS Standards Division. [ Links ]
Selig, E T & Waters, J M 1994. Track Geotechnology and Substructure Management, 1st ed. London: Thomas Telford. [ Links ]
Sneed, E D & Folk, R L 1958. Pebbles in the lower Colorado River, Texas: A study in particle morphogenesis. Journal of Geology, 66(2): 114-150. [ Links ]
TMH 1 (Technical Methods for Highways 1) 1986. Standard Methods of Testing Road Construction Materials. Pretoria: CSIR National Institute for Transport and Road Research. [ Links ]
Tolppanen, P, Illerstrom, A & Stephansson, O 2008. 3D Laser analysis of size, shape and roughness of railway ballast. Research in Progress. Sweden: Royal Institute of Technology. [ Links ]
TFR (Transnet Freight Rail) 2011. Specification for the supply of stone. Transnet Freight Rail Technical Document S406. Johannesburg: Transnet. [ Links ]
Tutumluer, E, Qian, Y, Hashash, Y M A, Ghaboussi, J & Davis, D 2011. Field validation discrete model for railroad ballast. Proceedings, AREMA Annual Conference, 18-21 September 2011, Minneapolis, MN. [ Links ]
Zaayman, L 2013. Mechanisation of Track Work in Developing Countries. MTech Dissertation. University of Johannesburg. [ Links ]
Zingg, T 1935. Contribution to the gravel analysis (Beitrag zur Schotteranalyse). Schweizerische Mineralogische und Petrographische Mitteilungen, 15: 38-140. DOI: doi.org/10.3929/ethz-a-000103455. [ Links ]
 Correspondence:
Gculisile Mvelase
CSIR Smart Mobility
PO Box 395, Pretoria, 0001, South Africa
T: +27 12 841 4644 | E: gmvelase@csir.co.za
Joseph Anochie-boateng
Department of Civil Engineering University of Pretoria
Private Bag X20, Hatfield, 0028, South Africa
T: +27 12 420 2978 | E: joseph.anochieboateng@up.ac.za
Hannes Grabe
Department of Civil Engineering University of Pretoria
Private Bag X20, Hatfield, 0028, South Africa
T: +27 12 420 4723 | E: hannes.grabe@up.ac.za

GCULISILE MVELASE (AMSAICE) currently works for the Council for Scientific and Industrial Research (CSIR) in South Africa. She has more than 15 years of experience in geotechnical investigation of track substructure and railway building materials. Her research interests cover 3D mapping techniques (GIS, LiDAR, drone and ballast 3D scanning), prediction and performance behaviour of geomaterials, including materials evaluation and testing (i.e. use of non-potable water, fly ash and marginal soils in pavement construction). This article emanated from her MEng research project in the Department of Civil Engineering in the Faculty of Engineering, the Built Environment and Information Technology (EBIT) at the University of Pretoria.

PROF JOSEPH ANOCHIE-BOATENG (Pr Eng, MSAICE) is an associate professor in the Department of Civil Engineering in the Faculty of Engineering, the Built Environment and Information Technology (EBIT) at the University of Pretoria. His research focus areas are asphalt technology, advanced Imaging techniques (I.e. use of 3D laser and high-resolution cameras to characterise the morphology of crushed stones for the building of roads and railways), forensic investigation of failures in flexible pavements, and long-term performance of road pavements. Prof Boateng holds a PhD in Civil Engineering from the University of Illinois at Urbana-Champaign, USA.

PROF HANNES GRABE (Pr Eng, FSAICE, FSAAE) is an associate professor in the Department of Civil Engineering in the Faculty of Engineering, the Built Environment and Information Technology (EBIT) at the University of Pretoria. He holds the Chairs in Railway Engineering and Railway Safety, sponsored by Transnet Freight Rail and the Railway Safety Regulator, respectively. His research focuses on the behaviour of railway foundation materials subjected to cyclic loading and the characterisation oftrack component performance and behaviour through field and laboratory experimentation. He combines his experience in track technology, soil mechanics and advanced laboratory testing for the development of novel condition monitoring techniques, maintenance models and numerical analysis of track structures. He holds a PhD from the University of Southampton (UK) in Geotechnical Engineering.

