


Services on Demand
Article
 English (pdf)
 Article in xml format
 Article references
Indicators

Related links
-
 Cited by Google
 -
 Similars in Google
Share

 Permalink
Journal of the South African Institution of Civil Engineering
On-line version ISSN 2309-8775
Print version ISSN 1021-2019
J. S. Afr. Inst. Civ. Eng. vol.64 n.3 Midrand Sep. 2022
http://dx.doi.org/10.17159/2309-8775/2022/v64n3a5
TECHNICAL PAPER
A pragmatic derivative method to assess the condition of a public health built infrastructure portfolio
P de Jager; K Wall
ABSTRACT
The 2006, 2011 and 2017 Report Cards on the condition of built environment fixed infrastructure in South Africa were the product of cooperation between the Council for Scientific and Industrial Research (CSIR) and the South African Institution of Civil Engineering (SAICE). Their purpose has been to draw the attention of government, and of the public at large, to the importance of maintenance, and to factors underlying the condition of public sector infrastructure. One of the ten public infrastructure sectors assessed in all three report cards was the health sector, comprising hospitals and clinics.
This paper describes how the collection and analysis for the 2017 infrastructure report card of health sector condition data was conducted. In particular, it describes how, in the absence of a comprehensive reasonably up-to-date database, and the way, without their interrogation and integration in mind, in which available datasets had been compiled, the CSIR formulated a pragmatic derivative method to assess the condition of the public health built infrastructure portfolio.
Keywords: public health, report card, SAICE, CSIR, Infrastructure condition
INTRODUCTION
Nature and purpose of the infrastructure report cards
Given that the public immovable asset infrastructure portfolio is both a formidable investment, funded by taxes, and a crucial enabler for socioeconomic success, it is incumbent on the built environment professional community to monitor the condition of this infrastructure and to communicate findings to the citizenry and government. Credible, current indication of the condition of infrastructure can provide a useful basis for government, the professional community and civil society to recognise the need for, and lobby for, resource mobilisation to improve the condition.
The South African Institution of Civil Engineering (SAICE) has long been concerned about what it perceives to be the often-deteriorating condition of this portfolio of infrastructure, with consequences for the delivery of services. Because of this concern, and in its capacity as the largest learned society in the built environment community, SAICE in 2006, with considerable assistance from the Council for Scientific and Industrial Research (CSIR), initiated a multi-sectoral study of the condition of infrastructure owned by the public sector. It published its findings and notional grading per sector in the SAICE Infrastructure Report Card for South Africa: 2006 (SAICE 2006)1, using a format inspired by the precedent established by the American Society of Civil Engineers and the (British) Institution of Civil Engineers. After an interval of five years, a second report card was published (SAICE 2011). Some years later, the process to compile a third condition report card was commenced, and this appeared in 2017 (SAICE 2017).
Each of these multi-sector report cards abstracted from the information in single-sector technical reports prepared by specialists in those sectors - technical reports which had over the years proved to be essential elements in reinforcing the credibility of the overall report card process.
Informational base of the infrastructure report cards
Experts to prepare the sector reports were selected based on the following criteria:
■ Multidisciplinary teams with many years of competence in the infrastructure sectors, not only in research and development, but often also in design, construction and operation.
■ Expertise in policy formulation and the development of technical guidelines.
■ Established track record of independent studies of the operation of or the physical condition of their infrastructure.
■ An established and credible methodology and tools for infrastructure condition assessment.
The quality of the data which SAICE and the CSIR have been able to gather for report card purposes has fluctuated from sector to sector, and also from year to year. Worldwide, electronic means have improved, making it possible to gather more comprehensive infrastructure condition data more frequently, and also to analyse this data. Regrettably, however, not many South African public sector entities have kept pace with these developments. SAICE devoted a section of the 2017 report card, titled Data management and infrastructure monitoring, to voice its concerns in this regard. Inter alia:
"Some South African infrastructure institutions, such as SANRAL (South African National Roads Agency Ltd), ACSA (Airports Company South Africa) and the Gautrain Management Agency have been quick to keep up with these changes, and rank with their good practice peers elsewhere in the world. However, other institutions have been slow to adopt the changes or (a common problem) they collect the data but make little use of it." (SAICE 2017: 18)
Another worrying trend highlighted by SAICE was the abandonment by some institutions of regular condition monitoring, and/or their reluctance to release to the public domain the condition data which they do possess.
"In these institutions, infrastructure condition data seems to be thought of the same way as maintenance - as a secondary concern following infrastructure build." (Ibid)
The CSIR, which had in 2006 and 2011 compiled the technical reports for the public health sector infrastructure, agreed to prepare another for the 2017 report card. It agreed, despite constrained resource allocation which did not permit primary data collection, because it was aware of infrastructure studies being undertaken by the National Department of Health (NDoH) at the time. Also, it (the CSIR) had a number of datasets of its own (De Jager 2017).
In 2017, as in previous years, the data basis for the technical reports for other sectors was predominantly abstracted from records kept by the authorities in a more or less systematic way, and in a standard format which could reasonably readily be analysed.
But what if the good quality data has been gathered in non-standard formats of different types which cannot readily be matched? To overcome this, the boer moes 'n plan maak (the farmer had to make a plan - Afrikaans saying).
When requested, the NDoH kindly released the necessary data to the CSIR, on the strict condition that it be used only for the purposes of the SAICE report card, and that this be done in such a way that anything published reflected aggregated information, i.e. that the condition of individual facilities would not be revealed.
It soon became apparent to the CSIR that the way in which the data had been gathered and then packaged would prove to be challenging. How this was overcome is the main theme of this paper.
The NDoH data was of good quality (including that it had been collected by trained staff using a consistent methodology) and up to date, so going to the trouble of finding a way to unlock its value was definitely worthwhile. Thus, the pragmatic derivative desktop methodology was devised, and is described in this paper.
FACTORS IN ASSESSING CONDITION
Size and complexity
South Africa has approximately 6 000 healthcare facilities, the great majority publicly owned2 and operated (NDoH 2012a). These facilities range in size from one-room clinics to the Chris Hani Baragwanath Hospital, which at more than 200 000 m2 is amongst the largest hospitals in the world (Wild 2016). The variation in classification (associated with variation in complexity, age, context and size) of the building stock complicates the task of assessing condition of infrastructure in a replicable way coherent within institutions and comparable between institutions.
Of the South African 347 public sector hospitals, including specialised units (for malaria, tuberculosis, maternity and psychiatric services, etc), ten are classified as 'central hospitals'. The rest are dispersed around the provinces as follows:
■ 64 in the Eastern Cape
■ 25 in the Free State
■ 33 in Gauteng
■ 72 in KwaZulu-Natal
■ 40 in Limpopo
■ 29 in Mpumalanga
■ 19 in North West
■ 14 in Northern Cape
■ 41 in Western Cape.
The public sector owns some 3 538 clinics, community health centres and community day centres, of which about one third (primarily in the metropolitan areas) are operated by local authorities and the remainder by provincial governments. Two-thirds by number of facilities are non-urban.
Age, lifespan, obsolescence, materials and maintenance
The variations in age, lifespan, obsolescence, materials and maintenance render assessment of the current condition and anticipation of future condition a complex undertaking. Buildings range in age from almost 150 years (Somerset Hospital in Cape Town) to the comparatively recent Nelson Mandela's Children's Hospital in Johannesburg. Oftentimes old, new and partially upgraded building stock co-inhabit a single institutional site.
Several mechanisms determine longevity. For example:
■ The condition of land is generally speaking static and does not degenerate unless polluted or severely mismanaged.
■ Concrete and masonry superstructure is subject to slow physical deterioration with age.
■ Engineering plant has a shorter life cycle than the concrete and masonry superstructure and may need to be replaced three or more times over the design life of the facility as a whole.
■ Equipment (i.e. movable assets) and plant, in addition to physical deterioration, are subject to obsolescence where technical advances may render systems or technologies obsolete through functional advances or accelerated upgrade.
On the latter: the obsolescence of mechanical and electronic equipment is invariably more rapid than the rate of obsolescence of the building structures within which they are housed. With growing sophistication of equipment, especially of equipment dependent on software, this life span is reducing even faster. While the initial capital cost of equipment is on average about one third of the initial cost of a hospital or clinic building, over the full life of the facility, including its periodic replacement, the cumulative cost of all equipment, including medical devices, may exceed that of the building.
The maintenance regime in a building has a major influence on its condition as well as on the service life of its components.
Legislative and policy context
In terms of Section A15 of the National Building Regulations (NBR) and Building Standards Act No 103 of 1977, the owner of a building is responsible for the maintenance of mechanical equipment, facilities and installation services, and it is the owner's responsibility to ensure that the standards of performance prescribed in regulations or in any by-law for such equipment or installation are met. It is also the owner's responsibility to ensure the structural safety performance of the building.
While there are clear guidelines and performance and design standards set out in the Occupational Health and Safety Act (OHS) No 85 of 1993 and the NBR - which provide for the health and safety of those at work and the safe use of plant and machinery - in practice these are not always applied effectively in the health sector.
The Government Immovable Asset Management Act (GIAMA) No 19 of 2007 clarifies the respective roles of health and works departments in relation to the management of immovable assets, and provides a consistent framework for immovable asset acquisition, operation, management and disposal, as follows:
■ Managing an immovable asset through-out its life cycle
■ Assessing the performance of the immovable asset
■ Assessing the condition of the immovable asset at least every fifth year
■ Identifying the effect of the condition of an immovable asset on service delivery ability
■ Determining the maintenance required to conserve or return the immovable asset to the condition in which it would provide the most effective service
■ Estimating the cost of the maintenance needed
■ Establishing and executing a performance measurement system as prescribed.
According to GIAMA, line departments (in this case national and provincial departments of health) are required to draft User Asset Management Plans (UAMPs), incorporating condition assessments for immovable assets. Complementing these, the corresponding custodial departments (departments of public works, usually -again for both national and provincial spheres) are required to draft Custodian Asset Management Plans (CAMPs).
Regrettably, this work is seldom undertaken as scheduled. The lack of adequate control systems to safeguard and maintain assets has led the Auditor-General to increase the number of public entities with findings on asset management (AuditorGeneral of South Africa 2018).
A systematic methodology for assessing healthcare infrastructure condition and estimating maintenance costs is described in the Infrastructure Unit System Support (IUSS) series of documents produced by the NDoH and the CSIR (in particular, NDoH & CSIR 2014), paving the way for GIAMA compliance in the health sector. However, IUSS guidance is mandatory only for new infrastructure3 and therefore not obligatory for the vast majority of health infrastructure stock, which predates the IUSS. As a consequence of poor compliance with GIAMA and limited uptake of IUSS, there are neither consistent condition assessment methodologies nor complete datasets of the condition of the South African public health sector facilities.
REVIEW OF AVAILABLE DATASETS
The 2006 and 2011 methods and why they could not be used for the 2017 report card
The multi-sector infrastructure condition report cards prepared by SAICE were introduced earlier. This paper confines its further attention to the public sector health built infrastructure portfolio.
The hospital and clinic condition assessment for the 2006 report card relied almost entirely on a specialist researcher with excellent links to the NDoH. His considerable experience included overseeing preparation of the comprehensive baseline data set of the 1995 National Health Facilities Audit and his preparation of an extensive maintenance budget analysis for the DBSA (Development Bank of Southern Africa) Infrastructure Barometer (Abbott et al 2007).
By the time that preparation for the SAICE report card to appear in 2011 had begun, it was found that the 2006 research methodology was not replicable due to the absence of both a recent baseline condition assessment and a maintenance budget analysis comparable to the 2007 Infrastructure Barometer. The CSIR therefore, in preparing a technical report on public sector health infrastructure condition, supplemented the published data it had access to by convening field research teams of built environment professionals. Following a training programme and calibration to ensure consistency between assessments, the teams undertook a rapid field survey of a randomly selected statistical sample.
Three data collection techniques were employed on site visits:
■ Using a standardised rating system developed by the CSIR, a thorough walk-through inspection of each facility enabled completion on site of a customised condition and facility assessment.
■ Interviewing the highest-ranking hospital or clinic staff member available.
■ Photographing building-related aspects of facilities.
When the time came to prepare for the SAICE report card which was eventually published in 2017, budget constraints did not allow the 2011 methodology to be employed again. This compelled an introspection of the characteristics of a useful dataset, a review of the available healthcare information systems, and a review of the available relevant datasets.
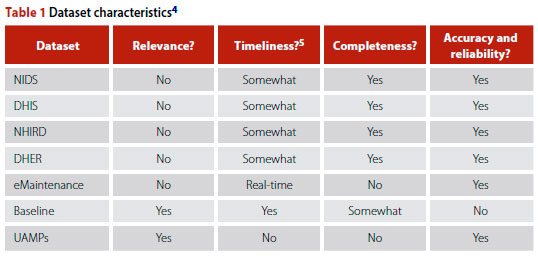
Characteristics of a useful dataset
Determining to what extent there had been meaningful infrastructure condition change since the 2006 and 2011 report cards would require sufficient suitable data.
In order to be usable, a dataset for infrastructure condition assessment would need to have a number of specific characteristics.
■ The data collection method and the resulting dataset would need to be credible.
■ The dataset would need to contain information on the following infrastructure components at minimum: the building envelope (external facade); roofs; floors; internal walls; doors and ceilings; balustrades, handrails; plumbing, water supply, sewage pipes, fire protection and medical gas pipelines; and electricity supply including back-up generators.
■ Data would need to be relatively recent (better still, real-time - but no such datasets are kept by the public health sector).
■ Finally, the dataset would need to be of a number and range of healthcare facilities sufficient for it to be representative of the diversity of the healthcare infrastructure portfolio.
Healthcare information systems
The National Department of Health (NDoH) is custodian of a number of data-sets, including the National Indicator Data Set (NIDS), District Health Information System (DHIS), and District Health Expenditure Review (DHER). It also has access to a range of datasets from other government departments, such as Statistics SA, Human Sciences Research Council, Medical Research Council, and from national and international development partners. NDoH has established the National Health Information Repository and Data (NHIRD) Warehouse project for integrating data from the various specialist information systems that exist. This enables it (NDoH) to develop composite indicators (e.g. staffing workloads, human resource cost per patient seen, etc) and to compare and understand the status of health services from multiple perspectives (HISP 2016).
Tracking of maintenance activity varies from province to province - in some it is a paper-based system. In recent years the Gauteng Department of Infrastructure Development introduced an eMaintenance system for fault reporting, tracking activity and performance management across all provincial government departments which are responsible for built environment infrastructure, including the provincial Department of Health.
In 2011/2012, the NDoH conducted the National Health Care Facilities Baseline Audit which included an assessment of infrastructure condition (NDoH 2012b). Inter alia it came to the conclusion that infrastructure in clinics is often inadequate; with 80% of clinics not fit for purpose (Operation Phakisa 2015: 66). Drivers of this outcome were identified as poor design, sub-standard build quality, the inappropriate use of materials, inadequate built services, and lack of maintenance.
Although the baseline data was not made publicly available, the CSIR was given selected access for the purposes of compiling the technical report underpinning the 2017 infrastructure report card. Updating information from this data, it was possible to estimate that the public sector health estate had a combined gross area in excess of 10 million m2 with a current replacement cost for buildings alone (i.e. excluding fittings and equipment) in excess of R180 billion (De Jager 2017).
A review of the available datasets (Table 1) showed that none possessed all the identified characteristics required for it to be usable in the technical report. Datasets were either not relevant, not recent, not sufficiently extensive in scope or not accurate or reliable.
However, there was one further option.
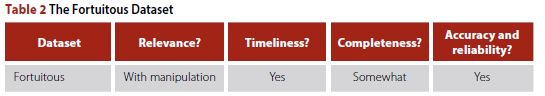
To address the widening maintenance backlog and to prepare facilities for the realisation of its National Health Insurance (NHI) strategy, in 2015 the NDoH appointed two service providers to systematically collect data as a basis for establishing works orders and issuing maintenance framework contracts. Whilst these data collection activities were not primarily intended to assess conditions, nor were they presented as such, they nevertheless provided a recent, extensive and credible dataset (Bigen 2016; SMEC 2016). Given the limited funding and time available for conducting primary research, the best option available to the CSIR was to undertake a desktop analysis of the data collected by the two service providers. For the purposes of the technical report underlying the health infrastructure part of the 2017 report card (De Jager 2017) this set was referred to as the 'Fortuitous Dataset' (Table 2).
THE FORTUITOUS DATASET
Scope
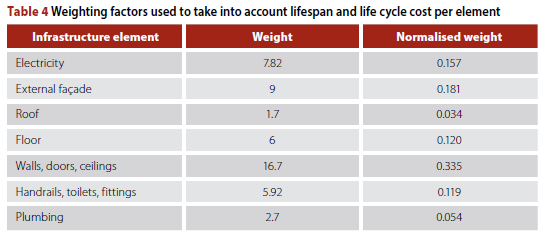
The Fortuitous Dataset included assessments of 552 facilities from eight provinces,6 comprising:
■ 55 community health centres
■ 459 clinics, including antiretroviral out-patient centres and gateway clinics
■ 36 hospitals
■ 2 nursing schools.
Source dataset contents and format
The Fortuitous Dataset was provided electronically, in folders corresponding to the work packages received from professional service providers. Work packages contained subfolders with individual facility folders each containing most, but not necessarily all, of the documents listed below, individually provided per facility in .pdf format. The packages of significance to the 2017 report card infrastructure condition assessment were:
■ 'Red Flag ' facility services
These were structured questionnaires administered during professional service provider visits to each facility. The most senior facility manager available was asked questions about staff quarters, waiting area, cross ventilation, building fatigue, space optimisation, waste removal, electricity supply, generators, sanitation, water, security, road and parking infrastructure, access, and disability access. An open-ended comments section was useful for picking up issues not readily apparent in the visual inspections -e.g. chronic plumbing or electrical failure. Thus, staff could use these visits to alert the service providers to critical issues.
■ Health technology assessments These covered medical devices and equipment.
■ Inspections
The service providers conducted systematic visual inspections of the facilities. From these they developed work instructions and asset management schedules (see below).
■ Work instructions
Service providers comprehensively listed repairs needed, also compiling a file of substantiating photographs. This data was then compiled with reference to location, quantity, description of fault and remedial activity.
■ Asset maintenance schedule
A table of routine maintenance activities required on an ongoing basis was drawn up.
■ Bill of quantities
Work identifications in a standardised elemental format related to the Standard Specification document, taking into account quantities derived from drawings and Work Instructions.7
■ Drawings
These were CAD-readable and editable drawings (in .dwg format).
Documentation covered all immovable assets on site, including workshops and plant rooms, public ablutions, gatehouses, fences and staff accommodation.
Source data credibility
The source data was collected on site by representatives of two professional service providers (large, well-established engineering firms with national footprints) who were awarded the contract through an open tender process. The team members deployed to assess conditions were suitably experienced and qualified built environment professionals, although, as far as could be ascertained, not health infrastructure specialists. Field workers were adequately briefed and monitored, as is evidenced by the consistent quality of data.
Source data verification
The 2015 NDoH condition assessment source data (the Fortuitous Dataset) was examined and found to be sufficiently comprehensive and uniformly presented. The data collection process appeared to have been well monitored with ongoing quality control by the NDoH, since a number of progress reports show improvements between first and second assessments.
The CSIR furthermore verified a random sample against satellite imagery and photos of facilities it had visited for other purposes (notably engineering and environmental risk assessments). There were few discrepancies.
Given the foregoing, the Fortuitous Dataset was deemed to be not just the most recent, but also the most extensive and credible source available. With some desktop processing and analysis, it could yield relevant data.
METHOD
Sample selection
The Fortuitous Dataset was thus indispensable in preparing the technical report underpinning the 2017 infrastructure report card. Nonetheless, because it had not been designed and conducted as a 'living database', presentation of its source data in .pdf and .dwg formats meant that data analysis required laborious extraction and capture before useful information could be yielded. Mainly for this reason, the CSIR captured and analysed in detail only a random sample of the source data.
Since the data had been ordered into folders by institution name, it was not possible to first group the data and then select per subgroup of data, for example per type of facility. The data, including the classification of type and size, had to be captured first in order for that information to be accessible. It was therefore decided to sort the folders by institution name, and then select every tenth folder.
Using only every tenth folder meant that only two hospitals were included in the sample. Since more hospitals were needed to make the 2017 report card comparable to that of its predecessors, six more were added. The final sample therefore consisted of eight hospitals (one per province) and 51 primary healthcare8 (PHC) facilities (i.e. clinics, community health centres and community day centres), with the distribution in provinces and per type as shown in Table 3. Data from the sampled folders were then captured in Excel.
Assessment criteria
Thanks to the Excel format, the CSIR was able to assess the condition of each sampled facility. This it did by examining Red Flag items, works instructions and photographs, and then grading each of the following infrastructure elements separately:
■ external facade
■ roofs
■ floors
■ internal walls
■ doors and ceilings
■ balustrades, handrails, built-in cupboards
■ plumbing, water supply, sewage pipes, toilets, basins, taps, fire protection
■ electricity supply including back-up generators.
Delimitations
The source data material was thus reworked into a format which made it available for assessing conditions across all immovable assets on site, including workshops and plant rooms, public ablutions, gatehouses, fences, and staff accommodation. However only the main clinical and patient areas, workshop and plant rooms were included in the data analysis, since these are the focus of assessing fitness of infrastructure for the provision of health services. This unfortunately introduced bias in that the omitted buildings are typically in the poorest condition of all on site.
Simplification of number and type of elements allowed for more direct comparison across scales and type (from large to small facilities). Thus, for example, mechanical equipment such as lifts, HVAC, boilers and medical gas installations were not included in the elements considered, as these are not provided at all facilities. They generally appear only in hospitals and less frequently in PHC facilities - together less than 10% of the health infrastructure estate by number. Mechanical equipment (in particular mechanical heating, ventilation, cooling and refrigeration) is amongst the most technical of building elements in healthcare infrastructure, subject to early technical obsolescence (20-year lifespan of components) and often found to be in poorer condition than other elements.
Movable assets, grounds and housekeeping were, as far as practicable, not considered in this evaluation. Nonetheless it was problematic to ignore the effects completely, for example where lack of adequate housekeeping hampered condition assessment due to excessive waste or clutter.
Derivation of weighting factors
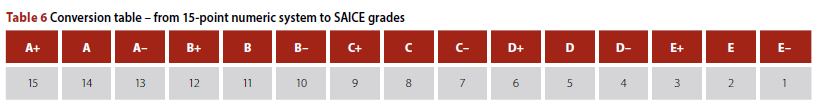
A qualitative grading was allocated to each of the elements and then converted to a 15-point numeric score - the higher the score the better the assessed condition.
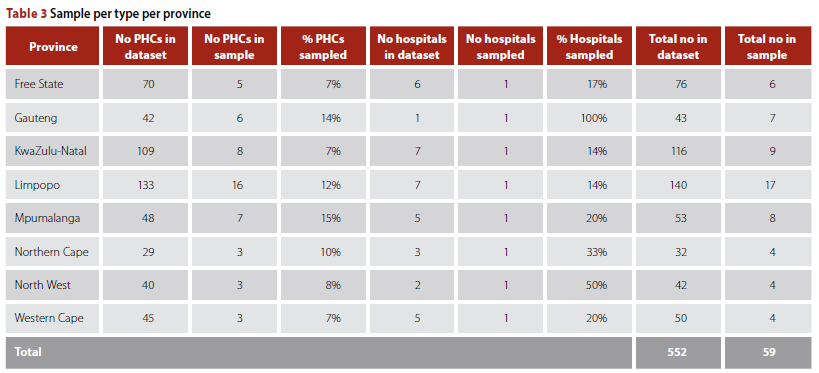
To correct for the different life cycles of the various elements, a weighting factor was added to each infrastructure element. The values of the weighting factors per building element were based on the analysis of three hospitals - Mamelodi, Bertha Gxowa and Thelle Mogoerane which had been undertaken as part of background research for IUSS hospital cost models.9The bills of quantities and building costs for this were divided into building elements as per the Guide to Elemental Cost Estimating and Analysis for Building Works 2013 published by the Association of South African Quantity Surveyors (ASAQS 2013).
The relative percentages derived, underlying the weightings, were therefore linked to specifications and materials used in the case studies of the abovementioned three recently constructed standard-type hospitals for which cost data by infrastructure element was available. Of course, a larger sample set would have improved confidence and would also have enabled a more nuanced approach to weighting, for example by facility type and size (which is strongly associated with complexity). However, while this larger sample was not available, the sample that was actually used was sufficient for proof of concept.
A relative weighting per element was derived as shown in Table 4. The weights in the second column were normalised in the last column to ensure that they would sum to 1 (or 100%) over all the elements.
Using works instructions to infer and determine condition
The CSIR examined works instructions provided in the Fortuitous Database for each facility of the sample. These instructions were sufficiently comprehensive and explicit for it to be safely assumed that where no work was proposed on a particular infrastructure element at a particular facility, then the condition of that element had been found satisfactory. A default value of 'C' was given if no Red Flag or works instruction was found, but this was adjusted to a 'B' if the overall age of the facility was between five and ten years, and 'A' if less than five years.
If, however, there was a works instruction for an element, the photographs in the service provider's report were studied and the element was given an assessment according to the 15-point scale. A final score was determined by applying the weighting (Table 4) to the scores per element, and then aggregating the weighted scores for each facility.
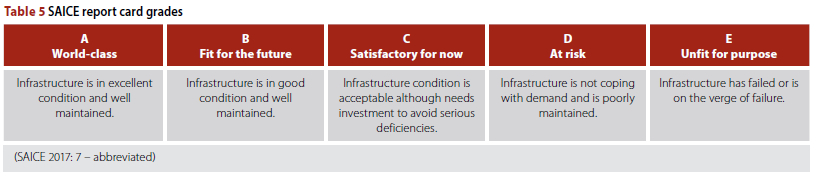
The final grades -and their implication
These final scores were then converted to the SAICE scorecard grades in terms of the SAICE report card definition of such grades, as set out in Table 5.
Table 6 shows the equivalents in the 15-point numeric system.
The average condition of the South African public sector healthcare infrastructure could thus be categorised as follows:
■ D+ for hospitals
■ D for clinics.
In terms of the definitions in Table 5, therefore, the infrastructure would on average appear to be 'at risk'. The authors submit, however, that the criteria for inferring 'risk' from infrastructure condition where that infrastructure is for any other purpose than public health service delivery should not apply to many elements of infrastructure that are used for public health service delivery. In short, the risk to public health service delivery is higher.
Putting it simply, a building could be 'fair' or 'good enough' for a multitude of other users, e.g. commercial or residential, but would not be suitable for rendering health care services. Thus, whilst the SAICE report card grading system uses the language 'fair' to describe its midpoint grading of 'C', in the context of healthcare infrastructure it may be more appropriate to conceive of 'C' as no better than 'mediocre'. The reason is that 'fair' implies a level of acceptability which belies the degree of risk (financial and health) that infrastructure condition presents to certain types of healthcare facility. At 'C' level and below, patient care and safety are adversely affected. Thus, for healthcare infrastructure, 'A' or 'B' grades should be considered the minimum requirement. Anything below a 'C' impedes service delivery and increases to unacceptable levels the risk to patients and staff.
CONCLUSIONS
Findings on the derivative method
It was found that:
■ the Fortuitous Dataset provided by National NDoH gave a reasonably good picture of the condition of the public health sector infrastructure, despite
■ the data not being as comprehensive as might be desired, and despite some of that which is available being found unreliable.
The CSIR exercised ingenuity in adapting the data which it could get hold of -'reverse engineering' it - in order to comprehend the condition of the South African public health sector infrastructure. It had to work with what it could get - and much of this was in distinctly unfriendly formats. Nonetheless it managed in a practical way to produce credible data, invaluable to the 2017 report card.
The need for an improved database
From time to time, various government departments undertake condition surveys (e.g. NDoH 2012b). Depending on how they have been designed, and how they are carried out and the data captured, these could be no more than snapshots of a point in time. While these snapshots are of great value, the surveys should ideally be used to build a 'living database'.
There appear to be three main reasons for this lack of a living database:
■ Infrastructure asset management is not sufficiently prioritised by the Departments of Health in any sphere of government, and thus the necessary resources are not mobilised.
■ The Constitution holds that healthcare is concurrently a national and provincial competence. Thus, while the NDoH perceives it is held accountable for non-performance of provinces and individual institutions, it (with much justification) feels it is not granted the necessary authority or resources (Motsoaledi 2017).
■ Responsibility for state-owned infrastructure is split between user and custodian departments. This is typified in that GIAMA defines the 'user' (for public health infrastructure, the national, provincial or local Department of Health) and the 'custodian' (here, the corresponding Department of Public Works or implementing agent), but does not make clear where the boundary between user and custodian lies. That is, it does not make clear where the buck for non-performing infrastructure stops.
Recommendations
To effectively manage its infrastructure assets, a large and complex organisation, such as represented by the national and provincial departments of health, needs to jointly take a long-term view of the infrastructure asset management data needs. It must establish the framework for a sustainable database, build it up over the years, and ensure it is managed by professionals skilled in both data management and infrastructure asset management. Custodians of this 'living database' need to ensure that:
■ the database is comprehensive (this can be achieved gradually)
■ additions to the database are in compatible formats (or can easily be made so) so that, for example, repair work done on infrastructure in the field can quickly and accurately be added to the database
■ the database is in a format which is usable for:
■ condition assessments
■ identification of work that needs to be done
■ recording of work which is done
■ auditing
■ easy grouping or abstraction (e.g. to draw up summaries and cross-correlations).
Finally, whereas departments responsible for infrastructure and service delivery, such as the NDoH, have a responsibility to compile infrastructure asset information, and they seek to obtain this from a multitude of facilities all over the country, it makes life difficult for these facilities if they are required to provide information for different purposes to different authorities - that is, to assemble the same information (but, frustratingly, not exactly the same information, and not to the same level of detail), in different formats, at different times, for different purposes. It is difficult to satisfy the differing demands of, on the one hand, regulation and compliance (exemplified by GIAMA and the Auditor-General), and on the other hand what should be measured and recorded if the needs of service delivery are to override other requirements (as the authors feel they should).
It is recognised that to compile the needed 'living database' optimised for the needs of infrastructure asset management would be taxing for even the most capable of institutions - even without those institutions also having to satisfy regulation and compliance data needs.
Therefore. government needs to re-look what it is asking departments to do. In short, it needs to (i) bring a degree of uniformity to the type, level of detail of and timing of data required by, at least, those most demanding of data (e.g. the Auditor-General), and (ii) simplify data requirements, while (iii) at the same time improving the service delivery purpose of that data, such as by focusing on the data most useful to the management of current service deliverables.
Lessons
Data gathering can be fraught, and data gathered is seldom clean or complete. The paper describes, by way of the public health sector, the practical difficulties of gathering data on infrastructure conditions, and how a boer maak 'n plan pragmatism can at times be the only way to compensate for data inadequacies.
The pragmatic approach yielded defensible results despite data formats which inhibited comparative analysis. Which is more than could have been said had a more academic approach been taken - this would have made little headway when faced with the less than perfect data reality.
The NDoH had recently completed a multi-year sample survey of public health infrastructure. However, while it had commissioned competent service providers to undertake portions of the work, it would seem that little thought had been given to subsequent integration and analysis of the data. This need not happen again.
ACKNOWLEDGEMENTS
The authors acknowledge with thanks (i) the cooperation of NDoH officials, in particular them making raw data available, and (ii) the assistance with analyses rendered by René Koen and Lorato Motsatsi of the CSIR.
REFERENCES
Abbott, G R, McDuling, J J, Parsons, S & Schoeman, J C 2007. Building conditions assessment: A performance evaluation tool towards sustainable asset management. Proceedings, CIB World Building Congress, Construction for Development, 14-18 May 2007, Cape Town. Available at: http://researchspace.csir.co.za/dspace/handle/10204/1233. [ Links ]
ASAQS (Association of South African Quantity Surveyors) 2013. Guide to Elemental Cost Estimating and Analysis for Building Works 2013. Available at: https://aaqs.org/wp-content/uploads/2020/05/AAQS-Guide-to-elemental-estimating-2016-1.pdf. [ Links ]
Auditor-General of South Africa 2018. Consolidated General Report on National and Provincial Audit Outcomes. Report No PFMA 2017-18. Pretoria: Auditor-General. [ Links ]
Bigen Africa 2016. Electronic Dataset. Unpublished report by Bigen Group to the National Department of Health. [ Links ]
De Jager, P 2017. The State of Public Health Built Infrastructure in South Africa. CSIR draft report, unpublished. [ Links ]
HISP (Health Information Systems Program) 2016. Building better lives with digital health tools and solutions. Available at: http://www.hisp.org/projects/south-africa-projects/. [ Links ]
Motsoaledi, A 2017. Motsoaledi laments zero authority to help ailing hospitals. News24. Available at: https://www.news24.com/SouthAfrica/News/motsoaledi-laments-zero-authority-to-help-ailing-hospitals-20170914. [ Links ]
NDoH (National Department of Health) 2012a. Categories of hospitals. Government Notice No R. 185 of March 2012. Pretoria: Government Printer. [ Links ]
NDoH 2012b. The National Health Care Facilities Baseline Audit: National Summary Report. Available at: https://health-e.org.za/2013/09/20/national-health-facilities-baseline-audit. [ Links ]
NDoH & CSIR (Council for Scientific and Industrial Research) 2014. IUSS Health Facility Guides: Maintenance. Copies may be requested from the National Department of Health. [ Links ]
Operation Phakisa 2015. Ideal Clinic Realisation and Maintenance. Final lab report. Available at: https://www.idealhealthfacility.org.za. [ Links ]
SAICE 2006. SAICE 2006 Infrastructure Report Card for South Africa. Available at: https://saice.org.za/downloads/saice-reportcard.pdf. [ Links ]
SAICE 2011. SAICE 2011 Infrastructure Report Card for South Africa. Available at: http://www.saice.org.za/downloads/monthly_publications/2011/2011-Civil-Engineering-may.pdf. [ Links ]
SAICE 2017. SAICE 2017 Infrastructure Report Card for South Africa. Available at: http://saice.org.za/wp-content/uploads/2017/09/SAICE-IRC-2017.pdf. [ Links ]
Sarfin, R 2021. 5 Characteristics of data quality. Available at: https://www.precisely.com/blog/data-quality/5-characteristics-of-data-quality (accessed in April 2022). [ Links ]
SMEC South Africa 2016. Electronic dataset. Unpublished report for the National Department of Health. [ Links ]
Wild, S 2016. Is Soweto's Chris Hani Baragwanath Hospital really the world's 3rd largest? Available at: https://africacheck.org/reports/is-sowetos-chris-hani-baragwanath-hospital-really-the-worlds-3rd-largest. [ Links ]
 Correspondence:
Peta De Jager
CSIR Built Environment
PO Box 395, Pretoria 0001, South Africa
E: pdejager@csir.co.za
Kevin Wall
Department of Construction Economics, University of Pretoria
Hatfield 0028, South Africa
T: +27 82 459 3618, E: kevin.wall@up.ac.za, kevinwall468@gmail.com

PETA DE JAGER (Pr Arch, MA) is a registered professional architect in full-time employment in the Smart Places Cluster of the Council for Scientific and Industrial Research (CSIR). She currently manages the Functional Building Infrastructure impact area, focusing on research, science and innovation to support clients' immovable asset procurement, design, construction, operation, maintenance and strategic planning. Her research interests include context-appropriate, evidence-informed approaches to promoting health and wellness in the built environment. She is a past president of the South African Federation of Hospital Engineering, the current editor of the Sustainability Handbook, and is a doctoral candidate at the University of the Witwatersrand.

DR KEVIN WALL (Pr Eng, Pr Pin, HF SAICE), who is a civil engineer and town planner, is Extraordinary Professor at the University of Pretoria and a Fellow of the South African Academy of Engineering. Until earlier this year, he was also a non-executive board member of the City of Ekurhuleni's wastewater treatment entity. A past president of the South African Institution of Civil Engineering (SAICE), he has received both the Gold Medal of SAICE and the Lifetime Award of the National Science and Technology Forum, the highest honour that can be bestowed by the science, engineering and technology community. Much of his work over the last two decades has been on the effectiveness of government spending on infrastructure, and ways to improve the quality, reliability and sustainability of that infrastructure.
1 The infrastructure sectors covered in 2006 were: water and sanitation, solid waste management, roads, airports, commercial harbours, the rail network, electricity and hospitals and clinics. The 2011 report card added public schools, while the 2017 report card added higher education infrastructure.
2 Whereas hospitals and clinics privately funded and operated account for approximately 25% of the total beds, and nearly half of national health expenditure, the condition of these facilities was not considered in the report card.
3 As promulgated in Gazette No 37348 R 116 of 17 February 2014; No 37790 R 512 of 30 June 2014; and No 38776 R 414 of 8 May 2015.
4 Using the definitions of data quality characteristics of Sarfin (online - accessed 2022) (Sarfin 2021).
5 'No' is data five years or older in 2017. 'Somewhat' means data is collected and captured with a delay. 'Real-time' is data which is updated at least monthly.
6 Eastern Cape was not included in the data provided by the NDoH. No explanation was given for its omission.
7 The intention seems to have been to prioritise the remedial work or replacement, call for tenders (hence the preparation of work instructions and bills of quantities), and appoint contractors to do the work. The extent to which this was actually carried out is uncertain, although probably limited.
8 Excluding district hospitals.
9 Costing courtesy of Aurecon.

