


Services on Demand
Article
 English (pdf)
 Article in xml format
 Article references
Indicators

Related links
-
 Cited by Google
 -
 Similars in Google
Share

 Permalink
Journal of the South African Institution of Civil Engineering
On-line version ISSN 2309-8775
Print version ISSN 1021-2019
J. S. Afr. Inst. Civ. Eng. vol.64 n.3 Midrand Sep. 2022
http://dx.doi.org/10.17159/2309-8775/2022/v64n3a4
TECHNICAL PAPER
Quantifying MyCiTi supply usage using Big Data and Agent-Based Modelling
D Willenberg; M Zuidgeest; E Beukes
ABSTRACT
Cape Town's Bus Rapid Transit (BRT) system, MyCiTi, uses an Automated Fare Collection (AFC) system that generates large volumes of transactional data on a daily basis. This data can be considered Big Data. The AFC data in its raw format, however, is incapable of supporting supply and demand analysis (e.g. studying bus occupancy rates). Agent-Based Modelling (ABM) can be used to analyse such data for that purpose.
This paper discusses the development and calibration of a MATSim-based ABM to analyse AFC data for Cape Town's BRT system. It is shown that data-formatting algorithms are critical in the preparation of data for modelling activities. Furthermore, the development of appropriate ABM calibration parameters requires careful consideration in terms of appropriate data collection, simulation testing, and justification, which are discussed.
The paper furthermore shows that the calibrated ABM can generate outputs such as bus on-board volumes, a system-demand overview, and even individual commuter path choice behaviour. Finally, a validation exercise shows that the model developed for this study is able to provide good estimates of on-board bus volumes (R2 = 0.85). It is, however, recommended that further research be conducted into studying agent path choices through simulation.
Keywords: MyCiTi, Agent-Based Modelling (ABM), MATSim, Big Data, transit supply estimation
BACKGROUND
The MyCiTi Bus Rapid Transit (BRT) represents the first major attempt by the City of Cape Town (CoCT) to improve the quality of public transport services and promote more sustainable urban development patterns (City of Cape Town 2019). The MyCiTi is intended to enhance the efficiency of urban public transport by attracting new users through improvements in travel time, reliability, and convenience. The system includes features such as level boarding platforms, closed transfer facilities, and an Automated Fare Collection (AFC) service.
The provision of high-quality public transport systems requires a significant financial commitment. Financial sustainability therefore plays an important role in providing and maintaining a high-quality service to customers. Due to the complexities associated with balancing service levels with costs, many public transport systems around the world suffer from low productivity, high costs, and a need for large government subsidies (Buehler & Pucher 2011). The MyCiTi is no exception to this rule. The MyCiTi Business Planning Department has found that subsidy requirements for MyCiTi operations are significantly higher than the initial business plan estimates, and that there is a critical need to ensure that the MyCiTi supply is being provided as efficiently as possible (Grey 2015).
When the transport supply (vehicles and schedule in space and time) matches as closely as possible with passenger demand (travel to and from activities by users in space and time) it is possible to achieve operational cost efficiencies by reducing vehicle kilometres travelled without negatively impacting on commuter experience (primarily in terms of waiting time). A tool to quantify the relationship between this supply and demand would therefore be of significant benefit to the MyCiTi, in particular MyCiTi supply planners, as it would be possible to make proactive and data-driven supply management decisions, whereby new network interventions, such as changes in route alignments or bus schedules, could be modelled and impact-quantified (e.g. network cost and waiting time) before being launched.
INTRODUCTION
Typically, data becomes Big Data when its volume, velocity or variety exceed the abilities of IT systems to ingest, store, analyse and process the data (Jeffcock 2013; Yap & Munizaga 2018). An abundant source of passenger ridership information is generated via the MyCiTi AFC service. The AFC utilises smartcard technology to determine the fares that passengers should pay per journey. A by-product of the AFC is an automated and consistent flow of transactional information about passenger-boarding and passenger-alighting numbers, stop locations and journey times, which can be considered as Big Data. This data can be sourced easily and at no cost by data analysts within the MyCiTi AFC department.
One of the major shortcomings of AFC transactional data, when it comes to providing additional analytical insights, is that it lacks detailed information on how passengers can get from one stop location to another at MyCiTi closed stations (the actual path). At MyCiTi closed-station facilities, passengers do not tap in or tap out when transferring between different routes, which results in missing attribute data for certain transactions. Inspection of the AFC smartcard data reveals that approximately 50% of all recorded smartcard transactions are missing-path attribute data.
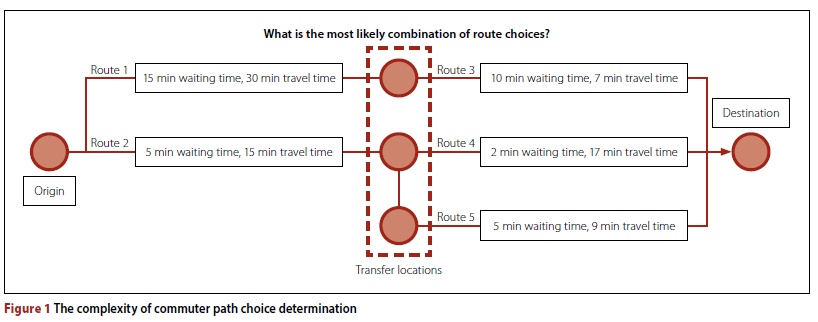
Without the aforementioned missing-path information, one does not know which routes or services a passenger has chosen, especially where multiple route choices are possible or, for example, where the station saturation levels are such that passengers are not able to board the first available bus. This means that it is not possible to determine which bus a passenger has actually boarded. It is therefore not possible to quantify MyCiTi usage in a manner which is of real benefit to planners, such as for accurately estimating on-board bus volumes or levels of closed-station crowding. If MyCiTi planners could possess such reliable passenger path choice information, it would be possible to aggregate data to the route or bus level for generating invaluable service-level insights. An example of the complexity in determining the route choices of a commuter between an origin and destination is shown in Figure 1.
This study aims to demonstrate that ABM can estimate the relationship between MyCiTi supply and passenger travel demand through the use of revealed MyCiTi AFC transactional data and planned bus schedules. Initially, this paper will review the opportunities, benefits and risks of pursuing an ABM approach. Thereafter, the methodology and implementation will be discussed. Finally, we will review the analysis of the ABM outputs, the validity of the outputs, and the way forward for future research.
The purpose of this study
The MyCiTi represents a complex system, which can be analysed through Agent-Based Modelling (ABM). ABMs have been used around the world to simulate public transit supply usage using smartcard data such as in Singapore (Fourie et al 2016) and Australia (SangHyung et al 2017). The purpose of the study presented in this paper is to show that ABM theory can be effectively applied in the South African context, in particular for processing MyCiTi smartcard data and for quantifying public transport supply usage at the individual bus level.
LITERATURE REVIEW
The role of demand modelling in supply management
Public transport agencies typically want to know the impacts of changes to their networks or service levels on public transport patronage. Public transport patronage models provide a basis for public transport planners to analyse the impacts of those proposed service changes to assist in budget preparation and other resource allocation decisions (Chu 2004). They also provide important input into passenger demand models, which are used for performance monitoring, scheduling, and service planning (Chu 2004; Chu et al 2007)
Yet, most passenger demand models are static, aggregated and deterministic, and are built on the principles of the classic four-step model, thereby struggling to remain accurate and useful for activities such as daily operational performance testing. Automated data collection and ABM, however, provide an excellent opportunity to overcome these challenges and are known to allow for more advanced modelling and analysis of public transport performance (see, for example, Ziemke et al 2019).
ABM to 'mine' Big Data in public transport
ABM can be used to both analyse and generate Big Data (Chen 2017) and has been used to model real-life systems in a diversity of domains, such as biology, manufacturing, computing and economics. ABM methods are becoming increasingly used in various areas of transportation, such as pedestrian-flow modelling, route-choice modelling, car-following models, and traffic simulation (Abbas & Machiani 2016).
ABMs are designed around the premise that the collective behaviour of autonomous agents obeying their own simple rules can result in the emergence of complex system behaviour traits, such as traffic congestion. ABMs therefore use a bottom-up approach to modelling systems. ABMs are developed by understanding the behaviour of the constituent parts within a specific system. Based on unique agent characteristics, it is possible to deduce a certain type of travel behaviour. A population of individual agents with their own unique characteristics and behaviours can then be made to interact with each other within the physical limitations imposed by the environment. For example, commuters do not plan for buses to be full, or bus stops to be congested. These events occur due to complex interactions between commuters and their environment (Joubert et al 2010; Horni et al 2016).
While ABM has several benefits in transportation research, there are certain risks and limitations that come with adopting the approach. Many complex ABMs can deal with sufficiently sensitive issues, in which validation becomes problematic, and this difficulty increases as models become more complex (US Department of Transport 2013). In addition, although computing power is growing at an impressive pace, there are scalability concerns with ABM (due to high computational requirements) when it comes to modelling extremely large systems (US Department of Transport 2013).
Predicting the behaviour of the overall system based on its constituent components is also extremely difficult (sometimes impossible) because of the strong possibility of an emergent behaviour (Jennings 2000). Another issue with ABM in the social sciences field is that it often involves human agents with potentially irrational behaviour, subjective choices, and complex psychology. All of these factors are difficult to measure, quantify, calibrate, and sometimes justify (US Department of Transport 2013).
METHODOLOGY
ABM development plan
In the case of MyCiTi, both the public transport timetables and smartcard data can be broken down into individual agents with their own unique characteristics and behaviours, which can be made to interact within an ABM. The MyCiTi public transport supply is quantified here in terms of planned bus schedules. Each bus in the simulation adheres to specific rules, such as what route it needs to take, which stops to service, and the times at which these stops need to be serviced. Buses attempt to stick to their planned schedule while dealing with traffic congestion and other unforeseen schedule influencers. Bus-bunching (buses grouping together unexpectedly) is a typical example of how buses deviate from their planned schedules due to unexpected delays from traffic signals and commuter interactions.
MyCiTi commuters are quantified using smartcard data. Each smartcard anonymously represents a unique commuter agent who interacts according to the availability of the public transport supply. Smartcard data holds key point-to-point information, such as boarding/alighting locations, departure/arrival times, and calculated trip durations, which reveals when and how a commuter will interact with the MyCiTi supply.
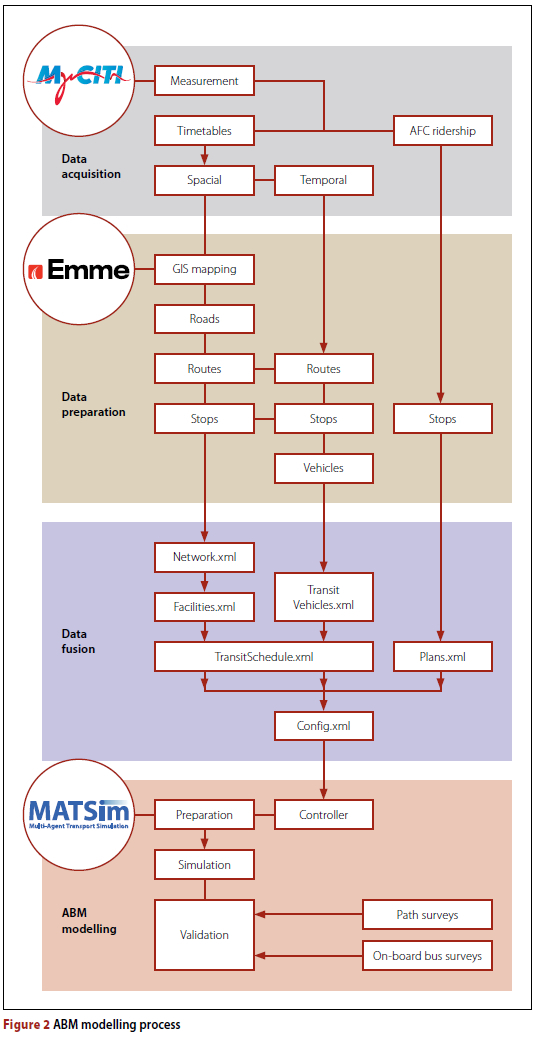
Commuter behaviour (demand) is heavily dependent on the availability of public transport vehicles (supply). The public transport supply, however, possesses both spatial and temporal limitations. Spatial limitations are factors such as distances between stops and the number of seats on a bus, while temporal characteristics are factors such as the times at which buses are available for passengers and the travel times of buses between origin and destination stops. Arriving late for work is one example of how commuter agents can deviate from their plans. Ultimately the goal is to simulate all of the aforementioned behaviours realistically in an ABM framework and to show that simulation outputs can be used to quantify supply usage reliably. A schematic overview of the use of AFC data and the ABM modelling process adopted in this study is shown in Figure 2.
MATSim as the ABM framework
This study uses MATSim, which is an open-source, large-scale, agent-based transport simulation framework and model developed jointly at TU Berlin, ETH Zurich, and Senozon Company (Horni et al 2016). MATSim has been used in several studies and projects around the world and is capable of simulating millions of agents on large, detailed networks (Abbas & Machiani 2016). In South Africa, MATSim has been applied in city-wide traffic simulations, freight simulations, minibus taxi paratransit behavioural investigations, as well as for public transport network design (Joubert et al 2010; Neumann et al 2015; Nnene et al 2019a, 2019b).
MATSim model functionality
MATSim is based on the co-evolutionary principle. Every agent repeatedly optimises its daily activity schedule while in competition with all other agents for the limited space-time slots on the transportation infrastructure (Horni et al 2016). A MATSim run contains a configurable number of iterations of simulation, scoring and replanning, as can be seen in Figure 3.
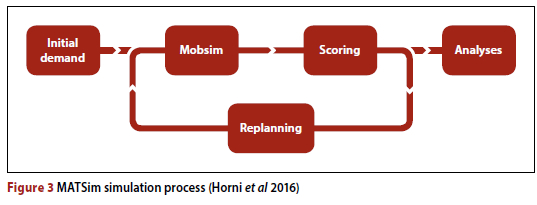
The simulation commences with an initial demand arising from an input population's daily activity chains (Horni et al 2016). Activity chains are typically derived from empirical data through sampling or choice modelling. However, in this particular study they have been derived from smartcard transactional data.
Within the MATSim simulation process, each agent selects a plan from its memory which it then attempts to execute within the MATSim mobsim (mobility simulation) with the primary goal of maximising its score (Horni et al 2016). Plan scoring is typically calculated in terms of utility, which is a function of an agent's travel time and time spent performing desired activities should a specific plan be chosen. All agents within the simulation will seek to maximise their utility scores while remaining in competition with each other. The simulation can be considered as complete once all agents are unable to further improve their plans unilaterally (Horni et al 2016).
Understanding the MyCiTi and MATSim input data structures
Once installed and set up, MATSim requires that all input files be written in Extensible Mark-up Language (XML) data format while adhering to various internal rules and syntax.
For this study, three key MyCiTi data sources are analysed, merged and transformed for input into MATSim, namely, (1) the MyCiTi timetables, (2) the AFC ridership information, and (3) the MyCiTi Geographical Information System (GIS). The aforementioned data sets possess unique data structures (in different formats), but each contains useful attribute data such as stop names, route names and departure times.
Establishing a framework for Big Data fusion
An important step in preparing the MyCiTi data for further analysis is that of data fusion, whereby several heterogeneous data sets, based on shared variables, are matched and aggregated (International Transport Forum 2015).
In this study, the transport modelling software EMME/4 is used due to its strong GIS capability. EMME/4 was used to link and represent the MyCiTi timetables and the AFC ridership data spatially within the same reference system, using MyCiTi stop names as identifiers.
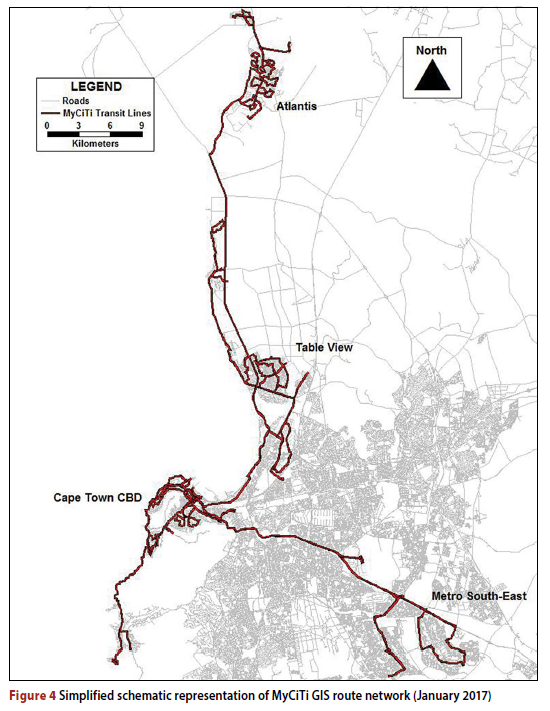
The MyCiTi-GIS network consists of overlapping transit lines, with each line possessing unique characteristics. Each line typically travels in one specific direction, either forward or reverse, and services fixed stop locations. A simplified schematic representation of the MyCiTi-GIS network is shown in Figure 4 on page 36.
MATSim data formatting algorithms
Due to the large volume of data that needs to be processed, it is necessary to design automated data-formatting algorithms. All MATSim input files were built using the Python programming language. Python uses its own syntax and built-in data structures to assist in the development of applications, and various other data manipulation practices (Python Software Foundation 2016).
Each algorithm developed as part of this study was designed to create a specific MATSim input file. Each file plays a critical role in the ABM development process, as can be seen in Figure 1, namely:
■ [Facilities.xml] - facilities data that quantifies the spatial locations (and times) where activities can take place, i.e. homes, shops and schools. Agents enter and exit the transport simulation via facilities. In the case of this study, facilities are the origin and destination locations within the MyCiTi transactional data. Each facility within the simulation is treated as a generic location and is allowed to operate for the duration of the MyCiTi service operating hours.
■ [Network.xml] - contains network data which defines the attributes of physical transport infrastructure such as roads and their modes (e.g. walking is permissible) and railway tracks. Agents travel within the limitations of the network.
■ [Plans.xml] - agent plans data which defines the desired trips and desired activities of agents for a target period in terms of departure times, departure locations, activities, and the locations of activities.
■ [TransitSchedule.xml] - public transport schedule information which defines the behaviour of public transport vehicles. This must be quantified in terms of bus departure times, travel routes, and stops being serviced.
■ [TransitVehicles.xml] - public transport vehicle attribute data which defines the physical characteristics of public transport vehicles. This is quantified in terms of vehicle capacities and the physical dimensions of every vehicle being simulated.
■ [Config.xml] - configuration data which is necessary to define general simulation behaviour, such as input file locations, output file formats, computer processor usage, and general system behavioural attributes (including perceived values of time).
Simulation testing and calibration
For this study, the model calibration followed a two-step process, namely (1) defining known system traits such as bus capacities and general smartcard transaction limitations, and (2) reactively adjusting simulation parameters until the simulation travel time outputs behaved similarly to that of the known AFC calibration data.
Calibration activities focused initially on defining known system behaviours that could be expected during simulation. The following key calibration parameters were applied:
■ Vehicle fleet calibration: Based on various surveys and investigations conducted by the MyCiTi operations department, it was found that MyCiTi vehicles rarely operate at 100% capacity (Goelst 2016). It was found that passengers were reluctant to stand, especially for extended periods of time. The carrying capacities of vehicles used in the simulation have therefore been reduced to practical operating capacities (where standing space on each bus type is reduced according to surveyed results).
■ Bus departure and arrival calibration: Any deviation between planned bus timetables and reality can result in unpredictable passenger route choices. Based on discussions with MyCiTi Operations, there is a 95% likelihood that buses will arrive either two minutes before or five minutes after their scheduled time. Bus arrival variance was claimed to be caused by unexpected congestion or bus bunching (where the next bus catches up with the earlier bus due to the first bus picking up all the passengers). To account for variance between planned and actual bus schedules, commuter agents were given multiple plan alternatives. The multiple plans would allow agents to choose whether to depart from their origin location, either five minutes early, at the scheduled time, or five minutes later. A more detailed analysis of MyCiTi Service Level Agreements was deemed beyond the scope of this research topic.
■ Given that all agents represent smartcard data transactions, agents were not allowed to walk to their destinations without interacting with the MyCiTi.
■ The MyCiTi has a 45-minute transfer limit. Agents were therefore limited to a maximum waiting time of 45 minutes prior to making a transfer.
Two key issues were identified during simulation testing, namely that (1) the agent travel time distribution was not similar to that of the AFC input data, and (2) the average travel time of the network was much faster than the AFC input data. The following measures were therefore implemented to address the aforementioned issues:
■ Generalised cost of walking calibration: Initial test runs showed unusual walking behaviour during simulation. Analysis of the leg histogram plots and agent plans showed that agents were not boarding the MyCiTi and were instead walking to their destinations. It was found that the cost of walking had to be increased in order to create a realistic leg histogram distribution.
■ Network travel time calibration: Another issue discovered during simulation testing was that bus agents were travelling much faster between stops than expected. Unusually fast travel times can potentially result in unrealistic transfer movements. An attempt could have been made to correct the aforementioned issue with accurate data on vehicular link volumes; however, this was deemed beyond the scope of this study. Instead, it was decided to lower the permissible speed on the road network so that commuters did not arrive at their location too soon.
ABM OUTPUT ANALYSIS AND DISCUSSION
Key simulation outputs
For this study, the following three key MATSim outputs were used for further analysis:
1. [Plans.xml]: The ABM gives each simulated agent additional attributes, such as walking behaviour, walking travel times, public transport interaction locations, public transport travel times and public transport path choices.
2. [LegHistogram.png]: The ABM creates leg histogram plots that can be used to visualise boardings, alightings and on-board passenger numbers during five-minute intervals.
3. [Events. xml]: This output is a list of all events that take place during a MATSim simulation, sorted in chronological order. The events file is in essence a juxtaposition of various events from different agent perspectives. In the case of a public transport simulation, three key agent perspectives are considered, namely the driver perspective, the vehicle perspective and the commuter perspective.
All data necessary to quantify MyCiTi supply usage is contained within the abovementioned outputs. The following section will discuss the results and findings of a MATSim simulation of a random and ordinary weekday, Wednesday 25 January 2017. All MyCiTi data was processed using the necessary data formatting algorithms for input into MATSim. MATSim then simulated the interactions between MyCiTi passengers and the MyCiTi supply as specified by the input files.
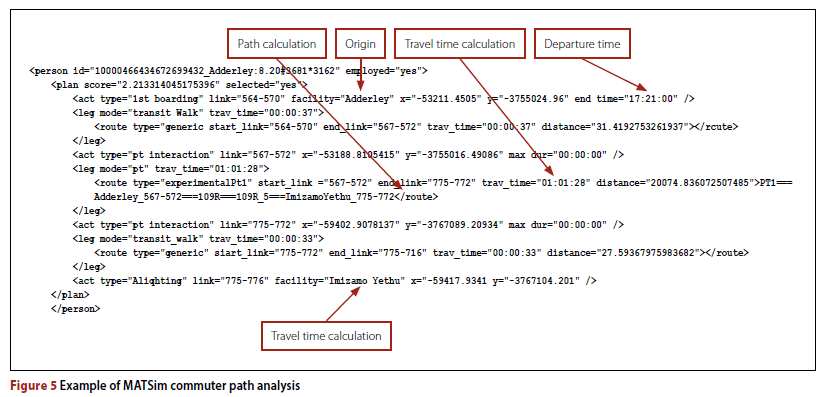
Commuter path analysis
MATSim adds new attributes to commuter agent plans after simulation and creates a new plans file [Plans.xml]. These new attributes include the path choices of each agent, their simulated travel times, and other location-specific information which can be extracted for further analysis, as shown in Figure 5.
Network demand analysis and interpretation
All simulated MyCiTi bus interactions are contained within the Events file [Events. xml]. A data-formatting algorithm was developed to link different commuter-agent interactions with available buses. Once all bus and commuter interactions are linked, it is then possible to create graphs which summarise these interactions. It is possible to aggregate all on-board bus trip usage data to provide a system-wide overview of bus practical capacities (henceforth referred to as seats), as shown in Figure 6. Based on the system overview, approximately 30% of the total daily seats in circulation are occupied. The MyCiTi system is best utilised at around 7 am (when 42% of available seats in circulation are occupied).
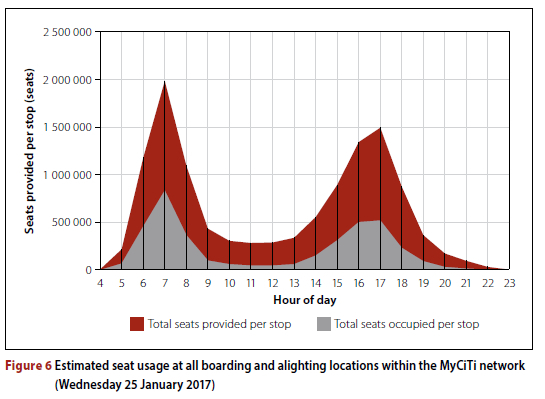
There is a large wave-like travel demand pattern taking place within the MyCiTi. Passenger demand within the MyCiTi bus network peaks significantly during both the AM and PM peak periods - travel demand during peak periods can be up to six times higher than during off-peak periods. Peak periods are also clearly identifiable, with the AM peak hour being between 6:30 am and 7:30 am while the PM peak hour is between 16:30 and 17:30, which mirrors the AFC input data correctly. The seat usage diagram reflects the concerns of officials within the MyCiTi, namely that large wavelike passenger movements and low off-peak usage on routes can impact negatively on the financial sustainability of the service.
This is therefore a good indication that the model is behaving realistically and displays the ability of the ABM to immediately enhance understanding.
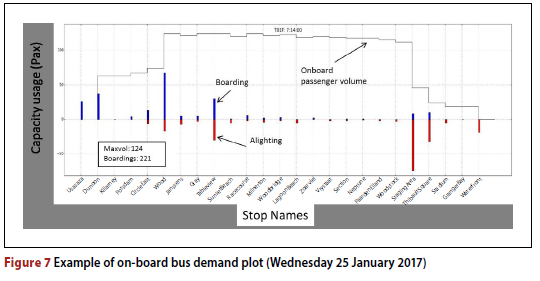
On-board bus demand analysis and interpretation
On-board bus demand plots can also be generated for every single bus departure throughout the day. Bus departure plots have station names on the x-axis and passenger numbers on the jy-axis (see Figure 7). Boardings are positive values, while alight-ings are negative values. The resultant bus occupancy due to boarding and alighting movements is tracked over the entire journey via a solid line. Approximately 4 900 directional MyCiTi bus trips were found to be generated on weekdays, and approximately 2 400 bus trips per day on either Saturdays or Sundays, which corresponds correctly with the MyCiTi timetables. For the purposes of this study, several of the simulated bus trips were scrutinised in detail to determine the efficacy of ABM outputs. It was found that in all cases the bus trips were simulated realistically, and it was possible to derive actionable supply usage intelligence, which could be used to make informed supply management decisions.
Based on the simulation outputs discussed in this section, it can be concluded that this study has achieved its objective of demonstrating that MyCiTi transactional data can be further analysed using ABM to quantify MyCiTi supply usage. Firstly, the tool reflects inherent AFC data correctly in terms of the following:
1. A system demand overview
2. Total scheduled bus trips within the system
3. The scheduled times of all bus trips
4. The capacity of all bus trips.
Finally, the ABM simulation was able to fill the gaps in the AFC data in order to calculate useful system interaction data, namely: 1. The commuter boarding/alighting activity at all stops (including closed-stations)
2. The on-board demand on all bus trips
3. Detailed information on the path choices of all commuters within the system.
These output formats were chosen to demonstrate the efficacy of the tool, but are not necessarily the most useful insights to be gained from the model, with opportunities for analysing passenger transfer behaviour, waiting times and vehicle kilometres all being possible with further research.
VALIDATION OF ABM OUTPUTS
The assumptions within this model have been based as far as possible on real-world data, and parameters have been adjusted to reflect observations of actual system behaviour. To validate the outputs of the model developed in this study, (1) an on-board bus survey was conducted, and (2) path data for typical weekday commuter travel was obtained for further scrutiny. Even though the sample sizes used for validation are below recommended sample sizes, the presented results will provide a sufficient indication of model performance relative to real-world behaviour. Both surveys are discussed below after conceptually introducing statistical measures of error.
Measuring output error
In general, a model is performing well if the differences between the observed values and the model's estimated values are small and unbiased. Mean square error (MSE) and Root Mean Square Error (RMSE) are not used in this study as these measures have been found to exaggerate outliers (Swanson et al 2011). Mean Absolute Error (MAE) and Mean Absolute Percentage Error (MAPE) also tend to exaggerate potential errors if there are extreme differences in values (Swanson et al 2011). For this study, the Weighted Mean Absolute Error (WMAE) and Weighted Mean Absolute Percentage Error (WMAPE) are used to ratio the mean error according to its share of the sample size. This approach seems more reasonable as there are different bus types in the MyCiTi network with different maximum capacities. Furthermore, an ordinary regression analysis (producing an R-squared coefficient of determination) is used as an additional measure of output accuracy.
Variability in outputs and results
During the development of this tool, approximately 25 simulations were tested. Once it was visually ascertained that the simulations were behaving reasonably, the results of the tool were extracted for detailed comparison with actual survey data. During the design and implementation of this ABM, it became evident that there was a high degree of variability in the results based on the assumptions made regarding walking penalties, network speeds, agent departure times, and vehicle capacities. The variability in outputs illustrates the difficulty in preparing a subjectively realistic simulation of the MyCiTi. Once a decision is made in terms of the aforementioned input parameters, the results of the simulation do not change much after repetition, which is probably due to the tendency of agents to minimise their travel times (choose the shortest path).
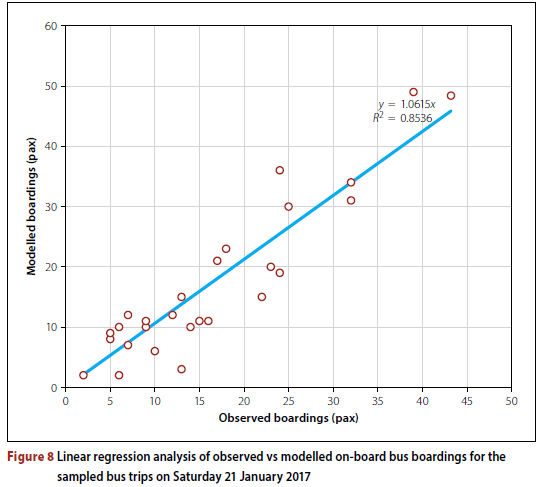
Validating on-board bus boarding estimates
Due to resource constraints such as surveyor availability, difficulties observing passengers during congested periods, and cost implications, it was not possible to conduct a comprehensive weekday demand survey. Rather, a sample of 28 MyCiTi bus trips (95% confidence level with a 20% confidence interval relative to the number of trips on a Saturday) was collected by the authors on Saturday 21 January 2017. This was done to demonstrate the models' ability to estimate on-board bus boarding volumes. The survey was conducted over 12 hours from 8 am to 8 pm. Passenger boardings and alightings were captured for each of the surveyed trips. A MATSim simulation for the same day, 21 January 2017, was then developed using AFC data, and the outputs were further analysed. The model made various estimations in terms of boardings, and these estimations were then compared to the actual boardings based on the validation survey. From this process, the following can be noted:
■ A comparison between observed and modelled results indicates that all the surveyed bus trips were successfully simulated by the model. The fact that the model is correctly predicting bus departures implies that the data-formatting algorithms used to simulate the MyCiTi bus schedule are functioning correctly.
■ A comparison between the observed and predicted on-board bus boardings reveals that the WMAE for the model is 4.7 passengers (17% WMAPE).
■ Scrutiny of the predicted passenger boardings versus modelled reveals that 26 out of the 28 trips (92%) possessed a WMAE of less than five passengers, which is deemed to be an acceptable error given the dynamic nature of the problem. Further tuning of input agent plans could further reduce this error.
■ A total of 518 boarding passengers was observed for the full sample, while a total of 546 boarding passengers was predicted. This is a difference of 28 passengers (5%).
■ Finally, linear regression analysis of trip boardings shows that there is a strong linear relationship (R2 = 0.85) between observed and estimated boardings, as can be seen in Figure 8.
Validating estimated agent paths
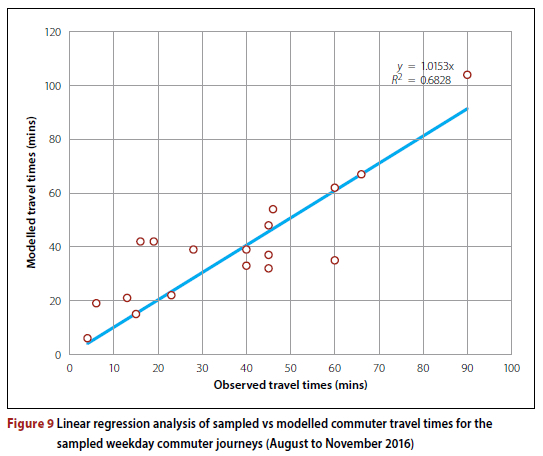
Additionally, due to resource constraints, it was not possible to collect a statistically representative sample of commuter paths (calculated to be at least 342 journeys). A very small sample (18 journeys as per Figure 9) was instead collected manually over the period August to November 2016 as a means to demonstrate the model's ability to estimate commuter path choices by comparing actual and estimated journey information.
Path data on commuter journeys was randomly collected by asking selected participants (colleagues, friends and family members of the authors) to capture their actual data on the routes that they use between destinations and the resultant travel times. Data was collected for typical peak period travel times (6 am - 9 am or 4 pm - 6 pm) on a typical weekday in order to be representative of congested travel behaviour. The journeys were then converted into agent plans data and input into a MATSim simulation for a typical weekday for comparison. The model made various estimations in terms of travel times and path choices. These estimations were then compared to the actual path and travel time observations. From this process, the following can be noted:
■ Scrutiny of the simulated paths revealed that all (100%) of the simulated agent path choices were reasonable (could be realistically chosen). However, only 11 out of the 18 journeys (61%) were found to be the same in terms of route choice and travel time based on visual inspection.
■ Analysis of travel times reveals that the WMAE in travel time for the model is nine minutes (WMAPE 25%).
■ Linear regression analysis of the travel times shows that there is a noteworthy linear relationship (R2 = 0.68) between observed and predicted travel time values, as can be seen in Figure 9.
■ Scrutiny of the predicted travel times reveals that 13 out of the 18 paths were simulated with reasonable travel time error (less than ten minutes), while the remaining five paths possessed travel times of more than 15 minutes, which indicates that there may be additional factors that need to be considered to improve the accuracy of travel time modelling.
Based on the above, it can be seen that multiple indicators were used to provide a sense of model accuracy (WMAE, WMAPE, R-squared, and visual scrutiny of individual model estimates). There are no clear rules for determining the acceptability of WMAE or WMAPE. The above findings reveal that WMAE and WMAPE increase as the focus is shifted towards the modelling of individual path choices. There are several factors which can influence a simulated path (e.g. commuter departure times, bus departure times, bus route alternatives, and more) and, therefore, higher WMAE and WMAPE can be expected. Of the various indicators considered, perhaps the strongest evidence of good model accuracy is the strong linear relationship between observed and estimated on-board bus boardings (R2 = 0.85).
While the tool appears to be making reasonable estimates for on-board bus boarding volumes, further research is required to reduce the degree of error in agent travel times and path choices. Experience gained during scenario preparation and parameter adjustments revealed that these estimations are mostly sensitive to assumptions made in the road network design (lane capacity and speed assumptions). Further research is necessary to fine-tune network travel time characteristics in the hope of improving model accuracy.
CONCLUSIONS
At the beginning of this study, several important objectives were identified. It is believed that this study has successfully achieved these objectives and has helped to pave a way forward for the use of ABM in MyCiTi supply management.
Evaluation of MyCiTi supply usage reveals that approximately 30% of total seats provided on a daily basis (weekdays) are occupied. While additional research is required to determine what a practically obtainable supply usage percentage might be for the transit service, it is clear that there is significant room to improve the efficiency of MyCiTi supply usage.
This study illustrates the real-world applications of a Big Data and ABM approach for modelling public transit operations. Big Data was identified as an area of opportunity, while ABM is the key to unlocking Big Data's potential. ABM uses a bottom-up approach by modelling the individual components of complex systems to achieve understanding. The MyCiTi possesses both smartcard data and planned bus schedules, which can be broken down into smaller components and made to interact within an ABM. The validation results show that there is a strong relationship between model estimates and actual observed values for on-board bus boardings (R2 = 0.85) and therefore provides strong support for the applicability of ABM theory for estimating MyCiTi supply usage.
This study has also categorically demonstrated the necessary steps required to analyse MyCiTi Big Data systems via ABM. Analysis of both the simulated events and agent plans output data, as generated by MATSim, has shown that ABM can calculate realistic commuter path choices based on target input data (which includes inferring transfer locations when AFC data is unavailable). Furthermore, it has been shown that MATSim outputs can be reformatted into on-board bus graphs, which have been identified as a key data requirement for MyCiTi planners. Based on these results, it can be concluded that this study has successfully achieved its objective of demonstrating that Big Data and ABM can be used to quantify MyCiTi supply usage.
Detailed analysis of MATSim outputs reveals that bus on-board data provides significant insights into revealed MyCiTi usage. The on-board bus demand plots provide very specific, personalised information on a trip-by-trip basis, which can help to inform the implementation of supply-focused measures.
Linear regression analysis showed that there were no significant outliers in both travel time and boarding estimations, which implies that the ABM theory is reasonably approximating agent travel plans. Further research is required to understand the degree of variability in outputs, but this is beyond the scope of this study.
Detailed scrutiny of the results shows that model estimations are generally reasonable, and it would therefore be possible to draw reasonable conclusions about MyCiTi supply usage. Ultimately, model estimations should be treated with care, and further research is required to improve the reliability of model estimations. At this point, however, it can be concluded that ABM displays a strong potential to quantify MyCiTi supply usage.
RECOMMENDATIONS
One of the shortcomings of this paper is that a single simulation result was compared to a single observed day. It is recommended that more comprehensive testing and validation data should be used in future research.
Additionally, most tools allow for a random seed to be set to ensure reproducibility while accounting for noise and discrepancies within the input data. This is a significant shortcoming of this research topic. The aspect of randomness should be further unpacked in future studies.
It is recommended that further research be conducted into reducing the degree of error in agent travel times. The calibration has revealed that these estimations are sensitive to the calibration of network travel time characteristics. Further research is therefore necessary to fine-tune network travel time characteristics in the hopes of improving model path estimations.
This study can serve as a strong platform for future research into using Big Data and ABM to solve complex transport problems. In this study, output data was only used for validation purposes; however, it is believed that model outputs can serve a much greater purpose in terms of gaining a deeper understanding of the factors impacting supply usage. Future studies could focus on diving even deeper into the outputs to identify exactly when, where and how commuters came to be on a specific bus trip. Additionally, we could use this information to get a better understanding of the impact of public transport services on passenger path choices with a view to optimising public transport services to be more accommodating to all users.
REFERENCES
Abbas, M & Machiani, S G 2016. Agent-based modeling and simulation of connected corridors-merits evaluation and future steps. International Journal of Transportation, 4(1): 71-84. [ Links ]
Buehler, R & Pucher, J 2011. Making public transport financially sustainable. Transport Policy, 18(1): 126-138. [ Links ]
Chen, S H 2017. Agent-based modelling as a foundation of big data. Journal of Economic Methodology, 24(4): 362-383. [ Links ]
Chu, X 2004. Ridership models at stop level. Chipley, FL: State of Florida Department of Transportation. [ Links ]
Chu, X, Polzin, S E, Siddiqui, N A, Pendyala, R & Ubaka, I 2007. Framework of modeling and forecasting stop-level transit patronage. Proceedings, Transportation Research Board 86th Annual Meeting, Compendium of Papers (CD-ROM), 07-1632. [ Links ]
City of Cape Town 2019. MyCiTi. Available at: https://www.myciti.org.za/en/discover-myciti/the-business-of-myciti (accessed on 10 October 2019). [ Links ]
Fourie, P J, Erath, A, Ordonez, S A & Chakirov, A 2016. Using smartcard data for agent-based transport simulation. Singapore: Future Cities Laboratory. [ Links ]
Goelst, W 2016. MyCiTi Bus practical capacities. Cape Town: TDA Cape Town. [ Links ]
Grey, P 2015. Focus Area 1: MyCiTi moderation exercise - towards sustainability. Cape Town: TCT Business Development. [ Links ]
Horni, A, Nagel, K & Axhausen, K W 2016. The Multi-Agent Transport Simulation MATSim. 2016 ed. London: Ubiquity Press. [ Links ]
International Transport Forum 2015. Big data and transport: Understanding and assessing options. International Transport Forum Policy Paper No 8. DOI: 10.1787/24108871. [ Links ]
Jeffcock, P 2013. Big data analytics: Advanced analytics in Oracle Database. Redwood Shores, CA: Oracle. [ Links ]
Jennings, N 2000. On agent-based software engineering. Artificial Intelligence, 117(2): 277-296. [ Links ]
Joubert, J W, Fourie, P J & Axhausen, K W 2010. Large-scale agent-based combined traffic simulation of private cars and commercial vehicles. Transportation Research Record, 2168(1): 24-32. [ Links ]
Neumann, A, Roder, D & Joubert, J W 2015. Towards a simulation of minibuses in South Africa. Journal of Transport and Land Use, 8(1): 137-154. [ Links ]
Nnene, O, Joubert, J & Zuidgeest, M H P 2019a. An agent-based evaluation of transit network design. Procedia Computer Science, 151(2019): 757-762. [ Links ]
Nnene, O, Joubert, J & Zuidgeest, M H P 2019b. Transit network design with meta-heuristic algorithms and agent-based simulation. IFAC-Papers Online, 52(3): 13-18. [ Links ]
Python Software Foundation 2016. What is Python? Executive summary. Available at: https://www.python.org/doc/essays/blurb (accessed on 9 October 2019). [ Links ]
Sang Hyung, A, Hislop-Lynch, S R, Kim, J & Zhu, R 2017. Agent-based simulation modeling of a Bus Rapid Transit (BRT) station using smart card data. St Lucia, Queensland, Australia: University of Queensland, School of Civil Engineering. [ Links ]
Swanson, D A, Tayman, J & Bryan, T M 2011. MAPE-R: A rescaled measure of accuracy for subnational population forecasts. Journal of Population Research, 28(2-3): 225-243. [ Links ]
US Department of Transportation 2013. A primer for agent-based simulation and modeling in transportation applications. Georgetown Pike. Washington, DC: US Department of Transportation. [ Links ]
Yap, M & Munizaga, M 2018. Workshop 8 report: Big data in the digital age and how it can benefit public transport users. Research in Transport Economics, 69: 615-620. [ Links ]
Ziemke, D, Kaddoura, I & Nagel, K 2019. The MATSim Open Berlin Scenario: A multimodal agent-based transport simulation scenario based on synthetic demand modeling and open data. Procedia Computer Science, 151: 870-877. [ Links ]
 Correspondence:
Darren Willenberg
Altenar Ltd, Pendergardens Business Centre
Triq Sant'And rija San Giljan, STJ 9023, Malta
T: +356 278 76123, E: darren.willenberg@altenar.com
Mark Zuidgeest
Centre for Transport Studies, Department of Civil Engineering
Private Bag X3, Rondebosch 7701, South Africa
T: +27 21 650 4756, E: mark.zuidgeest@uct.zac.za
Edward Beukes
Transport Global Practice, World Bank
442 Rodericks Road, Lynnwood, Pretoria 0081, South Africa
T: +27 12 742 3123, E: ebeukes@worldbank.org

DARREN WILLENBERG, who has an MSc in Civil Engineering, is a Senior Data Analyst working on Big Data analytics projects for the Altenar intelligence Platform in Malta. He has more than ten years of experience in the transport sector working for both Amazon and the City of Cape Town local municipality. He has worked on projects involving transport network analytics and data management, transit ridership forecasting, graph network optimisation, and transport infrastructure design and placement. His fields of interest include scalable data streaming architectures, real-time analytics, and machine learning.

PROF MARK ZUIDGEEST (Pr Eng), who is a member of the South African institution of Civil Engineering, is the SANRAL Chair of Transportation Planning and Engineering at the University of Cape Town. He graduated with an MSc (Civil Engineering) from the University of Twente, The Netherlands, in 1997, and a PhD from the Netherlands Research School for Transport, infrastructure and Logistics (TRAiL) in 2005. His fields of interest include land use - transport systems analysis, with an emphasis on questions around sustainability, equity and accessibility.

DR EDWARD BEUKES is a Senior Transport Specialist in the Transport Global Practice at the World Bank. He has been working in the transport sector across Southern Africa for more than 20 years on projects covering urban transport, rural roads and freeways, public transport, freight, railways, maritime, and transport policy - operating in private practice, academia and the public sector. He obtained undergraduate and Master's degrees in Engineering, an MBA, and a PhD in Transport Planning.

