


Services on Demand
Article
 English (pdf)
 Article in xml format
 Article references
Indicators

Related links
-
 Cited by Google
 -
 Similars in Google
Share

 Permalink
Journal of the South African Institution of Civil Engineering
On-line version ISSN 2309-8775
Print version ISSN 1021-2019
J. S. Afr. Inst. Civ. Eng. vol.64 n.3 Midrand Sep. 2022
http://dx.doi.org/10.17159/2309-8775/2022/v64n3a3
TECHNICAL PAPER
A stochastic, daily time-step model for conjunctive water use at local authority level
J A du Plessis; E G Braune
ABSTRACT
South Africa has a broadly developed water resource infrastructure, based mainly on surface water, localised groundwater, and limited desalination. The Department of Water and Sanitation projects that increasing requirements will exceed the capacity of the country's bulk water supply systems by 2025. To mitigate water scarcity at a local authority level, more conjunctive water use solutions need to be investigated. A Microsoft Excel 2016 model, estimating supply capacity on a daily basis, was developed for local authorities to better manage their water supply systems.
The model utilises synthetically generated stochastic streamflow sequences, based on historical data. Monthly streamflow is disaggregated into daily streamflow and a rainfall-runoff relationship is established to produce synthetic rainfall sequences. Groundwater is modelled using an approach similar to the Aquifer Firm Yield Model. Recharge percentages (rainfall data) are obtained from the Groundwater Resource Assessment Phase 2 project. The Cooper-Jacob model evaluates borehole drawdowns and their effect on surrounding boreholes. Desalination and water reclamation are modelled as one source. The model evaluates and compares the historical, as well as stochastic available yield of a conjunctive use water supply system, for different operational scenarios. The water supply system of Stellenbosch was used as a case study to illustrate the model's functionality.
Keywords: water resource management, conjunctive use, stochastic streamflow modelling, daily disaggregation, reliability of supply
INTRODUCTION
The need for water, especially in arid and semi-arid regions, necessitates integration of conventional and supplementary water resources to meet the growing demand. According to the National Water Resource Strategy (DWA 2013), South Africa is the 30th driest country in the world, with a countrywide average rainfall of 450 mm/a compared to the average rainfall of 990 mm/a worldwide. The Western Cape Province in South Africa experienced a severe drought from 2014, reaching its peak in 2017, triggering a water crisis for the City of Cape Town and surrounding local authorities. According to Wolski (2018), an analysis on long-term SAWS (South African Weather Service) rainfall data showed that the period from 2015 leading up to 2017, as well as the year 2017 itself, was the driest since 1933. Additionally, there were delays in implementing new augmentation schemes, due to the successful implementation of the Water Conservation and Water Demand Management (WC/WDM) strategy and above average rainfall during the previous years (Muller 2017). During the water crisis, a need arose to implement water restrictions, tariff increases and emergency water demand management schemes to avert a possible "Day Zero" on which the City of Cape Town and surrounds could possibly be without water.
Surface water resources account for 77% of the country's bulk water supply. However, the development of new surface water storage sites are mostly not economically viable (SANCOLD 2019) and surface water is highly climate sensitive. Alternatively, less climate susceptible water resources such as groundwater and desalination should be utilised.
To aid the Department of Water and Sanitation (DWS), as well as several bulk water supply institutions (Umgeni Water, City of Cape Town, Inkomati and Usuthu) in optimising and managing water systems, contracts are set up under the DWS for qualified consultants to establish and run the Water Resource Yield Model (WRYM) for the required system. The WRYM is a monthly bulk river-reservoir system model for optimisation of the yield of the system and/or individual reservoirs. It includes a utility for stochastic analysis of river-reservoir systems (Nkwonta et al 2017). This model is suitable for national and regional water management, but it is too complex for most local municipalities to apply. Therefore, an accessible, inexpensive, and user-friendly water resource management tool for application at local authority/ municipality level has been developed.
Both consumer demand and rainfall vary on a daily basis, while many local authorities only have access to within-year storage facilities; thus, monthly time-step models are not entirely suitable for daily management strategies. It has therefore become necessary for local municipalities to implement strategies based on daily time-step yields. This research aims to address the daily water resource modelling challenges facing local municipalities when implementing supplementary or conjunctive water use.
Conjunctive use refers to the coordinated and simultaneous use of various water resources to manage the long-term sustainable quantity and quality of water supply. International examples of successful implementation of conjunctive use include:
■ The conjunctive use of groundwater, surface water and direct reuse in Windhoek, Namibia, which is mainly implemented through artificial recharge
■ The conjunctive use of groundwater and surface water in Israel implemented through various integrated systems (Braune 2016)
■ The conjunctive use of desalination, surface water and groundwater in Perth (Zeng et al 2021; Braune 2016; Israel & Braune 2021).
Numerous international studies exist where the conjunctive modelling of water resources has been piloted. In this research the focus is on piloting a conjunctive use model in the South African context.
METHODOLOGY
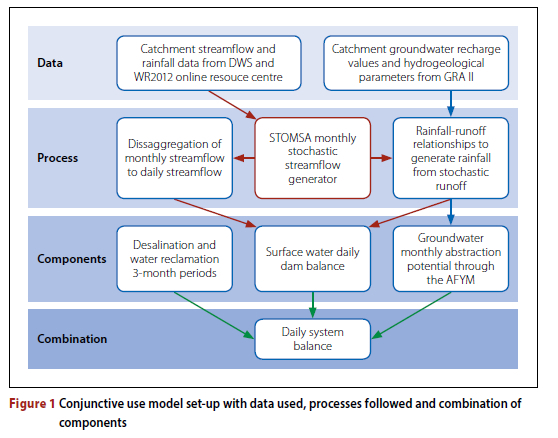
The conjunctive use model is based on a water supply system which combines yields from surface water, groundwater, desalination and/or reclaimed water resources. The model can be used to simulate the availability of supply on a daily basis, during different hypothetical scenarios. Thus, the data relevant to each water resource is converted to daily time-steps for computational use in Microsoft Excel. The model determines the combined conjunctive system yield using the conventional dam balance equation, in which the inflows from the different components are balanced against the demand. The layout of a typical model comprises surface water that enters a storage dam, while desalinated and/or reclaimed water, as well as groundwater, enter the supply system directly without storage to prevent evaporation and dam losses.
Relevant data sets for each water resource component were obtained to perform a system balance. Input data sets to the model include hydrological data for quaternary catchment streamflow, rainfall, hydro-geological parameters of aquifers and their recharge values, as well as municipal storage capacities and water demand. Figure 1 outlines the steps followed for assessing the yield of a conjunctive use system.
Data
In South Africa, the DWS maintains an online database where various hydrological and hydrogeological data sets are made available for different sites across South Africa. Daily and monthly streamflow data of surface water resources (rivers and streams), as well as evaporation data, is obtainable through the DWS website (DWS 2022). Water Resources 2012 (WR2012) is an online resource centre (Bailey et al 2012), separate from the DWS website, where monthly rainfall data, as well as patched and/or simulated monthly runoff data, is made available for South Africa. Naturalised monthly streamflow data obtained from this platform is simulated by using the Water Resources System Model (WRSM2000), which is a deterministic rainfall-runoff model (Bailey et al 2012).
Groundwater data, such as aquifer parameters and recharge, is available from the DWS through the Groundwater Resource Assessment Project Phase 2 (GRA II), completed in 2003 (DWS 2020). The aims of the GRA II were to quantify groundwater available for use, to produce a series of "planning potential" maps, to quantify recharge, and to investigate the interaction between groundwater and surface water. Furthermore, as part of the GRA II study, aquifer classification, as well as existing groundwater utilisation throughout South Africa, was mapped and estimated. GRA II relies heavily on historical data gathered over three decades.
Processes
Stochastic Model of South Africa (STOMSA)
A stochastic sequence can be defined as a sequence that is based on random variations of the historical sequence, while retaining the deterministic historical characteristics of the historical sequence (Basson et al 1994). In other words, stochastic sequences propose a variety of alternative scenarios to the historical streamflow sequence. STOMSA is a monthly, multi-site, stochastic model that generates monthly stochastic sequences. STOMSA uses pseudo-random variables together with historical statistics to generate stochastic flow sequences that are simultaneously realistic and varied in nature while maintaining marginal-, serial- and cross-correlation of the historical sequences. Annual stochastic sequences are generated, after which they are disaggregated into monthly flows by applying the monthly distribution of a historical year that matches the generated sequence with the smallest difference by using a least-square fit-analysis (Van Rooyen & McKenzie 2004). The naturalised monthly streamflow data obtained from the WR2012 resource centre is the historical sequence used as input to STOMSA. The research presented here accepts STOMSA as a suitable tool for its purpose and it was used to generate 101 plausible stochastic sequences to provide variability, based on the historical sequence.
Daily disaggregation
Streamflow (inflow into dams or water supply systems) varies on a daily basis between high flows and low flows, depending mainly on rainfall intensity, frequency, and the rainfall-runoff response of a catchment (Critchley et al 1991). Therefore, using monthly streamflow averages, conventionally used in a yield analysis, can overestimate the inflow available on a daily time-step, specifically for smaller catchments. A daily yield analysis provides more accurate yields, which is especially necessary for small local authorities with typically only one storage dam, frequently situated off-channel (Acharya & Ryu 2014).
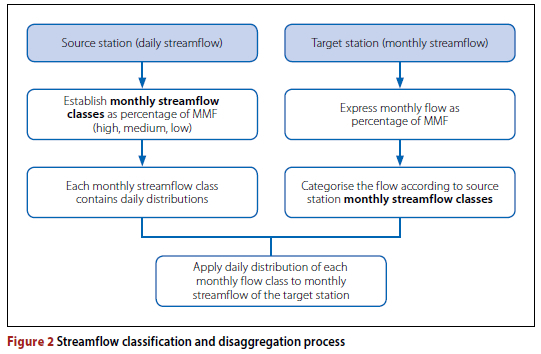
To perform a daily dam balance, the monthly stochastic streamflow sequences generated by STOMSA have to be disaggregated into daily stochastic streamflow sequences. Instead of using a three-month window of data to assess the variance in daily streamflow distributions to provide for seasonality, as suggested by Acharaya and Ryu (2014), a streamflow classification system suggested by Hoffman (2019) was adopted as illustrated in Figure 2. Historical daily streamflow sequences representative of the site under evaluation were categorised into three streamflow classes (high-, medium- and low-flow scenarios) for each month of the year. The monthly streamflow classes were expressed as a percentage of mean monthly flow (MMF). A representative daily distribution was visually selected from each monthly flow class by choosing a daily distribution that appeared predominant regarding the number and multitude of flow peaks as well as the magnitude of the low flows. The stochastic monthly streamflow values generated by STOMSA were then categorised into the high-, medium- and low-flow scenarios as derived from the historical sequence, after which they were disaggregated according to the selected daily streamflow distribution. This can be applied to disaggregate historical and stochastic streamflow for any target station within a catchment with homogenous rainfall/runoff characteristics. Streamflow classification and disaggregation were performed in a pre-programmed Microsoft Excel workbook, and the user is only required to select the predominant daily distribution in each monthly streamflow class.
Rainfall-runoff relationships
Amongst several components that form part of the water cycle, rainfall has a significant impact on both surface water availability (rainfall, evaporation, runoff) and ground-water availability (rainfall, evaporation, recharge). In other words, rainfall is used as input to both surface water and groundwater models, and can be a useful link between surface water modelling and groundwater modelling that represent the stochastic nature of hydrological processes (Xu & Beekman 2003; Xu & Beekman 2019; Murray et al 2012b). However, the stochastic model used, STOMSA, generates stochastic streamflow sequences and not rainfall sequences; thus, a rainfall-runoff relationship has to be established to convert stochastic streamflow into stochastic rainfall. A linear relationship was assumed between monthly runoff and monthly rainfall, which is a simplification and should not be applied to rainfall-runoff models; however, for the purpose of a water balance simulation model this linear historical relationship suffices. This relationship was established by deriving a monthly ratio from the historical rainfall within a specific month and the historical streamflow corresponding to the specific month for the catchment of interest, thereby conserving both the temporal and the spatial characteristics impacting the rainfall-runoff relationship in the specific catchment. This monthly rainfall-runoff ratio was then applied to the stochastic monthly streamflow sequence to generate a stochastic monthly rainfall sequence. Both the rainfall and the runoff data for a particular catchment was retrieved from the WR2012 database.
When diverting water from a stream, the rainfall-runoff response of the catchment, expressed through discharge hydrographs, plays an important role in the diversion efficiency. Depending on the storm intensity, temporal streamflow storage in the river and the catchment characteristics, flooding events can cause steep hydrographs. Although the average streamflow can be diverted by the diversion infrastructure at almost 100% efficiency, high-flow events cause spillage which is lost for diversion purposes.
Conjunctive use model components
Surface water-dam balance
To determine the yield of surface water reservoirs, the storage behaviour is simulated by establishing relationships between inflow (from a river or stream), reservoir capacity, demand, net evaporation (difference between direct rainfall and evaporation), seepage and spillage (Waldron & Archfield 2006). The abovementioned components can be assessed separately, after which their values are used in a dam balancing equation (Equation 1) for each time step:
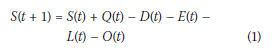
Where:
The daily streamflow sequences (historical and stochastic) were used as inflow to the dam, while the daily rainfall sequences were used as input to determine net evaporation. The capacity of diversion structures and/or the water conveyance structures can be limiting capacities to the inflow from rivers or streams and were considered within this conjunctive use model.
Groundwater-stochastic yield
Hydrogeologists traditionally use borehole pumping tests to determine both the sustainable yield and the hydrogeological characteristics of a particular borehole. The type of pump test and the extent thereof are chosen based on the planned utilisation of the borehole (Van Tonder et al 2002). Parameters such as pump rate, transmis-sivity, storativity (ability to store water), sustainable yield and maximum allowable drawdown are established during pump tests that generally last for a short period of time (24 to 72 hours). These tests only focus on a single time-invariant scenario; hence, the assessed sustainable yield of a borehole is not always assured in drought conditions or when boreholes are subjected to over-utilisation (Murray et al 2012a). According to Gelhar (1993), groundwater availability not only varies with varying geological characteristics, but also over time. Therefore, groundwater available for abstraction estimated at a single time consideration, is not deemed sustainable over long time periods. Gelhar (1993) further states that water level responses of aquifer systems follow natural recharge events dependent on precipitation. Therefore, a once-off abstraction estimate is not deemed dynamic enough to determine sustainabil-ity over long periods of time.
Murray et al (2012a) consider timeinvariant yield estimations, using average inputs and outputs (mean annual recharge and evapotranspiration, etc) to be unreliable, especially in arid regions where rainfall patterns largely determine groundwater yield.
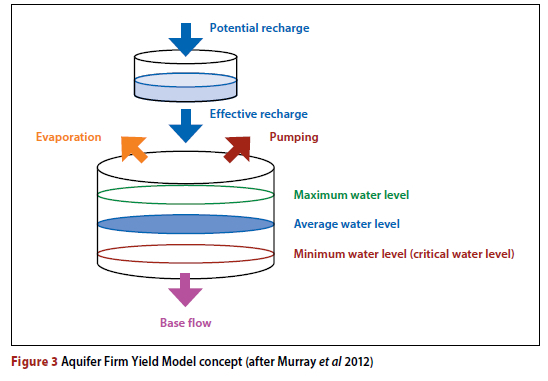
Recharge is defined as water that increases the level of the water table through vertical infiltration and lateral flow (Xu & Beekman 2019). Numerous physical and chemical methods exist to estimate recharge volumes. Of those the Chlorine Mass Balance (CMB) and the Saturated Volume Fluctuation (SVF) methods are well adapted for shallow unconfined aquifers (Xu & Beekman 2019). The Aquifer Firm Yield Model (AFYM) was developed to provide hydrologists and engineers with tools to identify, assess and quantify groundwater that is suitable for municipal supplies (Murray et al 2012b). The aim of the AFYM undertaking was to develop generic methodologies to assess groundwater yields, similar to those used in surface water yield assessments, for shallow, unconfined or fractured aquifers, by incorporating both static and time-variant data sets.
The AFYM is a single-celled, lumped-parameter box model (Figure 3), incorporating hydrogeological and stochastic parameters, such as rainfall, as well as physical groundwater laws, such as specific yield and hydrogeological properties. A single-celled box model refers to the conceptual model of aquifer systems, in the sense that it is represented as a single element which is connected to adjacent elements through inflow and outflow parameters.
Aquifer volumes cannot be established without rigorous numerical modelling; therefore, to conceptually model ground-water storage, a water level management system was adopted to represent storage volume and available yield within an aquifer. The critical water level defines the volume of water held in an aquifer as storage, which is similar to a surface water reservoir, with the exception that the exact volume of a surface water reservoir can be more readily established. Abstraction can only be sustainable if the volume of abstraction does not exceed annual recharge, thereby preventing impacts to the water table that might result in violations of water rights or damage to the environment or ecosystems (Murray et al 2012a).
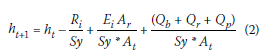
To transform time series rainfall values into time series water level information, various inflow and outflow values are considered and the SVF equation (Equation 2) is adapted as presented by Murray et al (2012a).
Where:
ht+1 = end water level (mbgl/month)
ht = starting water level (mbgl/month)
Sy = specific yield (%)
Ri = GRA II recharge percentage of MAP (m/month)
Ei = evapotranspiration (m/month)
Ar = area of riparian zone (m2)
At = area of aquifer (m2)
Qb = baseflow rate in month (m3/month)
Qr = potential recharge in month (m3/month)
Qp = pumping abstraction rate per month (m3/month).
The principles of the AFYM, used to determine the long-term potential monthly abstraction rate from an aquifer at quaternary catchment scale, were incorporated in the groundwater component of the conjunctive use model. The stochastic monthly recharge of the aquifer was calculated by multiplying the stochastic monthly rainfall with the GRA II recharge percentage (%MAP). After determining the monthly long-term abstraction rate, its value was distributed equally over the number of days in a month to render it compatible with the surface water daily time-step. To determine the long-term potentially available abstraction rate, in other words abstraction at a rate that does not damage the ecosystem associated with the aquifer, the aquifer system was modelled at its natural equilibrium, after which a stressed aquifer system was simulated by introducing abstraction. The aim of this modelling procedure was to quantify the amount of water available for abstraction from the potential recharge (%MAP) and baseflow on a quaternary catchment basis.
Desalination and water reclamation
Coastal towns in arid regions of South Africa, with limited access to surface water and/or groundwater can readily make use of seawater desalination, as it can supply a large amount of high-quality, fully assured, potable water at a predictable price (DWS 2018).
In South Africa most seawater desalination plants were developed as emergency drought relief; in other words as short-term augmentation options to address supply shortages. A study by Blersch and Du Plessis (2017), where a desalination plant was simulated as a constant inflow channel, using both the Water Resource Yield Model (WRYM) and Water Resource Planning Model (WRPM), concluded that the most cost-effective way to incorporate a desalination plant into an existing water supply system was to use it on a fully operational level on a continuous basis, thereby providing a base supply. Membrane technology is expensive and was found to deteriorate when the desalination plant is not in use for extended periods. The main drawbacks of implementing desalination are the high usage of electricity, which constitutes approximately 50% of the total operational and maintenance costs (Turner et al 2015) and the disposal of brine. However, as innovation regarding desalination plants such as the eThekwini Municipality Remix Plant (Masha 2019) emerge, these drawbacks can be bridged.
The reuse of water through water reclamation results in benefits for the environment, as it protects aquatic ecosystems (wetlands and coastlines) from impacts related to over-abstraction, degradation, and wastewater (effluent) discharge (Turner et al 2015). Numerous examples of small water reuse schemes in South Africa exist, but these are generally implemented as an emergency measure during severe drought, rather than incorporated as an integral part of the water supply system (Gorelick & Serjak 2018). Desalination and water reclamation processes use similar technologies and components, thus they are modelled in a similar fashion, as a constant inflow stream into the conjunctive use system. To maintain a base supply of these resources for economic viability, a minimum operational period of three months is suggested, while it is recommended that the user utilises this water resource 100% of the time.
Conjunctive model
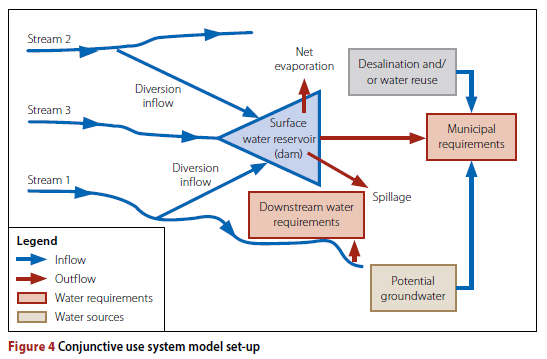
Water resources can be utilised in various approaches. The augmentation approach is frequently applied in emergency situations, where one resource is exploited after which another water resource is added to the system until exploited, and so on. Contrary to this is a simultaneous use of different water resources, i.e. conjunctive use. In this approach several resources, with different climate-response characteristics, are combined and utilised simultaneously to meet the water demand. The conjunctive use may provide a more sustainable supply of water, as the different characteristics of the various resources can be exploited without allowing a single resource to fail. Water resources such as desalination and water reuse are mostly climate independent, while climate conditions have immediate impact on other resources such as rivers, and a delayed impact on groundwater. The aim of the conjunctive use system is for municipalities to become less dependent on only one type of water resource and to simultaneously manage all available resources to obtain a reliable and/or sustainable supply.
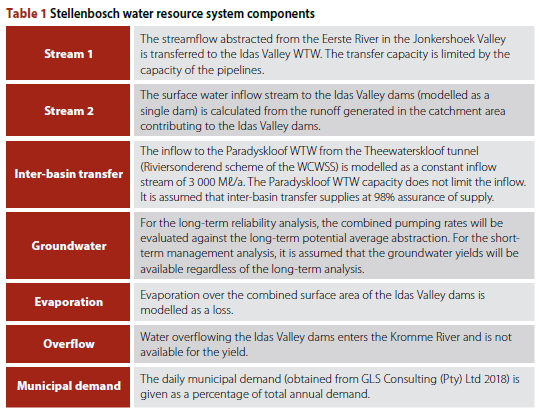
The conjunctive use system is illustrated in Figure 4. Provision was made in the model for three inflow streams entering a single dam, which can also be a combination of multiple dams. Stream 1 and Stream 2 enter via diversion infrastructure, where the user can select different diversion infrastructure capacities and efficiencies, while Stream 3 enters directly into the dam. Stream 1 is governed by downstream water requirements (environmental releases, agricultural allocations, etc) which are user-defined and not stochastically generated. Further inflows (desalination and/or water reuse, as well as groundwater) were modelled as entering the treatment and distribution system directly. Outflows of the water supply system were modelled as spillage and evaporation from the dam and ultimately the municipal requirements from the conjunctive yield of all the resources combined.
The historical firm yield of the conjunctive use system is calculated by simulating a reservoir at full supply capacity and using the longest available historical sequence as input data. According to Basson et al (1994), to reach reasonable convergence in the firm yield for a long-term yield analysis, at least 41 stochastic sequences of a length of more than 64 years are required. Furthermore, the long-term yield analysis should start with the reservoir at full supply capacity and the stochastic sequences should be evaluated for a number of different target drafts. Basson et al (1994) suggest that at least five times more stochastic sequences are used for a short-term analysis, but they can be generated for a minimum length of five years. For a short-term analysis, one target draft is evaluated for different reservoir starting capacities. As the available STOMSA generates 101 sequences, the short-term analysis in this research used 101 sequences, but with a length of ten years.
User interface
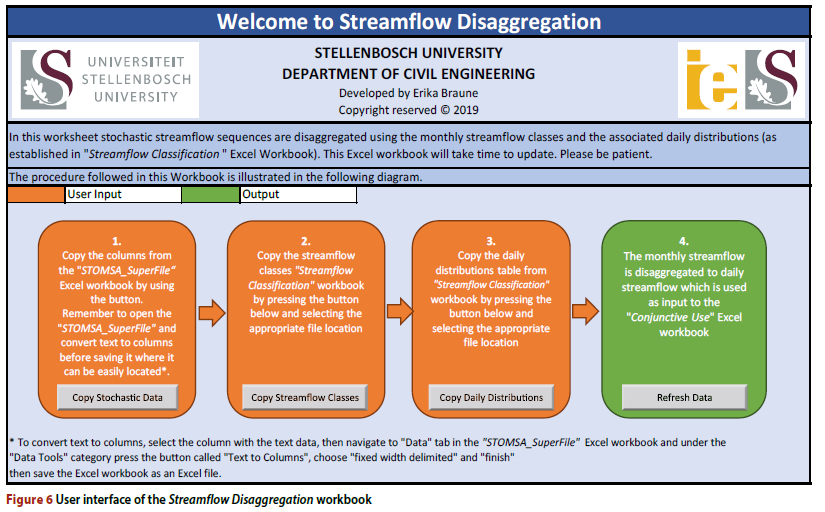
The conjunctive use model consists of four Microsoft Excel workbooks, namely: Streamflow Classification, Streamflow Disaggregation, Groundwater Simulation and Conjunctive System Simulation. The model components are illustrated in Figure 5.
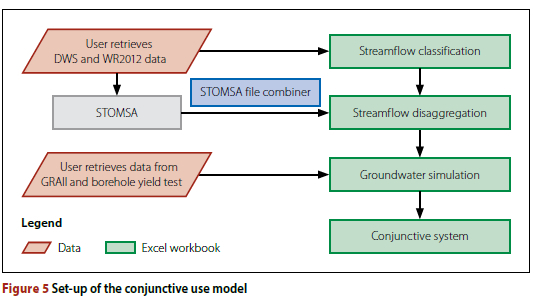
The user interface of each Excel book is set up with simple instructions and Visual Basic buttons to guide the user through the Excel workbook. Online data platforms are referenced, and the data can be copied into the respective workbooks as instructed. The user interface of the Streamflow Disaggregation workbook is presented in Figure 6 for illustrative purpose only.
Case study
Stellenbosch overview
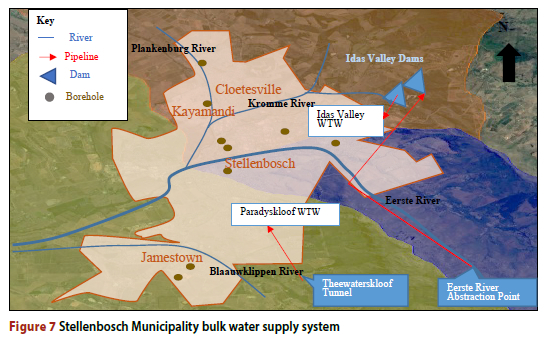
A case study on the water supply system of the Stellenbosch Municipality is presented to illustrate the application of the conjunctive use model. A yield analysis was performed on the current water resources in the bulk water supply network, as well as the anticipated potential expansion thereof, thereby assisting the municipality in long-term planning and short-term decision-making. While every effort was made to model a realistic situation, the main objective was to demonstrate the functionalities of the model, and in doing so a number of assumptions were made to simplify explanations, as discussed in the following paragraphs.
Urban water users of Stellenbosch are supplied with purified water from the Idas Valley and the Paradyskloof Water Treatment Works (WTW). The raw water supplied to the respective WTWs is sourced from the Eerste River, and also from the Western Cape Water Supply System (WCWSS) which transfers water through the Theewaterskloof tunnel system (GLS Consulting (Pty) Ltd 2018). The town of Stellenbosch also has access to a number of boreholes, some of which were developed as augmentation water resources as part of the emergency drought intervention scheme for the period between 2014 and 2017 (GEOSS (Pty) Ltd 2018). A simplified layout of the bulk water supply system of Stellenbosch is illustrated in Figure 7, adapted from the Drought Intervention Planning Report (GLS Consulting (Pty) Ltd 2018).
The conjunctive use system was modelled according to the diagram in Figure 4. The components are briefly summarised in Table 1.
Modelling the input parameters
Daily streamflow data from the DWS and naturalised monthly streamflow data from the WR2012 was retrieved. The GRA II recharge as percentage of rainfall was retrieved from the DWS database. This data was fed into the respective Excel workbooks and the STOMSA program.
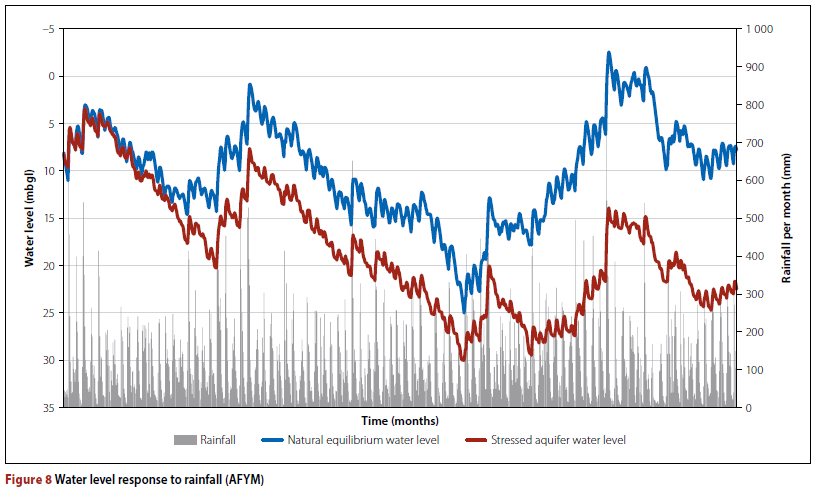
Naturalised streamflow was fed into STOMSA. The resulting stochastic monthly streamflow sequences, as well as the monthly rainfall-runoff ratios, became inputs to the groundwater Excel workbook, in which principles of the AFYM and the SVF equation were applied. The groundwater simulation for stochastic sequence number 1 produces a time series graph (Figure 8), which shows the water level fluctuations corresponding to rainfall events (blue lines) over the 90-year time period. To determine the long-term potential sustainable abstraction volume per month for each of the 101 stochastic sequences, a system balance was performed for each monthly time-step. Thereafter an iterative process was followed by increasing or decreasing the monthly groundwater abstraction, such that the simulated abstraction imposed on the aquifer (red line) from an aquifer in equilibrium (blue line) does not exceed the maximum allowable water depth (metres below ground level). In the AFYM a maximum allowable water level drawdown of five metres below the average water level fluctuation is specified as failure criterion. This was done to compare the results of the AFYM with the Average Groundwater Exploitation Potential values obtained as part of the GRA II study (Murray et al 2012b). This follows the adaption of the AFYM and was repeated for every stochastic sequence.
The potential long-term sustainable monthly abstraction rates for the 101 stochastic sequences became inputs into the Excel workbook, programmed for the conjunctive use system water balance. The monthly abstraction volume was divided equally over the number of days in a month.
The surface water components (discussed in Table 1) and the disaggregated daily stochastic streamflow (discussed under the heading Daily disaggregation on page 22) were used as input to the conjunctive use system balance Excel workbook.
Yield analysis results
The Excel-based conjunctive use model was used to perform a historical yield analysis, as well as a long-term and short-term stochastic yield analysis on the water resources of Stellenbosch. To gain insight into the functionality of the model, as well as gauge the supply capability of the Stellenbosch system, different scenarios with varying physical constraints were simulated. This was done to compare the capability of the current water supply system to that of a potential system, using available water sources in a conjunctive manner. A sensitivity analysis on the historical firm yield was also performed by considering these different scenarios.
Historical yield analysis
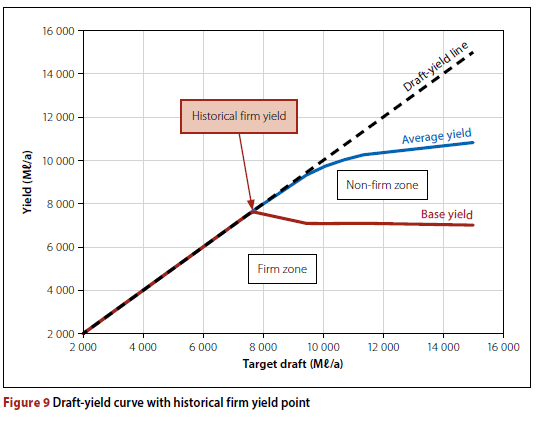
The Stellenbosch Municipality introduced groundwater as an emergency augmentation measure to supplement surface water in 2017, due to persisting drought conditions. Therefore, the base scenario for evaluating the historical firm yield only takes surface water resources into consideration, as this was the typical set-up of the water supply system. The naturalised historical stream-flow sequence (WR2012), disaggregated into a daily sequence, was therefore used as inflow sequence to the historical scenario. The capacity of the Idas Valley dams for the base scenario was set to 100% at commencement of the simulation (Basson et al 1994). The base scenario capacity-time graph for the Idas Valley dams, for the base scenario, was used to identify the critical period. A draft-yield curve (Figure 9) was generated for the historical (base) scenario to establish the historical firm yield point, which indicates the supply capability of the system to satisfy a given target draft. The historical firm yield for the base scenario was determined as 7 561 Ml/a.
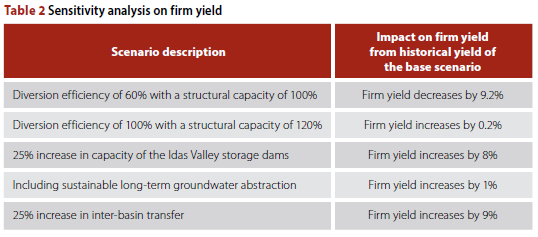
The model can be used to perform a sensitivity analysis on the historical firm yield point by evaluating different scenarios, such as diversion efficiency, structural diversion capacity, storage capacity and different inter-basin transfer capacities. For the Stellenbosch water supply system, the most significant impact on the historical firm yield was caused by diversion efficiency. The firm yield reduced by 9.2% when the structural capacity was set to 100% and the diversion efficiency was set to 60%. However, the firm yield increased by a mere 0.2% when the structural capacity was set to 120%, while the diversion efficiency was set to 100%. This leads to the conclusion that the streamflow volume, with its hydrograph characteristics at the point of abstraction, is the limiting factor and not the infrastructure. When the storage capacity of the Idas Valley dams was increased by 25%, the firm yield increased by 8%. Upon increasing the WCWSS capacity by 25°%, the firm yield increased by 9%, clearly highlighting the areas of possible improvements to the water supply system yield. The sensitivity analysis results are summarised in Table 2.
Long-term yield analysis
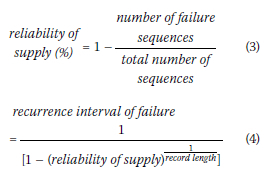
The historical yield gives an indication of the historical supply capability of the system. However, when determining the firm yield associated with each of the 101 stochastic sequences at a specific target draft, the historical firm yield can be associated with a specific long-term reliability of supply. The long-term reliability of supply and recurrence interval of failure were calculated with Equations 3 and 4 (Basson et al 1994).
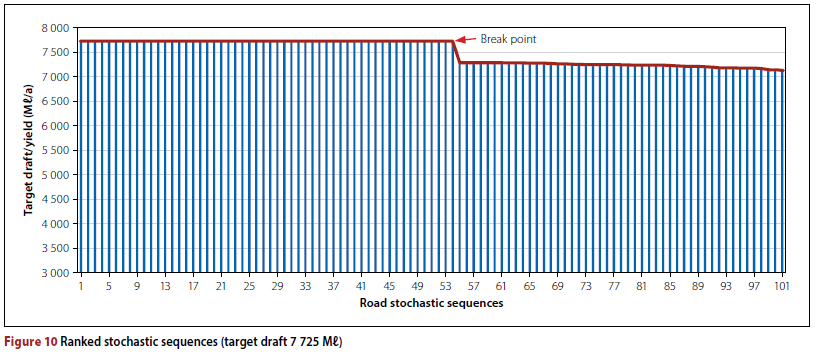
The long-term yield analysis was performed for a number of different possible future scenarios, including an increase in groundwater abstraction, an increase of 25% in storage capacity of the Idas Valley dams, and an increase in the allocation from the WCWSS. Figure 10 illustrates how the firm yield line was derived for one target draft. The 101 stochastic sequences were evaluated for their firm yields at a target draft of 7 725 Ml/a (higher than the historical firm yield) and the results were plotted on a graph in descending order (Figure 10). A break point occurs at the point just before the first failure to supply the target draft.
To generate a long-term reliability graph, the yields of the 101 stochastic sequences were determined and ranked for a number of different target drafts (five target drafts were used in the case study) (Figure 11).
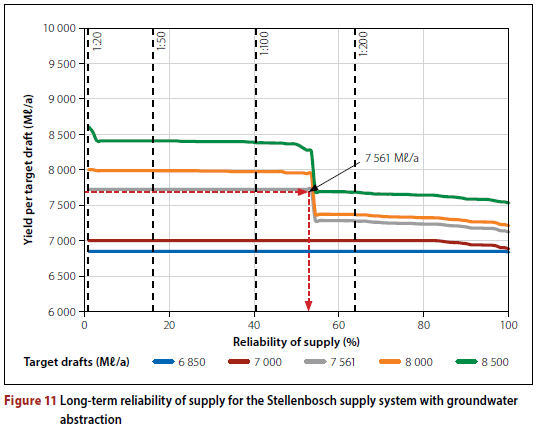
From Figure 11 it is evident that all target drafts larger than 8 000 Ml/a failed most of the time, hence the almost immediate decline in yield around 2% long-term reliability of supply. The target drafts higher than the historical firm yield (7 561 Ml/a) failed at the about 53% reliability of supply, hence another decline in the yield was observed at about 53%. The long-term reliability of supply associated with the historical firm yield with the addition of groundwater was established at 53.5% (47 daily stochastic sequences failed) with an associated recurrence interval of failure of 1:144 years (Equations 3 and 4). The high level of assurance of supply (more than 1:100 years) is partially due to the assumption that water from the WCWSS will be available all the time.
Short-term management
The functionality of the software application for short-term operational and management analysis was illustrated for the Stellenbosch water supply system by generating a two-year planning period using probabilistic storage projections of the Idas Valley dams. The probabilistic storage projections were used to simulate stochastic exceedance probabilities which give an indication of plausible system storage behaviour over the decision-making period, given a current situation (Basson et al 1994). The water resource manager can gauge the real-time storage by comparing it to the probabilistic storage projections, so that management decisions regarding restrictions and augmentation resources can be taken to avert possible crisis situations.
To simulate the probabilistic storage projections of the Stellenbosch water supply system, different commencement situations were evaluated, based on events that had occurred in the past (and which could occur again in the future). The first situation (situation 1) includes simulating the drought scenario, with no water from the WCWSS to the Paradyskloof WTW during November 2017 (GLS Consulting (Pty) Ltd 2018). At that time the storage level of the Idas Valley dams was at approximately 50%, the demand is assumed to have remained at the average rate of 8 000 Ml/a, and no groundwater for augmentation purposes was implemented. Applying the conjunctive use model, the probabilistic storage projections for a two-year period, starting at the beginning of November 2017, were generated (Figure 12).
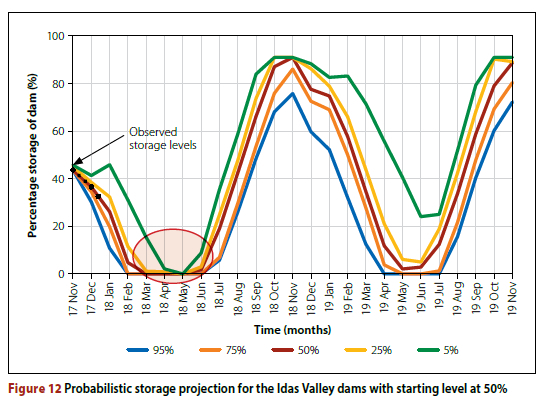
From Figure 12 it is clear that there was a high probability that the water resources supply system would have failed in February 2018, as all exceedance probability trajectories portray a dam storage close to zero storage. The manager monitors progress on a monthly basis, plotting the actual storage capacity (black dots on the storage trajectory in Figure 12). The real-time storage level follows the 50% exceedance probability storage projection. In December 2017 the manager implemented water restrictions of approximately 37% to reduce the demand to 5 000 Ml/a, and introduced abstracted groundwater to the municipal water supply system to avert the projected crisis situation in March/ April. The combined abstraction rate for the Stellenbosch boreholes was set at 1.4 M£/day, on a short-term supply basis. The storage projections were simulated again using the model from the beginning of December, as illustrated in Figure 13. The starting storage level of the Idas Valley dams was set at 40% (situation 2).
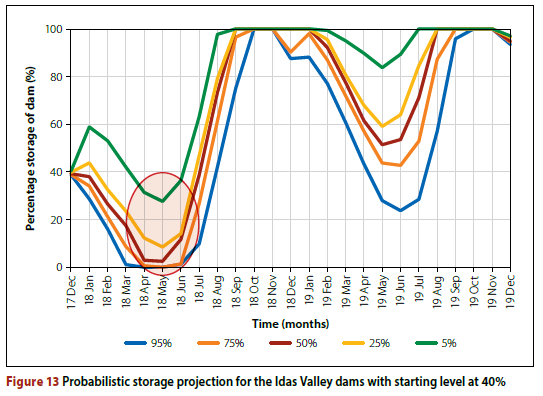
Figure 13 indicates that the risk of system storage failure was more likely to be averted given the 50% (median) system storage trajectory, which indicated that the level of the dams would fall to somewhat above 0%, narrowly averting a system failure. There was only a 5% probability that the dam levels would have fallen below 30% during the next six-month period (from December 2017 to May 2018). The water resource manager was therefore able to attach different percentages of demand reductions to the different probabilistic trajectories and test the effect thereof on the future storage trajectories to enable a motivated approval for the restriction levels proposed to mitigate crisis situations.
CONCLUSION
Municipalities that serve as Water Service Authorities across South Africa are faced with population growth and changing climate conditions impacting on finite resources and limited internal management capacity. To relieve some of these challenges, a Microsoft Excel-based stochastic, daily time-step model for the conjunctive use of water resources was developed. The purpose of the conjunctive use model is to act as a planning and management tool, which can be applied to analyse the yield and associated reliability of the supply from water resources included in a municipal supply system.
The conjunctive use model used monthly streamflow data obtained from WR2012 and the STOMSA software to generate monthly stochastic streamflow. The stochastic monthly streamflow sequences were disaggregated into daily flow sequences using high-, medium- and low-flow classes, based on historical flow sequences. Groundwater is a recharge-dependent resource driven by rainfall events. The model used a runoff-rainfall relationship to generate stochastic rainfall sequences. The SVF method was then used to describe water level fluctuations, due to recharge over a quaternary catchment area. The catchment aquifer was then simulated as a lumped-parameter box-model which assumes that inflow and outflow are equal in a balanced system. Abstraction rates were then evaluated using maximum allowable water level drawdown restrictions. Surface water storage capacity simulations were governed by the dam balancing equation, developed for daily time-steps.
A case study on the water supply system of the Stellenbosch Municipality was presented to illustrate the application of the conjunctive use model. A yield analysis of the current water resources was performed. The historical firm yield for the system indicated that 7 561 Ml/a could be supplied. A sensitivity analysis on the firm yield concluded that the Stellenbosch supply system is most sensitive to diversion efficiency and that increasing the Idas Valley dams by 25% could increase the yield by 8%. Long-term reliability of supply was assessed, and it was found that the historical firm yield has a return period of failure of 1:144 years. Short-term management curves for the probabilistic storage trajectory were generated for a plausible drought scenario. The storage trajectories indicated a high risk of failure. Upon introducing groundwater and demand reductions, the possible drought scenario could be averted with a lower risk of failure.
By testing the model using the Stellenbosch system, it was found that the daily time-step simulations could enable municipal decision-makers to arrive at informed water-resources-related decisions.
CRITICAL EVALUATION AND RECOMMENDATIONS
The accurate computation of the results by the conjunctive use model is dependent on the quality of input data, which is the responsibility of the user. The model can benefit significantly from a central and available dataset (most likely from the DWS), specifying all authorised water use licences to be incorporated in the demand component. It can also be expected, and needs to be investigated further, that environmental demand might need to be linked stochastically to the available flow. The groundwater component developed in the conjunctive use model is limited to unconsolidated shallow and fractured aquifers and provides long-term potential abstraction. Furthermore, it is assumed that, for shallow aquifers, the lag time is within a month of rainfall. To further enhance the range of applicability and accuracy of the conjunctive use model, the following recommendations are proposed for future research:
■ Incorporating population and water-demand projections during the analysis period.
■ Allowing for desalination and water reclamation to be triggered by specified dam levels, while still remaining operational for at least three-month time windows.
■ Investigating and incorporating managed artificial aquifer recharge schemes.
■ Incorporating stochastic groundwater estimation specific to different localised aquifer systems by calibrating the aquifer storage parameters, as well as the lag-time, using observed data from boreholes in the wellfield.
ACKNOWLEDGEMENTS
The authors acknowledge the support of the Stellenbosch Municipality in making this research possible through the supply of data and funding.
REFERENCES
Acharaya, A & Ryu, J 2014. Simple method for streamflow disaggregation. Journal of Hydrologic Engineering, 19(3): 509-519. [ Links ]
Bailey, A, Pitman, W & Kakebeeke, J 2012. Water resources of South Africa. 2012 Study (WR2012). Available at: http://www.waterresourceswr2012.co.za(accessed on 10 June 2019). [ Links ]
Basson, M S, Allen, R B, Pegram, G G S & Van Rooyen, J A 1994. Probabilistic Management of Water Resource and Hydropower Systems. 1st ed. Littleton, CO: Water Resources Publications. [ Links ]
Blersch, C L & Du Plessis, J A 2017. Planning for desalination in the context of the Western Cape water supply system. Journal of the South African Institution of Civil Engineering, 59(1): 11-21. [ Links ]
Braune, E 2016. Some observations on the water resources development and management transition in Israel. Water Wheel, October: 38-41. [ Links ]
Critchley, W, Siegert, K, Chapman, C & Finkel, M 1991. A manual for the design and construction of water harvesting schemes for plant production. Rome: Food and Agriculture Organization of the United Nations (FAO). [ Links ]
DWA (Department of Water Affairs) 2013. National water resource strategy. 2nd ed. Pretoria: Department of Water Affairs. [ Links ]
DWS (Department of Water and Sanitation) 2018. Dual Strategy for Desalination of Groundwater and Surface (sea) water (p 2). Ministerial Interactive Session with Water & Sanitation Sector, Johannesburg: DWS. [ Links ]
DWS 2020. Groundwater resource assessment II. Available at: http://www.dwa.gov.za/groundwater/GRAII.aspx(accessed on 5 January 2022). [ Links ]
DWS 2022. Hydrological Services - Surface water (data, dams, floods and flows). Available at: https://www.dws.gov.za/Hydrology(accessed on 5 January 2022). [ Links ]
Gelhar, L 1993. Stochastic subsurface flow. Cambridge, MA: Massachusetts Institute of Technology (MIT). [ Links ]
GEOSS (Pty) Ltd 2018. Groundwater development for Stellenbosch Municipality drought relief - Stellenbosch Central Area. Stellenbosch: GEOSS. [ Links ]
GLS Consulting (Pty) Ltd 2018. Bulk water resources: Drought intervention projects. Stellenbosch: GLS for Stellenbosch Municipality. [ Links ]
Gorelick, J & Serjak, C 2018. Water reuse gets a new take in South Africa. Available at: https://www.globalwaters.org/resources/blogs/wash-fin/water-reuse-gets-new-take-south-africa(accessed on 1 July 2019). [ Links ]
Hoffman, J 2019. Development of a daily stochastic streamflow model for probabilistic water resource management. University of Stellenbosch, Water Resource Management Course. [ Links ]
Israel, S & Braune, E 2021. Managed aquifer recharge. Stellenbosch University, The Groundwater Project. [ Links ]
Masha, S 2019. Energy saving and environmentally friendly desalination technology and remix water. IMIESA, 83: 132-136. [ Links ]
Muller, M 2017. Understanding the origins of Cape Town's water crisis. Civil Engineering, 25(5): 11-16. [ Links ]
Murray, R, Baker, K, Ravenscroft, P, Musekiwa, C & Dennis, R 2012a. A groundwater planning toolkit for the Main Karoo Basin: Identifying and quantifying groundwater development options incorporating the concept of wellfield and aquifer firm yield. Somerset West: Water Research Commision Project No K5/1763. [ Links ]
Murray, R, Baker, K, Ravenscroft, P, Musekiwa, C & Dennis, R 2012b. A groundwater-planning toolkit for the main Karoo basin: Identifying and quantifying groundwater development options incorporating the concept of wellfield yields and aquifer firm yields. Water SA, 38(3): 407-416. [ Links ]
Nkwonta, O, Dzwairo, B, Otieno, F & Adeyemo, J 2017. A review on water resources yield model. South African Journal of Chemical Engineering, 23: 107-115. [ Links ]
SANCOLD (South African National Committee on Large Dams) 2019. Dams in South Africa. Available at: http://www.sancold.org.za/index.php/about/about-dams/dams-in-south-africa. [ Links ]
Turner, K, Naidoo, K, Theron, J & Broodryk, J 2015. Investigation into the cost and operation of southern African desalination and water reuse plants. Volume III: Best practices on cost and operation of desalination and water reuse plants. Water Research Commission Project No K5/2121; Water Research Commission Report No TT 636/15. Pretoria: WRC. [ Links ]
Van Tonder, G, Bardenhagen, I, Riemann, K, Van Bosch, J, Dzanga, P & Xu, Y 2002. Manual on pumping test analysis in fractured-rock aquifers. Water Research Commission Report No 1116/1/02. Bloemfontein: University of the Free State, Institute for Groundwater Studies. [ Links ]
Van Rooyen, P G & McKenzie, R S 2004. Monthly multi-site stochastic streamflow model. Pretoria: Water Research Commission Report No 909/1/04. [ Links ]
Waldron, M & Archfield, S 2006. Factors affectingfirm yield and the estimation of firm yield for selected streamflow-dominated drinking-water-supply reservoirs in Massachusetts. Reston, VA: US Geological Survey. [ Links ]
Wolski, P 2018. How severe is the drought? An analysis of the latest data. Royal Statistical Society -Significance Magazine, 1 January, 24-27. [ Links ]
Xu, Y & Beekman, H 2003. Groundwater recharge estimation in Southern Africa. Cape Town: UNESCO International Hydrological Programme (IHP). [ Links ]
Xu, Y & Beekman, H 2019. Review: Groundwater recharge estimation in arid and semi-arid southern Africa. Hydrogeology Journal, 27: 929-943. [ Links ]
Zheng, Y, Ross, A, Villholth, K G & Dillon, P (Eds) 2021. Managing aquifer recharge: Showcase for resilience and sustainability. Paris: UNESCO. [ Links ]
 Correspondence:
Kobus Du Plessis
Department of Civil Engineering, Stellenbosch University
Private Bag X1, Matieland 7602, South Africa
T: +27 21 808 4358, E: jadup@sun.ac.za
Erika Braune
Department of Civil Engineering, Zutari, Stellenbosch University 1 Century City Drive
Private Bag X1, Cape Town 7446, Matieland 7602, South Africa
T: +27 21 526 6019, E: erika.braune@zutari.com

PROF KOBUS DU PLESSIS (PrEng, FSAICE, FIMESA) has more than 33 years of experience in water engineering, of which the past 20 years were in the Civil Engineering Department at Stellenbosch University where he is responsible for Hydrology and Environmental Engineering. He has a special interest in flood hydrology, as well as in integrated management of water resources in South Africa as applied by local authorities. He obtained his PhD (Water Governance), MEng (Water Resource Management) and BEng (Civil) from the University of Stellenbosch. He presently serves as an EXCO member of IMESA (Institute of Municipal Engineering of Southern Africa) and is also a member of the SAICE Education and Training Panel.

ERIKA BRAUNE is an employee at Zutari in Cape Town, where she has been involved in water engineering for the past two and half years. Her focus is on water resources management and planning, with special interests in integrated water resources and the conjunctive use of groundwater. She obtained a BEng (Civil) andan MEng (Civil) cum laude from Stellenbosch University. She is a member of IMESA (Institute of Municipal Engineering of Southern Africa) and an Associate Member of SAICE (South African Institution of Civil Engineering) and currently endeavours to obtain her professional engineering registration with ECSA (Engineering Council of South Africa).

