


Services on Demand
Article
 English (pdf)
 Article in xml format
 Article references
Indicators

Related links
-
 Cited by Google
 -
 Similars in Google
Share

 Permalink
Journal of the South African Institution of Civil Engineering
On-line version ISSN 2309-8775
Print version ISSN 1021-2019
J. S. Afr. Inst. Civ. Eng. vol.64 n.2 Midrand Jun. 2022
http://dx.doi.org/10.17159/2309-8775/2022/v64no2a4
TECHNICAL PAPER
Investigating the behaviour factor and seismic response of structural wall systems in low- to medium-rise buildings when soil-structure interaction is considered
P W W Visagie; T N Haas; G P A G van Zijl
ABSTRACT
Practicing engineers typically follow linear methods for seismic design and assessment, confining their approach to the requirements of SANS 10160-4 (SANS 2017). This generally leads to a conservative design, leaving little space to apply additional tools for design refinement.
Soil-structure interaction has beneficial effects for most building structures under seismic action. However, incorporating soil-structure interaction in the analysis influences the fundamental period, damping and ductility, and will therefore influence the behaviour factor prescribed by design codes. The behaviour factor is necessary for linear methods (force-based methods) to predict the nonlinear behaviour of the structure.
This investigation assessed the current behaviour factor for reinforced concrete walls in low- to medium-rise buildings, as prescribed by SANS 10160-4 (SANS 2017), when soil-structure interaction is incorporated in the analysis. The buildings were initially designed and detailed using linear methods, with the prescribed behaviour factor, and then tested using nonlinear methods that do not require the use of a behaviour factor.
Keywords: seismic response, soil-structure interaction, structural wall system, bahaviour factor, damping, ductility
INTRODUCTION
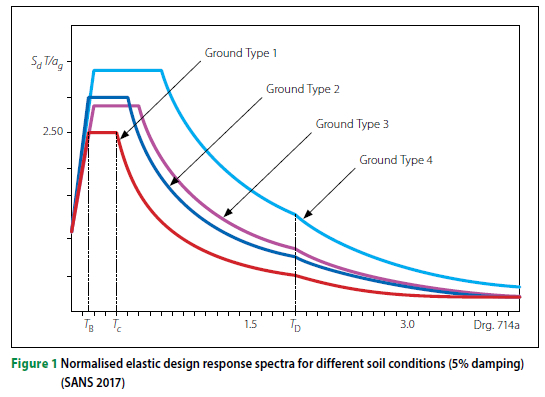
Traditional force-based seismic design approaches require the use of a period dependent acceleration response spectrum to determine the equivalent base shear. Figure 1 shows the horizontal elastic design response spectra for 5% damping, normalised by ground acceleration ag for different soil conditions, specified by SANS 10160-4 (SANS 2017), which is similar to EN 1998-1 (EN 2004b).
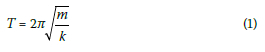
The fundamental period of vibration is determined from empirical equations set out in codes of practice, or by more detailed methods using moment-curvature relationships and eigenvalue analyses. The fundamental period of vibration T of a single degree of freedom (SDOF) system is a function of the mass m of the structure and the horizontal stiffness k of the lateral supporting elements as presented in Equation 1.
Structural walls in medium- to low-rise buildings are comparatively stiff and therefore have short fundamental periods. The short period produces large equivalent base shear forces and overturning moments. The axial forces due to gravity loads are small in medium- to low-rise buildings compared to high-rise buildings. These relatively low ratios of axial force to equivalent horizontal force result in large foundations.
In the principles of capacity design, specific lateral resistant elements referred to as the critical region are identified and suitably detailed to resist the seismic displacement demand through ductile behaviour. This can be regarded as an element with enough local ductility to form a plastic hinge in order to dissipate energy, thereby protecting the rest of the structure (Priestley & Pauley 1992 pp 37-38). The capacity design principles are widely adopted by design codes. Engineers follow this approach to identify hinge mechanisms, which improve the prediction of nonlinear structural behaviour. In the case of structural wall systems without basements, this critical region is in the lower part of the wall, between the foundation and, generally, the first storey. To ensure that the hinge mechanism forms in the critical region before excessive foundation rotation, the foundation is designed to resist a moment larger than the moment resulting from a static analysis. This is termed the overstrength moment. The overstrength moment requirements will result in even larger foundations.
Including soil-structure interaction (SSI) in the analysis may be essential to more accurately compute the building dynamic response (e.g. Mourlas et al 2020). SSI inclusion can improve the computed seismic response of a structure by period lengthening, kinematic effects, additional damping caused by soil hysteric damping and radiation damping. These effects generally reduce the seismic response and therefore produce smaller foundations.
Linear analysis methods are force-based and require the use of a behaviour factor (or force-reduction factor) to simulate the non-linear behaviour of a structure under seismic action. This behaviour factor is related to the ductility capacity and the fundamental period of vibration. Both the ductility and the fundamental period are influenced by SSI. Furthermore, due to the variation in assessing ductility and ductility capacity, there is no real uniformity in the codified behaviour factors (Priestley et al 2007 pp 13-14).
The purpose of the study was to assess the behaviour factor prescribed by SANS 10160-4 (SANS 2017) for structural wall systems in low- to medium-rise buildings when SSI is incorporated in the analysis, by investigating a series of reinforced concrete wall building-frame systems. The investigation commences by assuming fixed foundations before incrementally reducing the foundation size to determine its effects. Reducing the foundation size increases the contribution of the structural frame in resisting seismic action. These structural systems are initially designed using linear methods with prescribed behaviour factor and then assessed using nonlinear methods that are independent of a behaviour factor.
Behaviour factor
If the lateral resisting system possesses sufficient ductility to behave inelastically, then the equivalent inertial forces due to seismic action can be greatly reduced from that of an equivalent elastic system. This principle is explained in Figure 2, where the force-displacement relationship of a simplified elastic system is shown against an elastoplastic system.
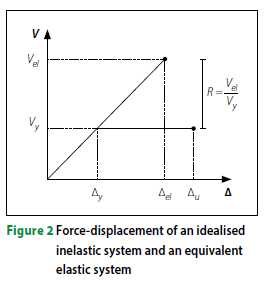
From Figure 2 the displacement ductility μΔ is defined in Equation 2 as:
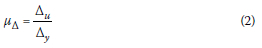
where Δu and Δy are the ultimate displacement and yield displacement, respectively.
If we consider that a seismic event induces a displacement demand on a structure, rather than a force demand, the required equivalent force can be greatly reduced if we ensure that the structure possesses sufficient ductility.
The force-reduction factor is presented by Equation 3:
where Vel is the force of an equivalent elastic system while Vy is the force for the elastoplastic system.
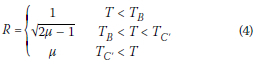
Several researchers have proposed a relationship between the force-reduction factor (R), ductility (μ) and period (T), referred to as the R-μ-Τ relationship. Commonly used approximations are the equal energy and equal displacement principles, as presented in Equation 4.
Eurocode 8 (EN 2004b) and SANS 10160-4 (SANS 2017) include this force reduction by means of a behaviour factor q and is a combination effect of the force-reduction factor and an overstrength factor Ω as presented in Equation 5.

The overstrength can be regarded as the structural strength redundancy inherent in code-based structural design, for example:
■ Material factors used in design
■ Confinement effect of reinforced concrete members
■ Minimum reinforcement requirements
■ Elements that can add to resistance not considered in the design.
EN 1998-1 3.2.2.5 (EN 2004b) describes the behaviour factor as "an approximation of the ratio of the seismic forces that the structure would experience if its response was completely elastic with 5% viscous damping, to the seismic forces that may be used in the design, with a conventional elastic analysis model, still ensuring a satisfactory response of the structure". The behaviour factor is therefore an attempt to incorporate the advantages of the nonlinear behaviour of a structure into linear elastic methods of analysis.
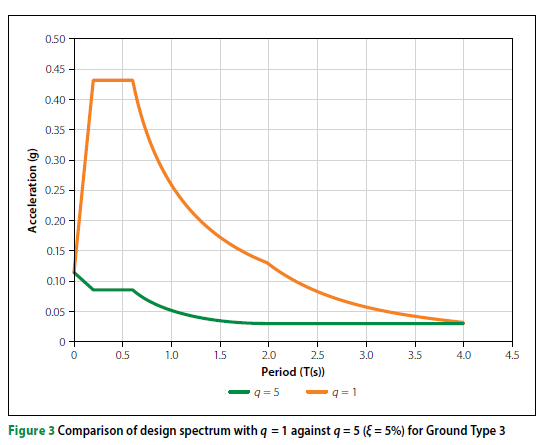
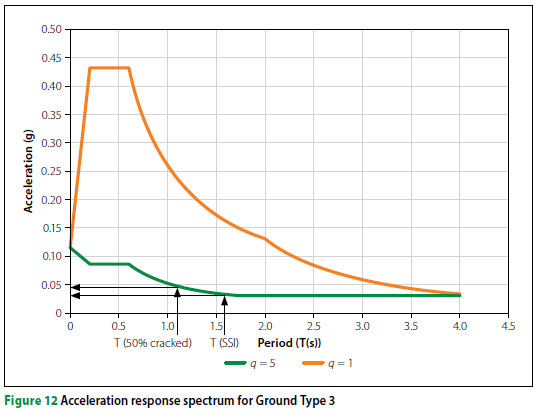
SANS 10160-4 (SANS 2017) prescribes a behaviour factor q for structural wall systems as 5, when strict rules for confinement reinforcement of the critical regions are adhered to. The detailing rules are taken from the ACI 318 code and the definition of the height of the plastic region is taken from the Swiss Code: SIA 262:2003 (Retief & Dunaiski 2009 p 181). The behaviour factor greatly reduces the design base shear. Figure 3 illustrates the design acceleration response spectrum of a completely elastic system (q = 1) against the design acceleration response for a behaviour factor of 5.
Soil-structure interaction (SSI)
Soil-structure interaction (SSI) analysis is the evaluation of the combined response of the structure, foundation and the soil under the foundation (NIST 2012 p iii).
SANS 10160-4 (SANS 2017) does not explicitly set out specifications for soil-structure interaction. Eurocode 8 part 5 (EN 2004c) lists the types of structures that require SSI analysis. These are structures where the interaction between the soil and the foundation could have a negative effect on the seismic response, therefore a "fixed base" analysis is likely to be unconservative. Annex D of Eurocode 8 part 5 (EN 2004c) states: "For the majority of common building structures, the effects of SSI tend to be beneficial, since they reduce the bending moment and shear forces in the various members of the superstructure." Eurocode 8 does not, however, provide more specific guidelines on the design and modelling aspects.
ASCE (American Society of Civil Engineers) reports, together with other US codes and technical guidelines, provide more detailed procedure for evaluating and assessing structural systems with SSI. This investigation followed ASCE/ SEI 41-17 (ASCE 2017) and ASCE/SEI 7-16 (ASCE 2016) guidelines for including SSI in a rational manner, while keeping within the framework of the South African national design codes and Eurocode 8.
SSI influences the seismic response of a structure by period lengthening, kinematic effects, and foundation damping caused by soil hysteretic damping and radiation damping. These effects are discussed in the following subsection.
Period lengthening
Consider the single degree of freedom (SDOF) oscillator shown in Figure 4.
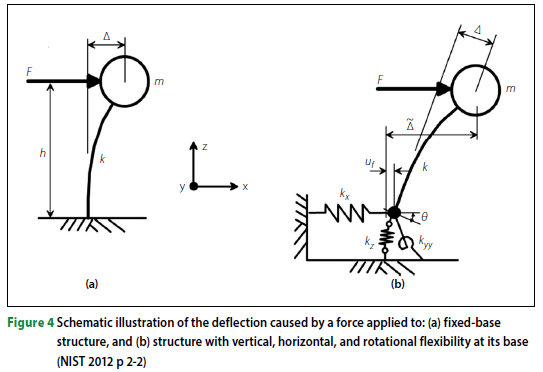
A fixed base oscillator refers to the standard SDOF oscillator fully restrained to a base with infinite stiffness (no springs), while a flexible base oscillator refers to a SDOF oscillator connected to a flexible base (with springs).
With reference to Figure 4, the classical period lengthening expression from Veletsos and Meek (1974), derived through Equations 6 to 11:
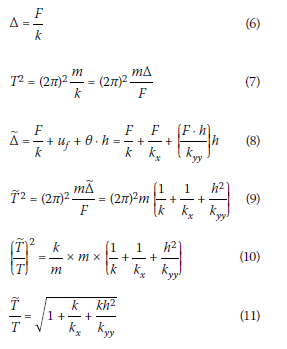
where:
Δ Deflection of the fixed base
Δ Deflection of the flexible base
F Static lateral force
k Lateral stiffness of the oscillator
Uf Horizontal translation of the oscillator at its base
θ Base rotation angle
h Effective height of the oscillator
T Lengthened period of the flexible base
T Period of the fixed base
kx Translational stiffness of the base
kyy Rotational stiffness of the base
Although earlier versions of ASCE 7 present the equation for period lengthening in a similar form, the latest ASCE/SEI 7-16 refers to the ratio  but does not provide an expression for this ratio. ASCE/SEI 41-17 specifies that the period extension should be determined using a mathematical model and stipulates that approximate periods shall not be used.
Kinematic effects
Large stiff foundations can cause the foundation motion to deviate from the free-field motions due to base slab averaging and embedment effect. Simplistically, base slab averaging is caused by an incoherence in response of different parts of a single foundation, which results in an averaging effect over the foundation. Typically, ground motion reduces with depth, which is referred to as embedment effect.
Kinematic interaction will result in a decrease in the response of the building under seismic action. These effects are usually accounted for in the design by response spectrum modification factors called RRSbsa and RRSe. RRSbsa is the response reduction factor for base slab averaging and RRSe is the response reduction factor for foundation embedment. ASCE/SEI 41-17 (ASCE 2017) and ASCE/ SEI 7-16 (ASCE 2016) propose empirical formulae to account for these effects. The product of RRSe and RRSbse is used to reduce the response spectrum. These factors are unrelated to the force-reduction factor (or behaviour factor). The reader is referred to NIST GCR 12-917-21 Chapter 3 (NIST 2012) for a detailed description.
The investigation was more concerned with the effects that would influence the behaviour factor, such as ductility and damping. The RRS was therefore conservatively ignored (RRS = 1).
Foundation damping
Foundation damping can contribute to the total damping and is typically introduced through Equation 12:
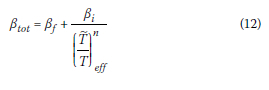
where ßf is the foundation damping and ßi is the initial viscous damping, which is normally assumed as 5% for typical building structures.
The contributions to foundation damping are soil hysteretic damping ßs and radiation damping ßrd. Soil hysteretic behaviour is conceptually similar to any strain dependent material hysteretic behaviour. Seismic waves reflecting from the base, back into the ground, are called radiation waves and causes radiation damping.
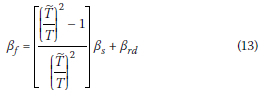
ASCE/SEI 7-16 (ASCE 2016) and ASCE/ SEI 41-17 (ASCE 2017) set out the same procedure to incorporate damping, as presented by Equation 13, and was used in this investigation.
Soil hysteretic damping ßs values can be obtained from Table 8-6 of ASCE/SEI 41-17 (ASCE 2017). These values are a function of the geotechnical conditions and effective peak acceleration obtained from the acceleration response spectrum.
Radiation damping ßrd is determined from empirical expressions based on Wolf (1985) and is presented by Equation 14:
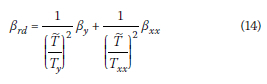
where Ty and Txx represent the transla-tional and rotational periods, respectively.
Assessing behaviour factor with SSI
Establishing an exact behaviour factor for a specific lateral resisting system creates many difficulties and should be carefully considered. Some of the difficulties when assessing the behaviour factor are briefly discussed here.
Defining ductility
There is a lack of consensus as to the appropriate definition for yield and ultimate displacement when a bilinear approximation of the force-displacement relationship is produced, resulting in various definitions of ductility (Priestley et al 2007 pp 12-13).
R-μ-Τ relationships
The expressions describing the relationship between ductility, force-reduction and fundamental period are approximations. The expressions hold on average, but can be irregular (Chopra 2012 pp 289-290).
Codified behaviour factors
Design codes often consider additional redundancies within the behaviour factor.
Eurocode 1998-1: 3.2.2.5 (EN 2004b) states that the values of the behaviour factor account for the influence of the viscous damping being different from 5%.
As a commentary on the potential shortcomings of existing design guidelines on SSI, NIST GCR 12-917-21 (NIST 2012 p 4-3) identifies that there is no link prescribed between behaviour factors intended to represent structural ductility and SSI.
ASCE/SEI 7-16 (ASCE 2016) limits the reduction in design base shear when SSI is considered in the equivalent static lateral force procedure. Equations 19.2-1 and 19.2-3 of ASCE/SEI 7-16 are repeated here as Equations 15 and 16:
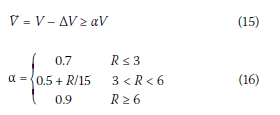
where R is the response modification factor (force reduction factor).
Interestingly, it is observed that the limits relate to the behaviour factor (or force-reduction factor). The commentary chapters of ASCE/SEI 7-16 section C19.2 state: "The limitation on potential reductions caused by SSI reflects the limited understanding of how the effects of SSI interact with the R factor." (ASCE 2016)
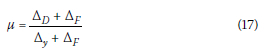
SSI influences the damping and ductility of a structure and therefore influences the behaviour factor. Figure 5 illustrates the influence of SSI on the ductility with a simple standalone concrete wall on a flexible foundation. The yield displacement Δy at the effective height of the wall will increase with the displacement due to foundation flexibility, ΔF, to Δy.
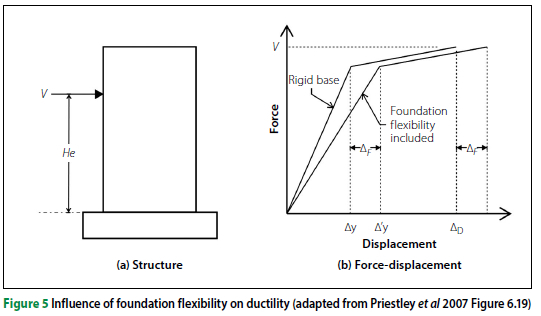
If the design displacement ΔD is strain-limited it will increase by approximately the same amount. The ductility capacity can then be expressed through Equation 17.
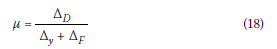
If the design displacement is limited by codified maximum drift, then the ductility capacity can be expressed in Equation 18.
With the likely reduction in ductility capacity, a similar reduction in behaviour factor would be expected. However, amongst other effects, SSI will contribute to the total damping of a structure. This, according to EN 1998-1 (EN 2004b), will also influence the behaviour factor.
Frame contribution
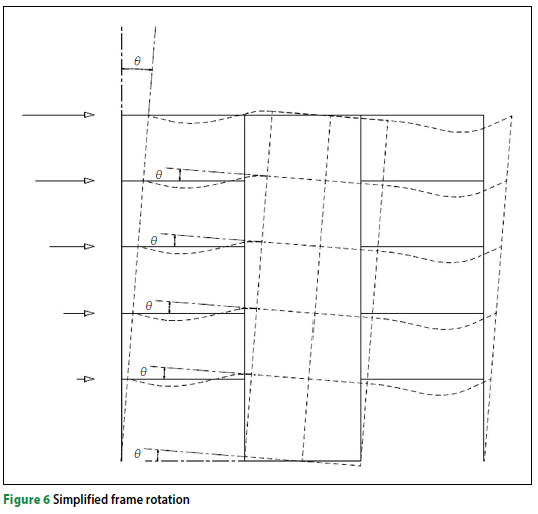
Most structural walls in buildings are not standalone elements but are connected to columns with horizontal elements (slabs or beams). If SSI is included in linear models, the horizontal elements will be designed to, in part, accommodate the additional rotation at the base of the wall.
The contribution of the frame to the stability of the structure will increase proportionally with foundation rotation. By considering the simplified structural wall frame shown in Figure 6, and assuming that the vertical members are rigid, it is expected that, for a foundation rotation of θ, a similar additional rotation would occur in the horizontal frame elements at the wall face, resulting in the frame contributing more to the stability of the structure.
BUILDINGS INVESTIGATED
The buildings were chosen to be simplified representations of a typical commercial building in South Africa.
Building type
An office building, corresponding with the importance class 2 of "ordinary building" in SANS 10160-4 (SANS 2017) was chosen as the basis of the investigation. Figure 7 illustrates the typical building layout.
The reference floor layout consists of a 250 mm thick reinforced concrete flat slab, with 6 m single spans on either side of the reinforced concrete wall in the direction of loading, to represent relatively slender contributing frame elements. This study considers seismic action in the north-south direction. It is assumed that the buildings are stable in the east-west direction.
This investigation focused on medium-to low-rise buildings. Buildings with 7, 5 and 3 storeys were chosen for this reason.
Table 1 represents the summary of the building and floor heights investigated.

Loading
Self-weight: The concrete density Yconc was taken as 24 kN/m3, with a 250 mm slab thickness resulting in the slab self-weight of 6 kN/m2.
Permanent load: For an office building with masonry as infill panels with a typical arrangement of internal brickwork together with tiling, services and screed, an additional dead load (DL) of 5.5 kN/m2 was estimated.
Imposed load: SANS 10160-2 (SANS 2011) Table 1 prescribes a 2.5 kN/m2 imposed load for offices.
Structural wall
The wall aspect ratio is defined as the total height Hw to wall length Lw. For a given global displacement ductility μ δ the local curvature ductility demand μΦ will increase as the wall aspect ratio Hw/Lw increases (Priestley & Pauley 1992 p 400).
Squat walls with small aspect ratios are more likely to be dominated by shear behaviour. To ensure ductile, flexure-dominated behaviour, rather than the more brittle, shear-dominated behaviour, it would make sense to limit the aspect ratio to some extent. SANS 10160-4 (SANS 2017) does not explicitly limit this ratio. EN 1998-1 (EN 2004b), however, makes use of a factor kw to adjust the behaviour factor according to the prevailing mode of failure, which is a function of the aspect ratio. The expression for kw reduces the behaviour factor for aspect ratios lower than two, implying an expected loss in ductility for aspect ratios lower than two.
As the aspect ratio increases, the lateral drift limits become the more prominent allowable displacement limits. This means that, for slender walls with large aspect ratios, the member would not reach its full ductility capacity associated with strain limits but would rather reach drift limits associated with secondary damage of non-structural infill panels. Priestley et al (2007 pp. 325-327) suggest that, for aspects ratios of approximately 9 and larger, a structural wall is expected to reach storey drift limits while still behaving elastically.
This study investigated rectangular walls with aspect ratios of 3 and 5. These ratios fall within the practical range for structural walls associated with ductile, flexure-dominated behaviour. The wall length will therefore change with a change in building height. Table 2 represents the wall lengths corresponding to each aspect ratio and building height investigated.

The width of the walls was kept constant at 300 mm. This largely corresponds to suggested limits by Priestley and Pauley (1992 p 403) for lateral stability.
Ground type
It is observed from Figure 1 that different soil types will influence the seismic response of a building. Table 3 (page 43) provides a description of the soil types as presented in Table 1 of SANS 10160-4 (SANS 2017), which is similar to EN 1998-1 (EN 2004b Table 3-1).

This investigation focused on Ground Type 3 as per EN 1998-1 Ground Type C (EN 2004b), which is consistent with soil conditions commonly found in the southwestern region of the Western Cape Province, an area under the highest risk associated with natural seismic activity in South Africa.
It can be observed from Figure 1 that Ground Type 3 represents a reasonable average response for all four ground types.
The relevant soil parameters used in this investigation are:
Shear wave velocity vs 30..........180 m/s
Expected bearing capacity qu ...... 400 kPa
Stress strain modulus Es..........50 MPa
Poisson's ratio υ......................0.4
Soil density ysoil................18 kN/m3
METHOD OF INVESTIGATION
The method used in this investigation is presented in a stepwise manner.
Step 1: Equivalent lateral force procedure
A reinforced structural wall system with fixed base was analysed using the equivalent later force method as prescribed by SANS 10160-4 (SANS 2017). The design base shear Vn is calculated assuming a behaviour factor of 5.
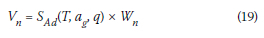
SAd is the design acceleration spectra (normalised to gravity acceleration g). Wn is the nominal sustained vertical load acting on the structure. The lateral force pattern used to translate the base shear to an equivalent inertial force per storey is given in SANS 10160-4 (SANS 2017) as presented in Equation 20.
hi, hj storey height above the base to level i or j respectively Wi, Wj nominal sustained vertical load of floor i or j respectively
The force pattern should represent the mode shape of the first mode of vibration, given the simplification of the lateral force method that higher modes do not contribute to the response of the structure.
The fundamental period of vibration is determined using FE eigenvalue analysis assuming the structural wall stiffness as 50% of the elastic stiffness (0.5EI). An iterative procedure whereby the fundamental period of the wall is reassessed after it was initially designed to resist equivalent forces produced by an initial estimate of the fundamental period, is considered more accurate. However, design codes intentionally provide formulae to produce short periods and therefore conservatively large design base shears, which is an additional redundancy when specifying behaviour factors. The period associated with the 50% elastic stiffness will produce the lowest allowable design base shear within the framework of SANS 10160-4 (SANS 2017).
SANS 10160-4 (SANS 2017) prescribes a peak ground acceleration (PGA) of 0.1 g for all regions experiencing natural seismic activity in South Africa (Zone I regions), despite indicating higher nominal peak ground accelerations with a 10% probability of exceedance in 50 years in Figure A.1 of SANS 10160-4 (SANS 2017). The code committee deemed it inappropriate to increase the PGA magnitude, as one of the main motivations for revising the seismic loading code was due to the perception from engineers that the PGA was too conservative. To overcome this concern, the lower limit of the redundancy factor borrowed from Uniform Building Code:1997 (UBC) was rather adjusted to effectively increase the PGA from 0.1 g to between 0.12 g and 0.15 g (Retief & Dunaiski 2009 pp 173-174). Remaining consistent with SANS 10160-4 (SANS 2017), a PGA of 0.1 g, together with the redundancy factor, was used for design; however, a PGA of 0.15 g was used for the nonlinear assessment of the structures. A PGA of 0.15 g reflects a more accurate value for the southwestern region of the Western Cape Province.
Step 2: Code design
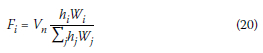
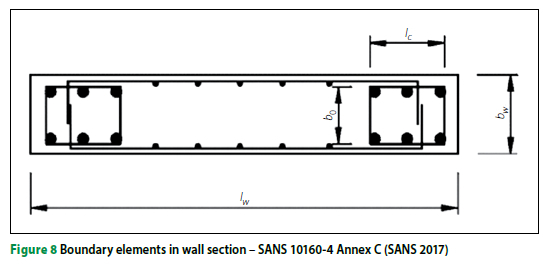
The structural wall system was reinforced to resist the total fixed base moment, following capacity design principles. The wall boundary elements were detailed according to SANS 10160-4 (SANS 2017) Annex C. The boundary elements provide confinement in regions of the walls where the concrete fibres are highly stressed under seismic action and prevent buckling of the longitudinal reinforcement under load reversal. The confinement effects and resistance to reinforcement buckling are critical to ensure ductile behaviour in structural walls. Figure 8 shows a typical wall with boundary elements as per SANS 10160-4 (SANS 2017). The structural frame is designed according to SANS 10100-1 (SANS 2000).
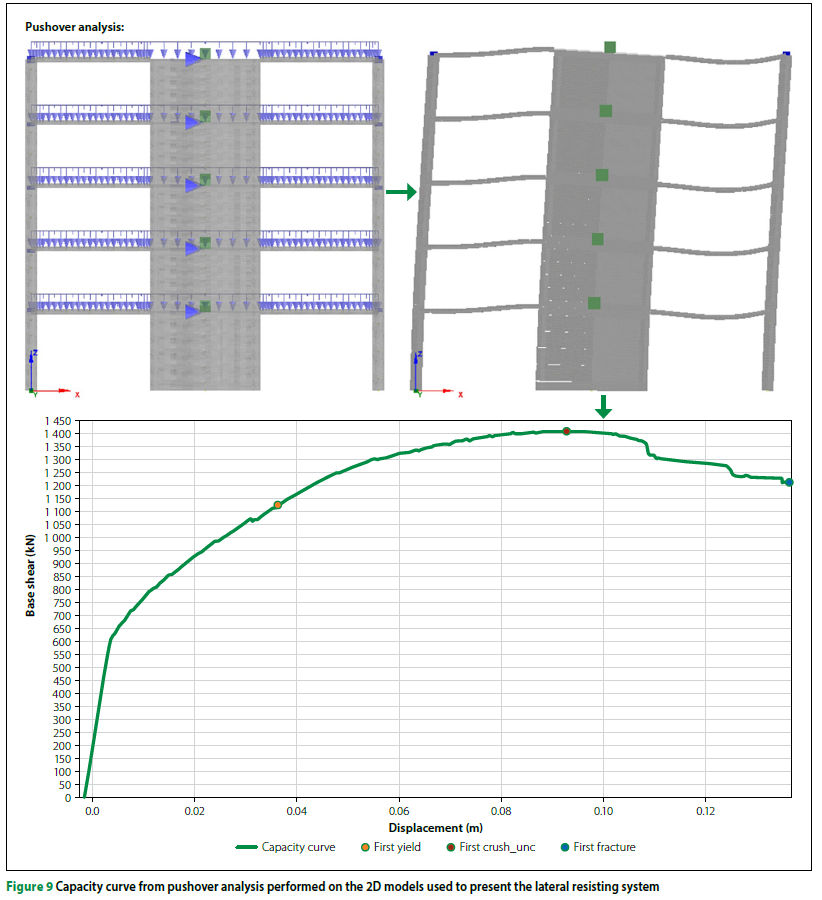
Step 3: Nonlinear static assessment (pushover analysis)
Nonlinear static procedures were performed on the 2D models used to present the lateral resisting system. The nonlinear static procedure was used to produce a capacity curve for the designed building, which is shown in Figure 9.
The N2 method prescribed by Eurocode 1998-1 (EN 2004b) is used to determine the target displacement (or displacement demand). The process is briefly described here:
A bilinear elastic-perfectly plastic approximation of the capacity curve is determined through ensuring that the area under the bilinear curve is equal to the area under the capacity curve, until the formation of the plastic mechanism. This implies that the energy of the equivalent system is equal to that of the original, which is illustrated in Figure 10 (page 45).
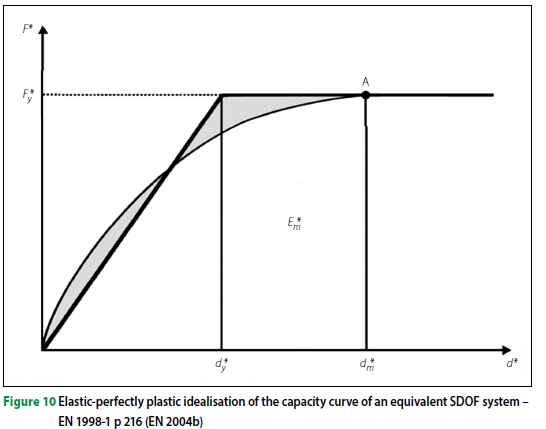
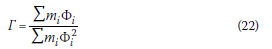
The yield force Fy is initially taken as the ultimate force on the capacity curve. The yield displacement dy is determined by Equation 21:
where Em is the area under the curve and dm is the displacement at the formation of the plastic hinge mechanism.
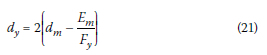
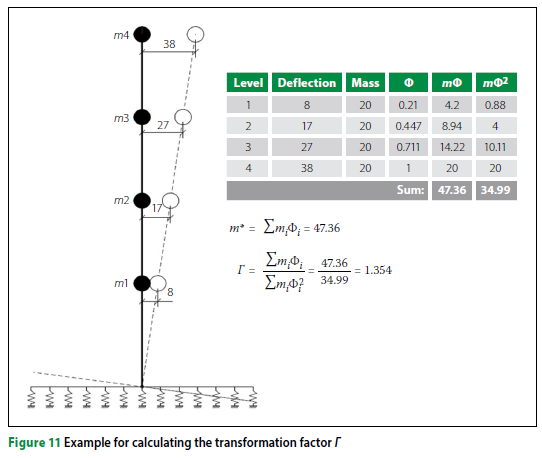
The multi degree of freedom (MDOF) system is transformed to an equivalent SDOF through Equation 22:
where mi is the mass per floor i. The normalised shape vector represents the lateral deformed shape. A simple example for calculating the transformation factor is shown in Figure 11.
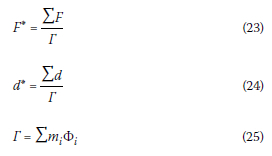
The equivalent SDOF system can then be calculated using Equations 23, 24 and 25.
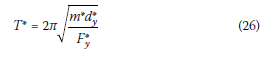
The effective period T* of the equivalent SDOF system can then be calculated using Equation 26.
The displacement of the SDOF system d* can be determined using the 5% damped elastic spectra and Equations 27, 28 and 29, with an adjustment for shorter periods where the equal displacement approximation does not apply.
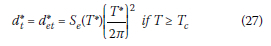
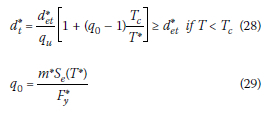
The target displacement (or displacement demand) for the MDOF system dt is calculated as:
The pushover analysis formed the basis of the nonlinear assessment as it allows for a clear assessment of ductility. The capacity curve also indicates a certain level of reliability by showing the target displacement against displacements associated with structural failure. In addition to this, there are more consensus in guidelines on the use of SSI with the pushover analysis, as opposed to SSI in time-history analysis (THA), where the specifications can involve complex variations in parameters that could detract from the main influences of the study. The THAs were therefore used as displacement response verification of the results from the pushover analyses.
Step 4: Reduce foundation sizes
The foundation size was systematically reduced to resist a percentage of the fixed moment. As the foundation moment reduces, the contribution of the frame for stability increases.
SSI will also influence the response; therefore Steps 1 to 3 are repeated. The effects investigated in this study are defined per step as:
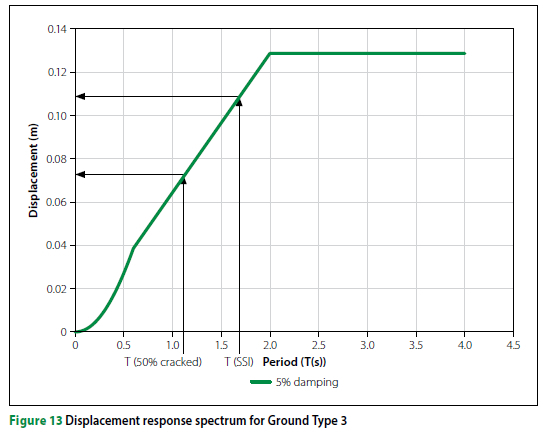
■ Step 1: Longer fundamental period of vibration will produce smaller base shear, but larger displacement. Figures 12 and 13 illustrate the effects of period lengthening on the response.
■ Step 2: Lower design base shear forces produce smaller foundation overturning moments. Reinforcement requirements for the wall reduce, while the reinforcement in the contributing frame increases with increased displacement response.
■ Step 3: SSI was incorporated in the models using the beam-on-nonlinear Winkler foundation (BNWF) models. This method also corresponds to Method 2 of ASCE/SEI 41-17 Chapter 8 (ASCE 2017).
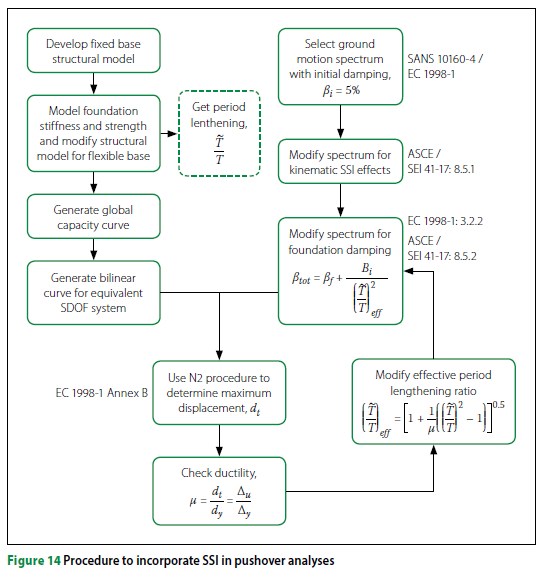
The target displacement was calculated using the N2 procedure prescribed by EN 1998-1 Annex B (EN 2004b) but included the effects of SSI as prescribed by ASCE/SEI 41-17 (ASCE 2017). An initial investigation showed that the Coefficient Method prescribed by ASCE/SEI 41-17 (ASCE 2017) compares well with the N2 procedure for walls with fixed bases (i.e. walls where SSI are not included).
SSI influences the ductility and damping. Damping is also influenced by ductility. The procedure is therefore iterative. Convergence is found when the difference in the displacement between successive iterations is smaller than 1 mm. The adapted iterative procedure is presented in Figure 14.
Step 5: Inelastic time-history analysis
Structural systems with reduced base sizes were analysed with THAs. The displacement responses were used as an additional verification to determine whether the structures meet required demands. Three accelerograms obtained from PEER Strong Motion Database (PEER 2020) were matched with South African conditions and are presented in Table 4 (page 47).
Spectral matching is the nonuniform scaling of a ground motion to match a target response spectrum. The target spectrum is the spectrum defined by SANS 10160-1 for Ground Type 3 (SANS 2017). Figure 15 illustrates the matching principle.
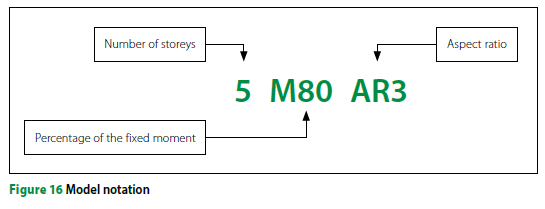
A total of 24 models were investigated, which are summarised in Table 5. M100 (or Mfixed) refers to the baseline models where the walls are designed and modelled with fixed support conditions at the base, with the bases not explicitly modelled, therefore not considering SSI, whereas M60 is the base size with capacity to resist 60% of the fixed moment. Figure 16 explains the model notation, and the foundations sizes are summarised in Table 6.


NUMERICAL MODELLING
SeismoStruct from Seismosoft (Seismosoft 2020) is a commercial finite element software which was used for all nonlinear modelling. SeismoStruct predominantly uses the fibre section approach, whereby a member is represented by a series of cross-sections that are divided into a number of fibres, separately representing the concrete and the reinforcing steel. Each fibre consists of its own associated uniaxial stress-strain relationship. The fibres are then integrated to obtain the stress-strain state of the section. Separate material rules are used for confined concrete, unconfined concrete and reinforcing steel.
Priestley et al (2007 pp 195-196) and the SeismoSoft user manual (Seismosoft 2020 p 297) define some of the advantages and disadvantages of using fibre elements. The main considerations for this study are described as the follows:
Advantages:
■ No prior moment-curvature analysis of members is necessary.
■ The hysteretic response is defined by the material properties; there is no need to introduce any element hysteretic responses.
■ Direct modelling of axial load-bending moment interaction in both strength and stiffness.
■ The member's post-peak strength reduction can be directly modelled.
■ Straightforward representation of biaxial loading.
■ Structural damping is directly modelled.
Disadvantages:
■ Fibre elements model flexural response -shear strength and deformation are not modelled directly.
■ The interaction between flexural ductility and shear strength is not modelled directly.
■ Strain penetration requires special treatment.
■ Excessive computing time for large models.
Nonlinear modelling for shear deformation in cracked reinforced concrete sections under dynamic loading falls outside the scope of this study. However, shear deformation will increase the displacement capacity corresponding to strain-based flexural limit states (Priestey et al 2007 p 185). Not considering shear deformation when testing whether the structures meet their corresponding displacement demands is therefore deemed conservative. Furthermore, the additional assessments on ductility are based on the relative change in ductility. Shear deformation should not influence these results, provided that the methods of analysis and assessment are consistent for all models.
A single frame was modelled to represent the lateral resisting system of the structure, as presented in Figure 17. The elements and connection are briefly explained, with reference to Figure 17.
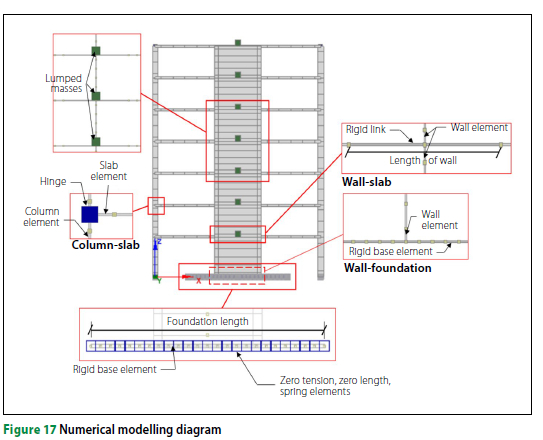
Elements
Wall elements consist of confined concrete elements to represent the wall boundary elements, and unconfined concrete for the web section of the wall. Slab elements are fixed to the wall with rigid links along the length of the wall. The slab elements are beam elements with the width equal to the panel width of the bay. All slab elements are modelled as unconfined concrete elements and are connected to the columns with pinned connections, therefore not transferring moments to the columns. Column elements are designed to remain elastic, therefore limiting the column contribution to the ductility of the lateral resisting system. Base elements are fixed to the wall elements and are modelled as rigid beams over a set of zero-tension, zero-length spring elements. As this study assesses the relative change in ductility, it was deemed unnecessary to introduce the additional parameter of base stiffness to the investigation. The stiffness of the base was therefore assumed to be rigid for all structures considered. Modelling a rigid foundation is an accepted method for inclusion of SSI in the analysis. The reader is referred to the design standards of ASCE/SEI 41-17 (ASCE 2017) for the recommended methods of analyses.
The stiffness of the individual spring elements depends on the dimensions of the foundations and the spacing. The modulus of subgrade reaction was calculated using expressions proposed by Bowles (1996). An elastic perfect-plastic force-displacement spring compressive response was modelled, with zero tensile resistance. As an example case of a 10.2 χ 1.6 m foundation (L χ B), the foundation specific modulus of subgrade reaction kv was calculated to be 63 796.53 kN/m3. Using 25 zero-tension spring elements to represent the SSI under a foundation, the minimum number recommended for accuracy as per NIST GCR 12-917-21 (NIST 2012), each internal spring's stiffness and capacity were calculated to be 43 481 kN/m (kv χ L/24 χ B) and 272 kN (qu χ L/24 χ B) respectively. The embedment depth influence factor was assumed to be unitary.
Lumped mass
To represent the full mass associated with the seismic response of the equivalent frame, a lumped mass was introduced at every level. The lumped masses do not contribute to the axial load on the structural wall, as this is modelled directly, but contribute to the mass participation during seismic loading.
Performance criteria
The monotonic relationships shown in this section serve to clearly illustrate strain limits; however, the recommended strain limits are calibrated to account for cyclic behaviour.
Concrete
The stress-strain relationships for confined and unconfined concrete proposed by Mander et al (1988) were used, which are shown in Figure 18:

where:
fc Concrete compressive stress
sc Concrete compressive strain
f'c Unconfined concrete compressive strength (cylinder strength)
eco Strain at peak stress for unconfined concrete, generally assumed as 0.002 f'cc Confined concrete compressive strength
&cc Strain at peak stress for confined concrete
The ultimate strain for confined concrete will depend on the amount of confinement reinforcing but is expected to be approximately 0.02 for boundary elements reinforced according to SANS 10160-4 Annex C (SANS 2017). The ultimate strain for unconfined concrete was conservatively taken as 0.0035.
Reinforcing steel
EN 1992-1-1 Clause 3.2.7 (EN 2004a), proposes an idealised bilinear relationship for design purposes, shown in Figure 19.
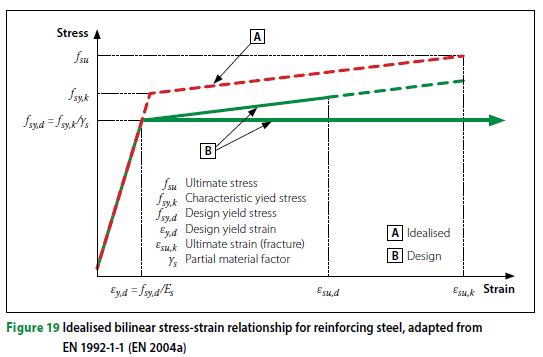
SANS 10100-1 (SANS 2000 Figure 2) assumes an elastic-perfectly plastic curve for design purposes, which was assumed for member design in this investigation. For the nonlinear assessment, however, strain hardening was considered with the mean material properties.
Ultimate tensile strain for high-yield steel reinforcement is expected to be in excess of 0.1. However, ultimate tensile strain is reduced under load reversal. A recommended ultimate steel tensile strain of 0.06 was assumed (Priestley et al 2007 p 143).
Drift limits
To prevent excessive damage to infill panels and non-structural elements, SANS 10160-4 (SANS 2017 Clause 9.3.1) limits inter-storey drift to:
where: dr-j is the relative drift between two storeys and hs is the storey height.
RESULTS AND DISCUSSION
Target displacement
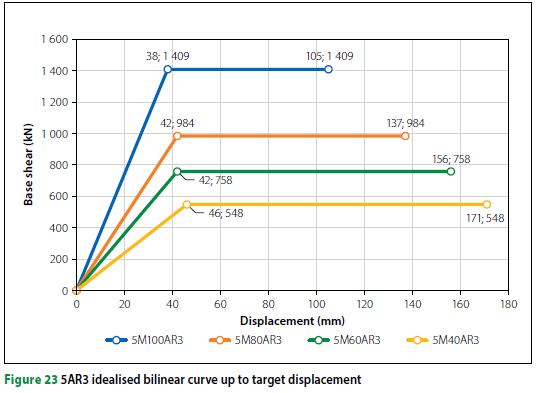
All models that include SSI achieve their target displacement without failure, implying that the behaviour factor of 5 is an appropriate assumption. Figures 20 to 25 show the target displacement from all models with reduced foundation sizes against the fixed base model.
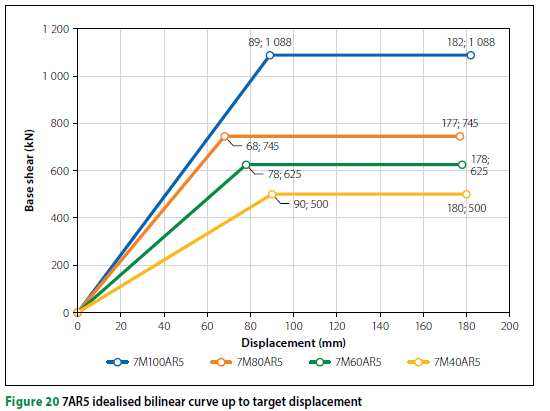
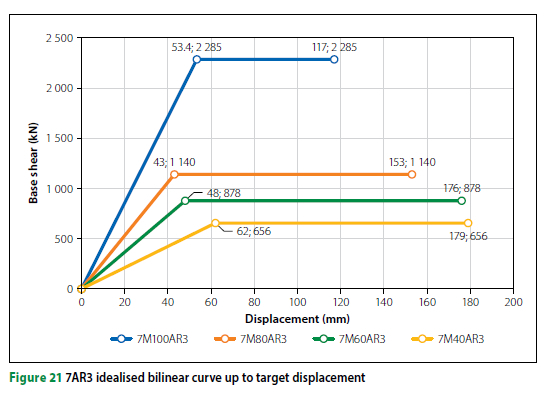
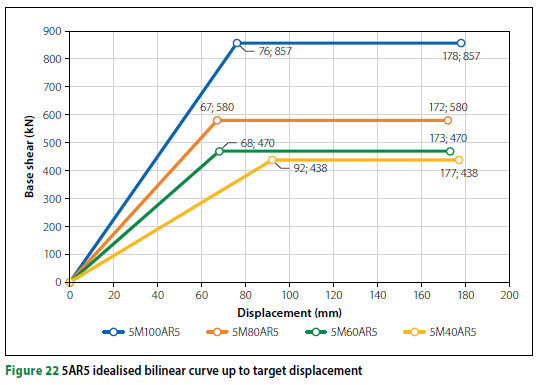
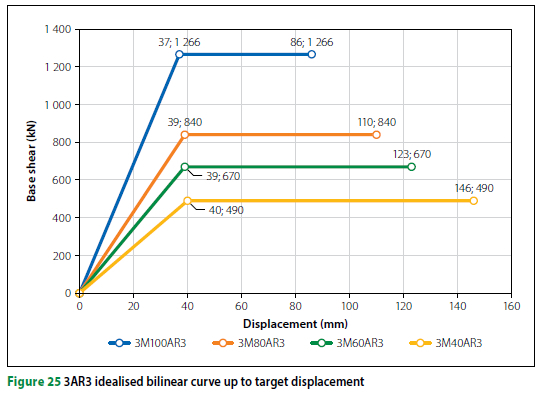
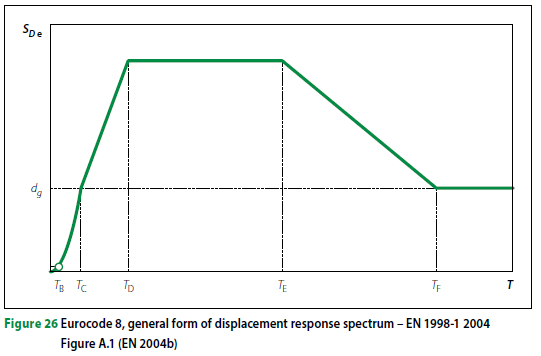
It is observed that for more slender buildings, with wall aspect ratios of 5, there is no significant difference in target displacement between the fixed model (M100 model) and the SSI models (models where the foundations are explicitly modelled). In some cases, the target displacement for the SSI models is, in fact, less than the fixed base model, as shown in Figures 20 and 22. This is due to the shape of the displacement response period, shown in Figure 26, where SDe is the displacement of an equivalent SDOF system. It is observed that the displacement is expected to remain reasonably constant or reduce for periods larger than the displacement corner period TD Table 7 presents the recommended corner periods as per EN 1998-1 (2004b) and SANS 10160-4 (2017). The reduction in the target displacement seen for the SSI models with periods longer than TD is the result of the adjustments in damping, due to SSI and ductility, accounted for in the SSI adjusted method.

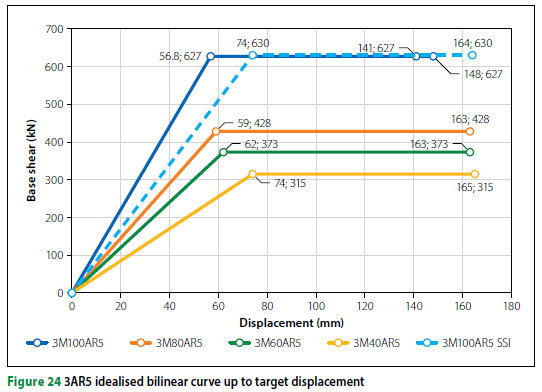
The expected increase in target displacement with reduction in foundation size is better illustrated with the more rigid buildings, with wall aspect ratios of 3 (Figures 21, 23 and 25), where the fundamental period of vibration is typically shorter than the corner period TD
Interestingly, the only model that failed before reaching the required target displacement is the fixed model 3M100AR5. From Figure 24 it is observed that the structure failed (crushing of confined concrete) at a displacement of 141 mm, before the target displacement of 148 mm was reached. This possibly suggests that the behaviour factor of q = 5 is not appropriate for all structural walls. Assessing the behaviour factor of fixed-base structural walls does not form part of the scope of this study; however, it is useful to consider the following:
■ The period used for base shear calculations is calculated from an eigenvalue analysis, which produced a period exceeding the allowable limit of 1.4 times the period calculated from empirical formulas given in SANS 10160-4 (SANS 2017).
The shorter period will result in a larger design base shear, therefore requiring more steel reinforcement.
■ For the 3-storey height and aspect ratio of 5 models, the structural wall is only 2.08 m in length. For this case, as the difference in stiffness between the structural wall and the columns is small, it could be argued that this should be treated as a frame structure with lower behaviour factor.
■ The N2 method can produce conservative estimates for the displacement demands, due to the conservative assumption on damping. The average displacement demand from the THAs is 136 mm, whereas the N2 method calculates 148 mm.
■ The approach of Mander et al (1988) will produce conservative estimates for ultimate strain for confined concrete (Priestley & Pauley 1992 p 98).
When assessing the same structure, but explicitly modelling an overstrength foundation (assuming overstrength as 1.2), the SSI model reaches the updated increased target displacement of 164 mm, shown in Figure 24 as the dashed line. This, again, implies that the behaviour factors prescribed by design codes consider additional influences not included in the strict definition of the factor.
Relative ductility capacity and demand
As discussed above, one of the difficulties when assessing behaviour factors is the lack of consensus in defining ductility. For this reason, the term relative ductility is used in this section, as it assesses the ductility with the bilinear curve calculated using the equal energy principles of EN 1998 (EN 2004b,c) when determining the target displacement. This does not necessarily suggest that the same bilinear curve is used when assessing ductility for Eurocode and South African standards. A comparison can, however, be made with the idealised bilinear curves from the fixed base models calculated with the same procedure.
It was observed from the nonlinear analyses that the ductility capacity of the SSI models was significantly larger than the fixed base models but reduced with reducing foundation size. Furthermore, it was observed in the above subsection that, generally, ductility demand increases with reducing foundation size. The proportions of the increase in relative ductility demand against the reduction in relative ductility capacity are, therefore, of interest and are summarised in Tables 8 to 13.


The right columns show a significant improvement in the ductility capacity -ductility demand ratio for most SSI models against the fixed base models, indicating an improved safety against collapse.
It is worth noting that the actual fixed models will, themselves, rest on foundations large enough to resist the fixed moment. This is likely to improve the actual behaviour of the structure under real seismic action, but with a foundation designed to resist an over-strength moment, the mode of failure is likely to be similar to the fixed moment.
Table 12 shows that 3M100AR5 SSI and 3M40AR5 have similar capacity-demand ratios, and model 3M40AR3 indicates a smaller ratio than 3M100AR3 in Table 13, indicating that the advantage of SSI is lost with such large reductions in foundation sizes, also considering the additional reinforcement required in the contributing frame.
Displacement response from THA
The average and maximum displacement responses from the THAs are summarised in Tables 14 to 19.


The only displacement response that exceeds the predicted target displacement is 7M40AR5, where the maximum demand exceeds the target displacement by 3 mm. The structures perform surprisingly well when subjected to the ground motions, indicating that a behaviour factor of 5 is still appropriate. The results are, however, irregular. An apparent abnormality of a maximum response of 43 mm for 7M80AR3 is observed; however, it is observed that the average response does not deviate significantly from the maximum. The model was subjected to various adjustments for variables such as:
■ Ground motion records, matched and unmatched
■ Reduced time step
■ More stringent convergence criteria
■ Upper bound of 2 χ soil stiffness and bearing capacity
■ Various soil damping ratios.
The resulting displacement responses do not deviate significantly from the above.
Further investigations are recommended with more ground motion records and advanced stress-strain curves to represent the soil hysteretic behaviour.
CONCLUSIONS
The paper reports on the investigation of the effects of soil-structure interaction on the behaviour factor in the seismic response of low- to medium-rise commercial buildings with structural wall systems in typical South African conditions. Nonlinear finite element pushover analyses were performed on a total of 24 buildings designed with linear seismic procedure, considering the parameters thereof, the number of storeys (3, 5, 7), structural wall height to length aspect ratio (3 and 5), wall foundation size expressed as a percentage of the fully fixed moment resistance capacity (100%, 80%, 60%, 40%), Ground Type 3 representing a median response curve, and seismic demand based on a behaviour factor of 5.
Based on the results of this investigation, the following conclusions are drawn:
■ All SSI models achieve their target displacement with significant additional capacity, therefore confirming that the behaviour factor adequately (and possibly conservatively) represents the expected ductility when linear (force-based) methods are used.
■ The target displacement increases with the reduction in foundation size.
■ The increase in target displacement for structures with fundamental periods larger than the corner period TD is mainly the result of a reduction in damping with reduction in foundation size. The more slender buildings with wall aspect ratios of 5 illustrate this principle.
■ For structures with fundamental periods smaller than the corner period TD the increase in target displacement is more significant due to the linear relationship between displacement response and fundamental period for periods between Tc and TD. The more rigid buildings with wall aspect ratios of 3 illustrate this principle.
■ The required base shear associated with the target displacement reduces with reduction in foundation size.
■ The influence of foundation damping is relatively small for foundation sizes considered in this investigation.
■ Significant improvements in ductility capacity to ductility demand ratios from the fixed base models to the M80 models are observed.
■ For buildings with a wall aspect ratio of 5, the improvements in ductility capacity to ductility demand for the reduced foundation sizes remain relatively constant per building height.
■ For buildings with wall aspect ratios of 3, the improvements decrease with reduction in foundation size per building height.
■ The improvements decrease with reduction in number of storeys and therefore number of contributing frames.
Further research recommendations:
■ Include a more detailed hysteretic curve to represent the soil response in THAs.
■ Include shaking table tests to confirm results.
■ Consider several frame elements with various spans.
■ Consider the effects of shear failure in the frame.
■ Investigate the cyclic behaviour of unconfined frame elements like slabs.
■ Include kinematic effects.
■ Perform an economic study on the additional reinforcement required in the frame elements against the reduction in foundation size and optimise the economic compromise between the beneficial effects of SSI and the disadvantages in repairing foundation settlement and residual tilt.
■ Certain soil types can undergo liquefaction under cyclic loading, which is detrimental to the safety of the building.
Investigate the areas in South Africa where these soil types may be present.
■ Investigate the influence of different soil types on rocking behaviour.
■ Investigate the effects of shear strength and deformation on ductility.
REFERENCES
ASCE (American Society of Civil Engineers) 2016. ASCE/SEI7-16. Minimum design loads and associated criteria for buildings and other structures. Reston, VA: ASCE. [ Links ]
ASCE 2017. ASCE/SEI 41-17. Seismic evaluation and retrofit of existing buildings. Reston, VA: ASCE. [ Links ]
Bowles, J E 1996. Foundation Analysis and Design. 5th ed. Singapore: McGraw-Hill. [ Links ]
Chopra, A L 2012. Dynamics of Structures. 4th ed. Upper Saddle River, NJ: Pearson Prentice Hall. [ Links ]
EN (European Standard) 2004a. EN 1992-1-1 2004 Eurocode 2: Design of Concrete Structures. Part 1-1: General Rules and Rules for Buildings. Brussels: European Committee for Standardization (CEN). [ Links ]
EN 2004b. EN 1998-1 2004. Eurocode 8: Design of Structures for Earthquake Resistance. Part 1: General Rules, Seismic Actions and Rules for Buildings. Brussels: European Committee for Standardization (CEN). [ Links ]
EN 2004c. EN 1998-5 2004. Design of Structures for Earthquake resistance. Part 5: Foundations, Retaining Structures and Geotechnical Aspects. Brussels: European Committee for Standardization (CEN). [ Links ]
Mander, J B, Priestley, M J N & Park, R 1988. Theoretical stress-strain model for confined concrete. Journal of Structural Engineering, 114(8): 1804-1826. [ Links ]
Mourlas, C, Khabele, N, Bark, H A, Karamitros, D, Taddei, D, Markou, G & Papadrakakis, M 2020. The effect of soil-structure interaction on the nonlinear dynamic response of reinforced concrete structures. International Journal of Structural Stability and Dynamics, 20(13): 2041013. [ Links ]
NIST (National Institure of Standards and Technology) 2012. NIST GCR 12-917-21, 2012. Soil-Structure Interaction for Building Structures. Gaithersburg, MD: NIST. [ Links ]
PEER (Pacific Earthquake Engineering Research) 2020. NGA Database, 2020. Berkeley, CA: University of California. https://peer.berkeley.edu/peer-strong-ground-motion-databases. [ Links ]
Priestley, M J N, Calvi, G M & Kowalsky, M J 2007. Displacement-Based Seismic Design of Structures. Pavia, Italy: IUSS PRESS. [ Links ]
Priestley, M & Pauley, T 1992. Seismic Design of Reinforced Concrete and Masonry Buildings. New York: Wiley. [ Links ]
Retief, J V & Dunaiski, P E 2009. Background to SANS 10160: Basics of Structural Design and Actions for Buildings and Industrial Structures. Stellenbosch: SUN MeDIA. [ Links ]
SANS (South African National Standard) 2000. SANS 10100-1. The Structural Use of Concrete. Part 1: Design. Pretoria: SABS Standards Division. [ Links ]
SANS 2011. SANS 10160-2 2011. Basis of Structural Design and Actions for Buildings and Industrial Structures. Part 2: Self-Weight and Imposed Loads. Pretoria: SABS Standards Division. [ Links ]
SANS 2017. SANS 10160-4. Basis of Structural Design and Actions for Buildings and Industrial Structures. Part 4: Seismic Actions and General Requirements for Buildings. Pretoria: SABS Standards Division. [ Links ]
Seismosoft 2020. SeismoStruct 2020 - A computer program for static and dynamic nonlinear analysis of framed structures. https://seismosoft.com. [ Links ]
Veletsos, A S & Meek, J W 1974. Dynamic behavior of building-foundation systems. Earthquake Engineering and Structural Dynamics, 3: 121-138. [ Links ]
Wolf, J P 1985. Soil-Structure Interaction. Englewood Cliffs, NJ: Prentice-Hall. [ Links ]
 Correspondence:
P W W Visagie
Department of Civil Engineering, Stellenbosch University
Private Bag X1, Matieland 7602, South Africa
E: wesselvisagie@gmail.com
T N Haas
Department of Civil Engineering, Stellenbosch University
Private Bag X1, Matieland 7602, South Africa
T: +27 21 808 4438; E: trevor@sun.ac.za
G P A G van Zijl
Department of Civil Engineering, Stellenbosch University
Private Bag X1, Matieland 7602, South Africa
T: +27 21 808 4436; E: gvanzijl@sun.ac.za

WESSEL VISAGIE (Pr Eng, MSAICE) is a practicing structural engineer. He obtained his BEng (Civil) degree at Stellenbosch University in 2009 after which he started his career in the consulting engineering sector. He developed a keen interest in structural engineering and completed a BEng Hons (Struct) degree at the University of Pretoria and an MEng at Stellenbosch University while in practice.

PROF TREVOR HAAS (Pr Eng, Pr Tech Eng) is an Associate Professor of Structural Engineering at Stellenbosch University. He obtained a National and National Higher Diploma in Civil Engineering from the (then) Peninsula Technikon in 1991 and 1992, an MS in Civil Engineering from Southern Illinois University atCarbondale, USA, in 1999, and a PhD in Civil Engineering from Stellenbosch University in 2007. His research interests include earthquake engineering, numerical modelling, structural dynamics and engineering education.

PROF GIDEON VAN ZIJL (DEng, Pr Eng, FSAICE) is Distinguished Professor of Structural Engineering at Stellenbosch University (SU). After graduating with a Bachelor's and a Master's in Civil Engineering at SU, and a PhD in Civil Engineering at Delft University of Technology in the Netherlands, he joined SU in 2001 as professor of structural engineering. He established the Centre for Development of Sustainable Infrastructure (CDSI) in 2002, with research interests in structural, computational and durability mechanics, also applied in 3D concrete printing.

