


Serviços Personalizados
Artigo
 Inglês (pdf)
 Artigo em XML
 Referências do artigo
Indicadores

Links relacionados
-
 Citado por Google
 -
 Similares em Google
Compartilhar

 Permalink
Journal of the South African Institution of Civil Engineering
versão On-line ISSN 2309-8775
versão impressa ISSN 1021-2019
J. S. Afr. Inst. Civ. Eng. vol.64 no.2 Midrand Jun. 2022
http://dx.doi.org/10.17159/2309-8775/2022/v64no2a2
TECHNICAL PAPER
Geotechnical properties of Cape Flats sands
N Fouché; P W Day
ABSTRACT
The sand-covered coastal plain connecting the Cape Peninsula mountain chain to the southwestern Cape mainland is known as the Cape Flats. The whitish windblown sands covering this area of approximately 460 km2, referred to as the Quaternary sands of the Cape Flats, provide founding for the rapid and ongoing development in the area. A knowledge of the geotechnical properties and engineering behaviour of these sands is essential for design of suitable foundations for proposed structures and earthworks associated with such developments.
By combining, analysing and interpreting the wealth of existing and available geotechnical information from previous and new soil investigations undertaken in the area, the Quaternary-aged sands of the Witzand, Springfontyn and Langebaan Formations from the Cape Flats were characterised in terms of their physical properties and engineering behaviour. The sands from the study area were classified based on their grading, Atterberg limits, maximum dry density and optimum moisture content, minimum dry density, California Bearing Ratio (CBR), erodibility and corrosivity, and characterised in terms of their compressibility, shear strength, permeability, volumetric behaviour during shear including liquefaction potential, in-situ density and moisture content and specific gravity.
The Cape Flats sands were found to be highly variable (with both inter- and intra-formation variation), with a wide range in many material properties, principally a function of soil texture, gradation and degree of cementation. The findings of this research may be used to form initial appreciation of the likely properties of the material and potential problem areas.
Keywords: Cape Flats, sands, geotechnical characterisation
INTRODUCTION
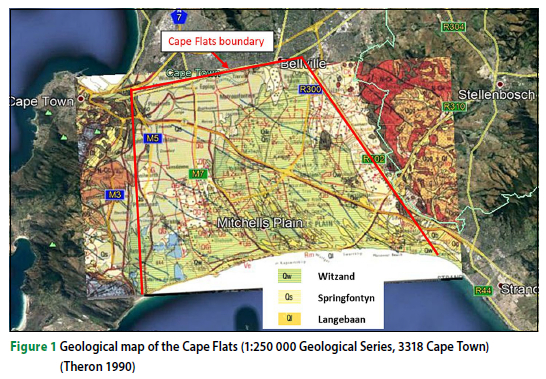
Hill and Theron (1981) described the Cape Flats as a low-lying, sand-covered expanse, linking the southwestern Cape mainland with the mountainous Cape Peninsula. More specifically, it can be defined as the area bounded by the Muizenberg - Cape Town, and the Cape Town - Bellville -Eerste River railway lines (Hill & Theron 1981) as shown on the Google Earth image (with geological map overlay) in Figure 1. Within this area of approximately 460 km2, the whitish transported sands are referred to as the Quaternary sands of the Cape Flats. The same transported sand deposits extend northwards along the west coast through Bloubergstrand to Atlantis; however, these sand-covered areas do not lie within the geographical boundaries of the Cape Flats and did not form part of the area considered in the research presented in this paper.
The topography of the Cape Flats is typical of a coastal plain; that is flat and low-lying. The area is characterised by a dune system which is poorly defined in some areas. The average elevation of this low relief area is approximately 30 metres above mean sea level (m amsl) with the highest sand dunes reaching about 65 m amls (Adelana et al 2010). In several dune depressions, saturated soils and shallow inundation lead to the formation of flat, marshy areas known as wetlands.
The Cape Flats aquifer, a predominantly unconfined sandy aquifer extending from the False Bay coastline northwards to the Tygerberg Hills in the northeast and Milnerton in the northwest, received significant attention during the 2017/2018 water crisis in Cape Town. The porous and permeable sands underlying the Cape Flats form a large water storage unit, which extends to a maximum depth of approximately 55 metres (Hay et al 2015). An abstraction project was launched during the drought period, which is currently in a developmental phase.
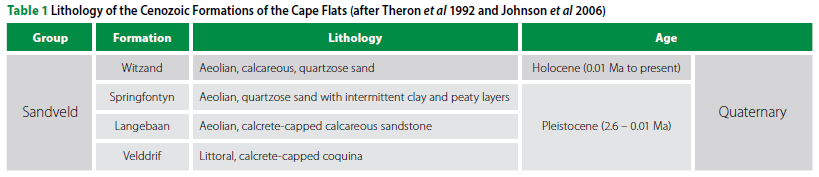
On the Cape Flats, sediments of Quaternary age overlie Neogene deposits, which in turn rest on a basement of Precambrian and Paleozoic rocks. The Quaternary deposits, divided into the Holocene and Pleistocene epochs, are mainly aeolian sands and calcarenites of the more recent Witzand, Springfontyn and Langebaan Formations, but with minor littoral sand and calcrete-capped coquina of the older Velddrif Formation (see Figure 1). The research was concerned the valuable geotechnical data obtained has largely remained unexplored and unpublished. Noteworthy research contributions of an engineering geological nature have been made by Amdurer (1956), Brink (1985) and Stapelberg (2009). There are, however, geographical and investigative limits associated with this prior research. Several other studies have been undertaken, involving the upper sands of the Cape Flats, but these focused mainly on specific aspects, such as liquefaction potential (Parker 1991; Schoeman 2018), groundwater in the Cape Flats aquifer (Henzen 1973; Adelana et al 2010) and the use of geotextiles in the sands (Kalumba 1998). This is in contrast with numerous other sand bodies, such as the Kalahari sands masking the interior of Southern Africa, which have been with the recent aeolian deposits which typically cover the surface of the study area. These sands are derived from: (1) the weathering and subsequent deposition of Malmesbury and Table Mountain Group sediments, under marine condition, and (2) beaches in the area from where sands were blown inland and deposited as dunes on top of the marine sands (Adelana et al 2010). According to Rogers (1980) (after Theron et al 1992), borehole data revealed a maximum thickness of approximately 65 m in the Springfontyn Formation in Atlantis. The deep-seated basement rocks underlying the Quaternary and Neogene deposits comprise the Cape Granite Suite in the extreme west and metasediments of the Malmesbury Group (Hill & Theron 1981). Small outcrops of these Precambrian and Palaeozoic rocks have been identified in several localities. Residual granites and shales are commonly exposed in shallow test pits in the area. The formations of the Quaternary period of the Cenozoic Era are shown in Table 1.
Literature on the geotechnical and engineering geological properties of the upper Quaternary age sands of the Cape Flats is limited. Many geotechnical investigations have been undertaken in the area; however, researched extensively. Like the Kalahari sands, the Cape Flats sands are of major engineering importance, and the value of investigating its engineering properties is evident.
The following broad description is often applied to the Cape Flats sands: light-coloured, poorly graded (uniform), fine and medium quartzitic aeolian sand, with the group symbol 'SP' assigned to it based on the Unified Soil Classification System. This description provides an indication of the basic properties of the material underlying the Cape Flats and creates the impression of a uniform deposit of mainly sandy soils. However, these soils have been found to be highly variable, with a wide range of values assigned to many material properties.
The research presented in this paper represents the first contribution towards comprehensively describing, classifying and characterising the Quaternary-aged sands of the Cape Flats area in terms of their physical properties and engineering behaviour by utilising geotechnical information from previous and new soil investigations undertaken in the area. Classification is undertaken according to various standard classification systems based on grading, Atterberg limits, maximum dry density and optimum moisture content, minimum dry density, California Bearing Ratio (CBR), erodibility and corrosivity. Characterisation is based on the geotechnical properties of the sands, including in-situ density and moisture content, specific gravity, compressibility, shear strength, permeability and volumetric behaviour during shear including liquefaction potential.
METHODS
Method overview
The research methodology flow chart is shown in Figure 2.
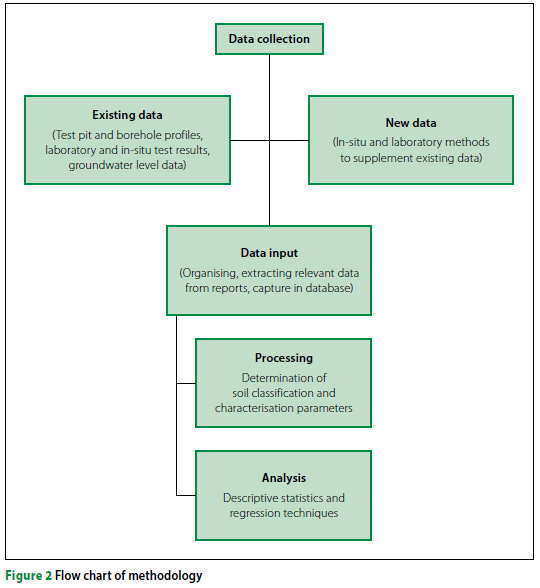
Data collection
Over the period extending from January 2016 to June 2019 investigation data was gathered from 14 geotechnical practices operational in the Cape Flats. In-situ and laboratory data from 155 site investigations undertaken within the boundaries of the study area was collected and recorded. The obtained investigation reports date back to 1965. The data obtained included: (1) test pit and borehole profiles which included MCCSSO (moisture content, colour, consistency, structure, soil type and origin) descriptions, groundwater level information and other pertinent details such as sidewall stability, refusal and sampling depths, (2) in-situ test results from penetrometer tests (such as SPT, CPT and DCP), plate load tests, double-ring infiltrometer (DRI) tests, and nuclear density tests (Troxler), (3) laboratory test results from index tests, compaction tests, CBR tests, collapse potential tests, direct shear tests and chemical analysis, and (4) perched and permanent groundwater levels from investigation reports (e.g. monitoring wells and CPTu pore water pressure dissipation tests) and from the National Groundwater Archive (NGA). Most of the data is from the shallow soil profile (0 to 3 m below ground level).
To supplement the existing data, samples of soil and groundwater were collected for laboratory testing, and in-situ tests were performed on sites in Mfuleni, Blue Downs, Mitchell's Plain, Gatesville, Bellville South, Matroosfontein and at the Capricorn Business Park in Muizenberg. The aim was to provide additional data where information on a specific property was limited or absent. In-situ testing comprised CPTu testing to estimate friction angle, stiffness and liquefaction potential, continuous surface wave (CSW) tests to measure shear wave velocity from which shear stiffness can be inferred, DRI tests to measure the infiltration capacity of the shallow sands, and nuclear density tests. Laboratory tests performed on soils sampled from the study area included grading analysis (sieve and hydrometer), funnel test for minimum index density, collapse potential test, constant head permeability test, water pycnometer for specific gravity, direct shear test (reconstituted sands), and triaxial strength and resilient modulus tests (partially saturated, compacted sands). Chemical tests were also performed on groundwater to assess the corrosion potential.
Data for processing and analysis came from:
■ 978 site investigation points [test pits, boreholes, in-situ tests (not including SPTs within a BH), and groundwater monitoring wells/sampling locations] -591 from the Witzand Formation, 289 from the Springfontyn Formation and 98 from the Langebaan Formation
■ 178 boreholes
■ 547 test pits
■ 1 740 in-situ test results
■ 1 552 laboratory test results
■ 471 groundwater level measurements. For the approximately 460 km2 study area, there are about two site investigation points per km2 (based on total area divided by number of investigation points), and eight data points (in-situ, laboratory or groundwater level result) per km2. Aerial photographs with site investigation points can be viewed in Fouché (2021).
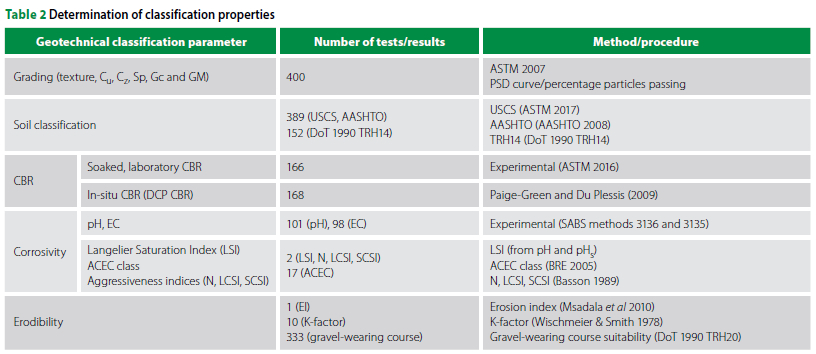
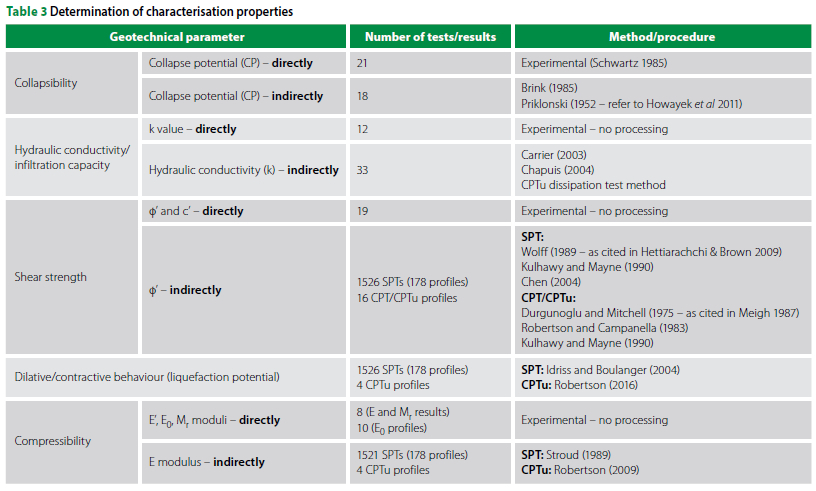
The raw data from past and new investigations was captured in a Microsoft Excel database. The additional information that was captured included geological formation, testing and sampling depth, position of the water table and in-situ moisture content where available. Data processing involved the application of various state-of-the-art methods and transformation models to determine and/or estimate the soil classification and characterisation parameters from the raw data. The methods and procedures used to calculate each geotechnical parameter are given in Table 2 on page 15 (classification properties) and Table 3 (characterisation properties).
Once all classification and characterisation parameters were determined, data analysis commenced, involving descriptive statistics to summarise and draw conclusions from the data, and regression techniques to find statistically significant relations between the studied parameters.
RESULTS AND DISCUSSION
Classification parameters
Grading
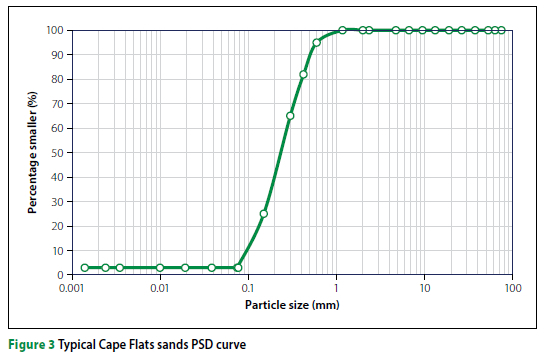
A typical PSD (particle size distribution) curve for Cape Flats sands is shown in Figure 3, which illustrates the typical shape and slope of the curve. The steep curve reflects the predominance of particles with sizes between 0.6 mm and 0.075 mm. The typical fines content (< 0.075 mm) is around 5%. For this soil, the coefficient of uniformity (Cu) is 2.9 and the coefficient of curvature (Cz) is 1.1, indicative of a poorly (uniformly) graded soil. The predominance of fine sand size particles and uniform gradation of the sands contribute to higher void ratios (lower density), which will influence all aspects of engineering behaviour. The Cape Flats sands typically display no reduction in length upon drying, with a shrinkage product (Sp) of zero, irrespective of grading. A characteristic lack of coarse sand and gravel size particles will result in the grading coefficient (Gc) also being equal to zero. The relatively low grading modulus (GMav = 1.2) is also the result of a general lack of a coarse fraction.
Four hundred grading results were grouped per formation and into 1 m depth intervals to study inter-formation and vertical variation in texture. The result is shown for the Springfontyn Formation in box plots (see Figure 4). Similar graphs for the other formations can be found in Fouché (2021). The 25th percentile (1st quartile), median (2nd quartile), and 75th percentile (3rd quartile) values are represented by the horizontal lines of the box. The vertical lines outside the box (whiskers) extend to the minimum and maximum values. The mean value is illustrated by the cross on the plot. Outlier values are plotted as individual points either above or below the maximum and minimum points.
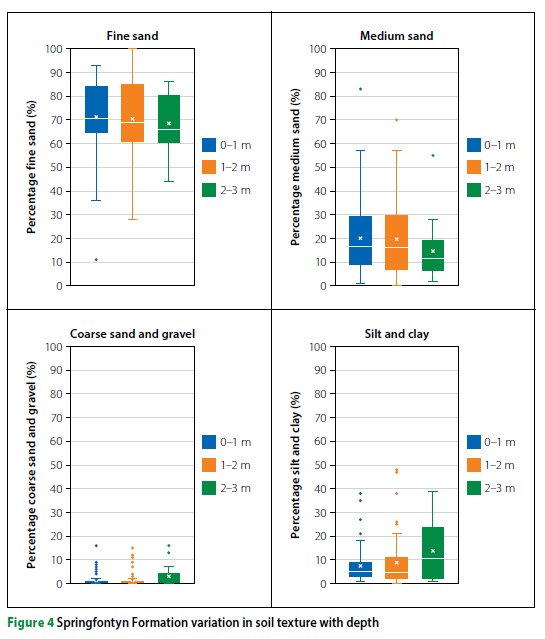
The predominance of fine (0.075 mm to 0.425 mm), and to a lesser degree, medium (0.425 mm to 2 mm) sand size grains is evident from Figure 4. The coarse sand- and gravel-size content is typically very low, and the average fines content is around 10% in this formation. Particle size outliers are mostly associated with the few gravelly soils or sands with significant fines content. By studying and comparing the results for the Witzand, Springfontyn and Langebaan Formations, the following emerges for the shallow soil profile:
■ The sands from the Witzand Formation possess a higher degree of uniformity compared to the Springfontyn and Langebaan Formations. This is shown by the higher average fine sand content and the lower medium sand and fines content associated with the Witzand Formation (refer to Fouché 2021). Analysis of variance (ANOVA) testing confirmed significant differences between the Witzand and Springfontyn Formations in terms of fine sand and fines content.
■ Springfontyn Formation sands generally have higher silt and clay content and less 'clean' sands compared to both the Witzand and Langebaan Formations.
■ The Witzand Formation sands are more often silty than clayey (and plastic), whereas the opposite is true for the Springfontyn and Langebaan Formation deposits.
■ Soils with notable gravel fractions are more prevalent in the Witzand and Langebaan Formations, mostly representing the presence of calcrete gravel.
■ A disparity with previous research is noted. The Langebaan Formation sands were not found to be coarser than the Witzand and Springfontyn Formation sands, as suggested by Roberts (2001) and Franceschini (2003). This can possibly be ascribed to lateral variability in the Langebaan Formation, with coarser sands probably distinctive of some areas.
■ There is a slight decrease in the average fine sand content with depth in all formations.
■ There is a slight increase in the average clay and silt content from surface to 3 m depth in all formations.
■ Although these trends can possibly be explained by geological processes such as fine sands remaining mobile whilst coarser fraction settles under gravity, the data becomes much sparser with depth and these findings are therefore inconclusive.
Plasticity properties
The aeolian sands of the Cape Flats contain limited soil fines and are typically non-plastic or slightly plastic. The typically lower clay content in the Witzand and Langebaan Formations, compared to the Springfontein Formation, is shown in the low percentage of soils with measurable PI in these formations. Ten percent of soils have measurable PI in the Springfontyn Formation, whereas only 1.6% and 2.5% of soils in the Witzand and Langebaan Formations, respectively, have measurable PI.
For soils with a quantifiable plastic phase, the range in the Atterberg Limit and clay content values is PI: 3-14%, PL: 9-37%, LL: 19-36°%, LS: 1-5%, and clay content: 3-30%. Interestingly, when comparing individual clay content to PI pairs for soils from the three formations, similar clay content consistently produced higher PIs in the Witzand Formation. This is most likely due to clay mineral type, with kaolinite likely dominant in the Springfontyn and Langebaan Formations, and illite or possible smectite (montmoril-lonite) presumably present in the Witzand Formation. Further research is necessary to either confirm or reject this initial finding. Based on the criteria by Van der Merwe (1964), and Dakshanamurthy and Raman (1973), the soils were found to be non-expansive. Clayey sands containing increased quantities of illite and/or smectite clays will be prone to hydration expansion.
The plasticity properties of the clayey and cohesive soils (alluvial, lacustrine and estuarine deposits) found interlayered with the sandy horizons, and of the residual Malmesbury soils, were studied by Amdurer (1956) and fall outside the scope of this paper.
Maximum dry density and optimum moisture content
The maximum dry density and optimum moisture content results from 167 samples are presented in this section. The compaction data was separated by formation and initially into 1 m depth intervals, but no noteworthy variances or trends with depth emerged. The data for the upper 2 m was therefore combined and are presented as box plots in Figures 5 and 6.
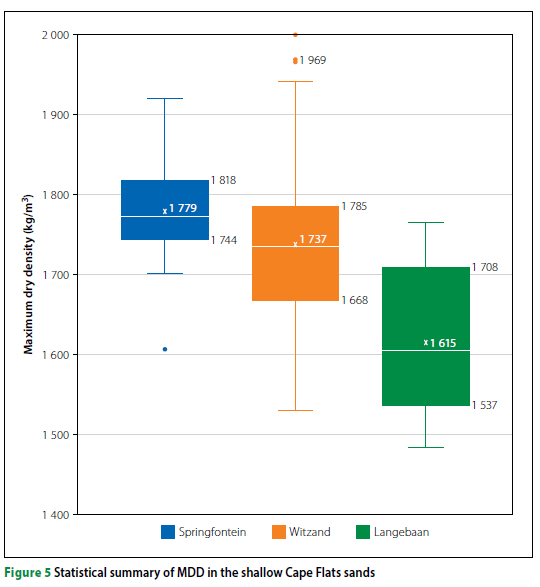
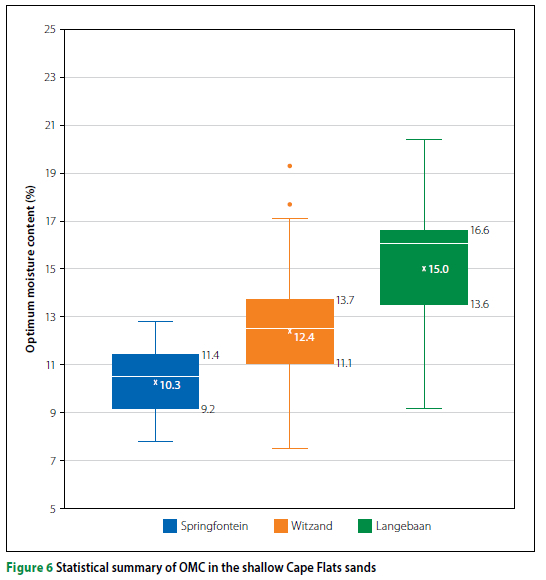
When compacted to its maximum density, the Cape Flats sands typically do not achieve densities as high as other soils, rarely exceeding 1 900 kg/m3. The predominance of fine sand-sized particles hinders further densification. The presence of angular grains and micro shells can also be a contributing factor.
The highest MDDs at the lowest OMCs were typically achieved in the Springfontyn Formation, followed by the Witzand and then the Langebaan Formation. ANOVA statistical testing revealed that the variation between the means of all three data sets is significant. Higher compaction densities were often associated with an increase in the range of particle sizes, and hence the highest densities in the Springfontyn Formation. The compacted densities achieved for the Witzand Formation sands reflect the typically narrower range of particle sizes in this formation. The few high densities in this formation are due to some soils with coarse sand and gravel fractions. The results for the Langebaan Formation sands could not be explained by the grading and will be influenced by factors such as the distribution of grain sizes, average particle size and particle shape. Grading parameters were found to be poor predictors of MDD and OMC.
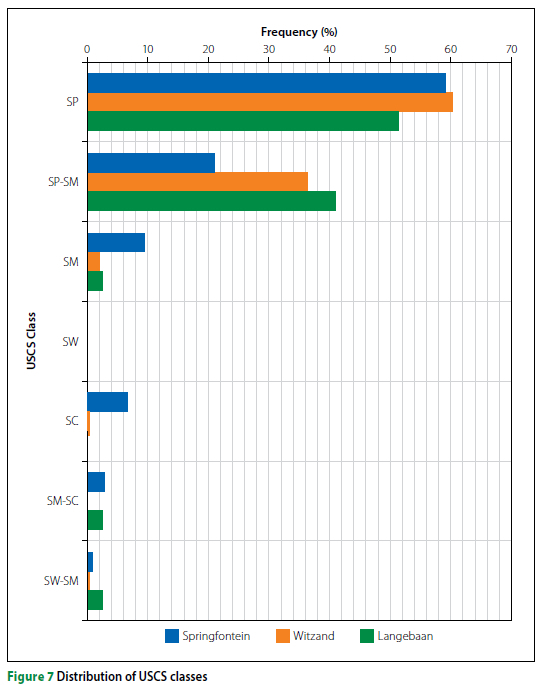
Soil classification
The shallow Cape Flats soils were classified according to the Unified Soil Classification System, the TRH14 classification system (DoT 1990 TRH14), and the AASHTO Soil Classification System. The results of the more general USCS, as well as the TRH14 system for road layerworks, are presented as Figures 7 and 8 (refer to Fouché 2021 for the distribution of the AASHTO soil classes).
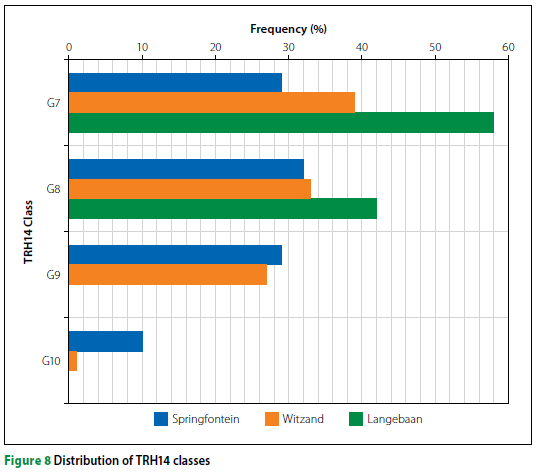
Classification according to the TRH14 system (DoT 1990 TRH14) reveals that all soils from the Cape Flats fall in the "gravel-soil" category of G7 to G10 quality materials. The sands from the Witzand and Springfontyn Formations are distributed relatively equally between the G7, G8 and G9 classes. The Langebaan Formation sands are all G7 and G8 quality, possibly influenced by the limited number of soils classified. No noteworthy variation in soil classes with depth was observed. Lower selected layer materials (G8 and G9) may be sourced from borrow pits in any of the three formations. Borrow pits in the Langebaan Formation are more likely to yield upper selected material (G7) than those in other formations.
In the Cape Flats sands, the CBR at 93% of MDD is mostly the sole factor preventing G8 to G10 soils to be classified as G7 material, except for the rare occasions where the PI exceeds 12%. Most of the Cape Flats sands conform to the definition of a "sand" in SABS 1200M: Roads (General), and as such these materials should be compacted to 100% MDD when used in selected pavement layers. If the CBR at 100% MDD is used in the classification, 90% of the samples from the Springfontyn Formation, 95% from the Witzand Formation and virtually all the samples from the Langebaan Formation would classify as G7 materials. Furthermore, for classification as G5 or G6 material, the low grading index was a limitation for at least half of the soils.
California Bearing Ratio (CBR)
Laboratory-soaked CBR
A statistical summary of laboratory-soaked CBR values at different percentages of Modified AASHTO MDD is shown in Figure 9 for the Witzand Formation. Similar graphs for the other formations can be found in Fouché (2021). One hundred and sixty-six samples were included in the analysis, all from a depth of less than 3 m.
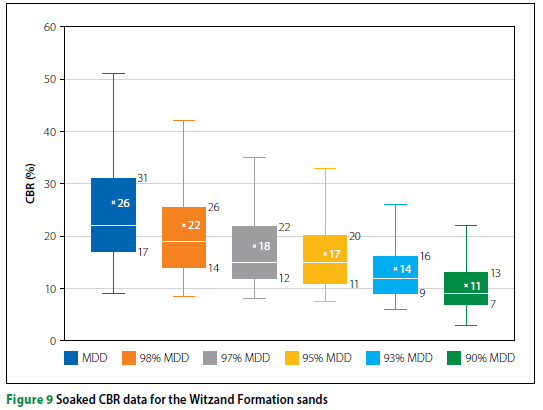
Despite the dry densities typically being the highest in the Springfontyn Formation and the lowest in the Langebaan Formation, the CBR results show an opposite trend. The bearing strength of the Langebaan Formation sands are typically the highest, followed by the Witzand Formation sands. Statistical analysis showed that, overall, the variation in CBR between formations is not well defined and varies with compaction level.
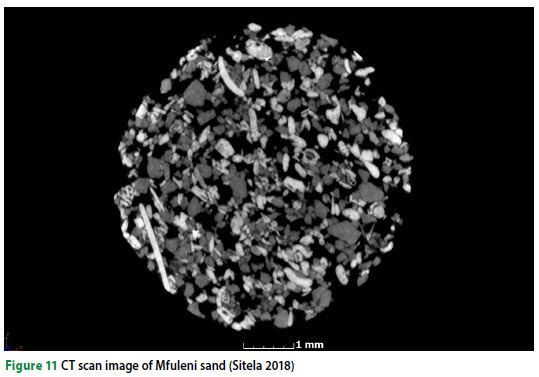
The higher CBR results obtained for the Langebaan and Witzand Formations can possibly be explained by the presence of angular micro shells increasing interlocking and friction and/or nodular calcrete affecting the maximum particle size. The presence of angular micro shells has been confirmed through a CT scan image of Witzand Formation sands (refer to Figure 11).
Although it is evident from Figure 9 that bearing strength decreases with decreasing compaction, a strong relationship between individual CBR and dry density values did not emerge, reflecting the influence of factors such as interparticle friction, particle shape and grain size distribution on CBR (in addition to density).
In-situ CBR
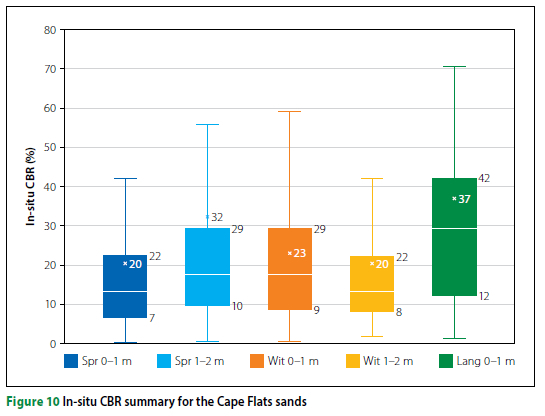
In-situ CBR values were derived from the results of 168 DCP tests undertaken on 33 sites to a maximum depth of about 4 m below ground level. Summarising and interpreting the DCP CBR results provide an indication of subgrade strength of the in-situ soils, and material classification in accordance with TRH14 (DoT 1990 TRH14) can be obtained from approximate correlations. The predictive model proposed by Paige-Green and Du Plessis (2009) was used to estimate CBR from the cone penetration rate (DN in mm/blow). In the Witzand and Langebaan Formations, refusal of the DCP probe often occurred in the upper 1 m, presumably on calcretised sands, which reflected in the DCP CBR values (see Figure 10). A gradual increase in DCP CBR with depth was noted in the Springfontyn Formation, and probably reflects the effect of friction on the rods in the fine sands and silty and clayey sands.
The estimated material G classes from DCP CBR - using the proposed relationship by Paige-Green and Du Plessis (2009) - were found to be lower than those from the TRH14 system. This could be due to the in-situ density being lower than that used in the TRH14 classification (DoT 1990 TRH14).
Other soil classification properties
The main findings associated with the remainder of the soil classification properties are as follows:
■ The minimum index density of the fine and medium sands, all with minor fines content (sampled in the Witzand and Springfontyn Formations), varies from about 1 420 to 1 590 kg/m3. An increase in minimum dry densities was typically associated with higher Cu values.
■ From the CT scan image of disturbed Witzand Formation sands shown in Figure 11, it is evident that most particles are sub-rounded to sub-angular in shape, with a fair proportion of angular grains. Micro shells are also present. Typically, for a given Cu, the minimum index density will decrease with increasing particle angularity. Soil erodibility will also be influenced by particle shape, and the angular shapes shown in the CT scan image will provide particle interlocking, making it more difficult for sand grains to detach and be transported.
■ The erodibility of the Cape Flats sands was typically low (and rarely moderate), which can mainly be attributed to the low silt and very fine sand content - representing the particles most vulnerable to detachment - and the high permeability resulting in rapid infiltration and less runoff.
■ Unpaved roads with Cape Flats sand as a wearing course will be prone to corrugation (formation of loose or fixed parallel crests and troughs) and ravelling (the generation of loose particles under traffic).
■ The soils from the Cape Flats are often moderately and strongly alkaline (pH > 7.9), particularly in the Witzand and Langebaan Formations, posing a corrosion risk to buried steel. The presence of calcium carbonate in the sands from these formations contribute to the alkaline conditions. From the resistivity results, the widespread presence of soils and groundwater with low electrical resistivity is noted, often classified as moderately to extremely corrosive based on resistivity alone. The aggressiveness of the soil and groundwater should be evaluated in combination with all other influencing factors to determine a more meaningful corrosion risk (Basson 1989).
■ Groundwater level data from 471 locations, taken over a 10-year period, shows that the average GW level in winter is 2 mbgl and in summer drops to 3 mbgl. Significant variation in the depth to groundwater is expected in the study area, with the water table rising above ground level in places.
Characterisation parameters
Collapse settlement
The collapse potential of the Cape Flats sands was evaluated using the predictive methods by Brink (1985) and Priklonski (1952 - refer to Howayek et al 2011) and by means of collapse potential tests.
Empirical methods
Brink's (1985) method, which is based on a critical value of dry density (1 672 kg/m3) below which soils have been found to be prone to collapse settlement, shows that, despite the low dry densities suggesting significant collapse potentials, the low clay content associated with the Cape Flats sands prevents the formation of a collapsible fabric. These soils are therefore simply compressible in the absence of other chemical bonds. Brink's method is therefore not valid in the predominantly clean sands of the Cape Flats.
The relation given by Priklonski (1952 -refer to Howayek et al 2011) is based on the liquidity index (the ratio of the difference between the natural water content of the soil and its plastic limit to its plasticity index). All plastic soils included in the assessment were found to be non-collapsible. A reduction in the moisture content of these soils could ultimately reduce the liquidity index to below zero, marking the presence of highly collapsible soils. Seasonal ground-water fluctuations must be considered. Soils deemed collapsible at a certain point in time using this method may not be collapsible at other times. For this reason, and due to the predominance of clean sands in the study area, this method is not considered ideal for use with the Cape Flats sands.
Collapse potential tests
Twenty collapse potential tests were undertaken in the oedometer. The limited number of collapse potential tests stems from the difficulty in obtaining undisturbed samples from these typically cohesionless soils. Some rearrangement of soil particles during the sampling and preparation procedures is, however, inevitable, which will have an effect on the test outcomes. The soils were all collected from the upper 3 m of the soil profile (mostly the upper 1.5 m) from Witzand and Springfontyn Formation deposits (fines content < 6%). The void ratio-effective stress curves for tests undertaken by the authors are shown in Figure 12. Based on the classification of severity of collapse by Schwartz (1985) (after Jennings 1974), all soils were placed in the 'no problem' category (CP < 1%). It should be noted that most of the initial dry densities are below the critical value suggested by Brink (1985), confirming the unsuitability of this predictive method. From the void ratio-effective stress curves, noteworthy normal settlement is evident prior to saturation due to the reduction in void space in the absence of strong particle bonds. The natural moisture content of the sands varied from about 1% to 10%.
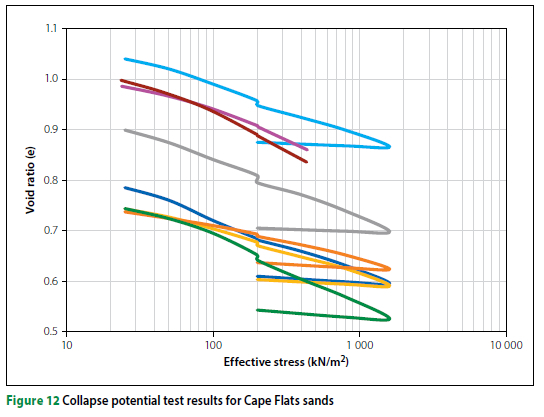
The tested soils are therefore compressible at natural moisture content and possess a very low collapse potential when saturated. The results are considered representative of sands from the Witzand Formation (excluding soils with other bonding agents). The typically higher fines content of the sands from the Springfontein Formation is likely to result in more soils with collapsible fabrics. The calcareous soil horizons from the Langebaan Formation, with calcium carbonate as cementing agent, may also be prone to collapse settlement. Due to the lack of plate load test results on the Cape Flats sands, the collapsibility of sands with salts or CaCO3 or Fe2O3 as bonding agents could not be established.
Shear strength
The shear strength parameters of Cape Flats sands were determined by consolidated drained direct shear tests (some from past investigations) and monotonic triaxial compression tests. In addition, shear strength was estimated using transformation models based on SPT and CPT/CPTu data. Note that the results of the static load triaxial tests, performed on partially saturated, modified (94% Mfuleni sand with 6% added non-plastic soil fines) and compacted sand, can be obtained from Fouché (2021).
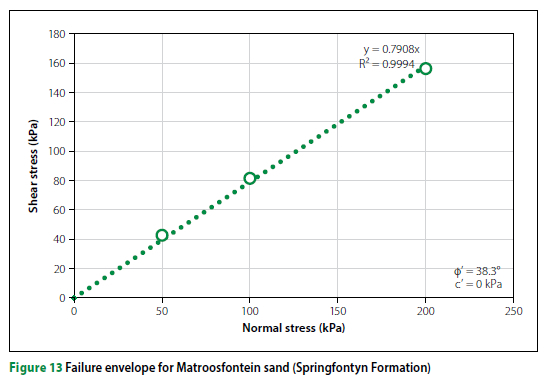
Shear strength of reconstituted sands
Eleven direct shear tests were carried out on soaked reconstituted sands from the study area. The result for one test on sand from Matroosfontein (33°57'23.3"S, 18°35'32.6"E) is shown in Figure 13. For sands with a range of textures including clayey or silty sands, fine uniform sands and well-graded sands and with densities ranging from 1 350 to 1 750 kg/m3, the peak friction angles vary from about 30° to 40°, with cohesion values up to about 13 kPa. For soils compacted to similar dry densities, coarser soils and/or soils with a wider range of particle sizes are typically associated with higher friction angle values. The stress-strain curves typically showed a gradual increase in shear stress to failure, indicative of loose contractive sands.
Transformation models
The shear strength of the Cape Flats sands was also estimated using transformation models based on SPT, CPT and CPTu data. It should be noted that friction angles (and all other parameters such as elastic modulus) were calculated from SPT N values assumed to be N60 values (although energy input is not measured in SA).
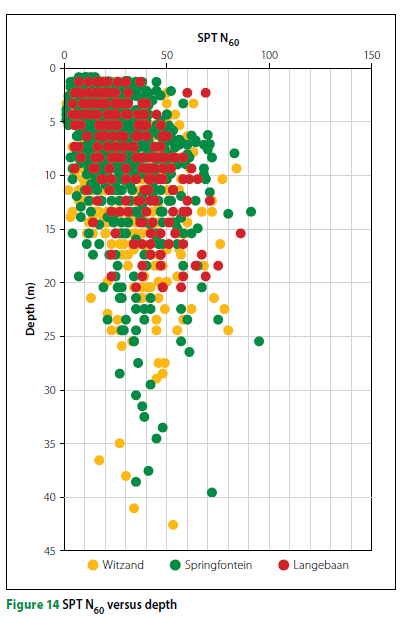
In Figure 14, SPT blow counts (not corrected for overburden pressure) are plotted with depth for the three formations. An overall trend of increasing SPT N with depth is shown for all formations, mainly due to increasing confinement with depth. Notwithstanding this, significant variation in soil consistency was noted both horizontally and vertically in the study area, with frequent trend reversals. Softer soils often underlie denser deposits. Variation in penetration resistance with depth in normalised profiles is mostly associated with changes in soil type and/or degree of cementation. Looking at inter-formation variation, statistical testing revealed significant variation in the means of all three data sets, in particular variation between the Springfontyn Formation (with an average N of 26) and the Langebaan Formation (with an average N of 33).
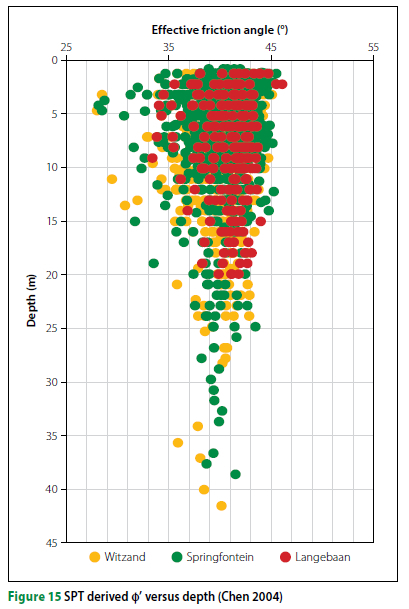
In Figure 15, friction angles estimated using Chen's (2004) SPT-based method are plotted against average SPT depth. This method was found to produce estimates closest to the friction angles from the direct shear test. The average φ' varies between the narrow limits of about 39° and 41° for all depth intervals, and there is no pronounced increasing φ' trend with depth. The outcome can largely be ascribed to the variations in moisture content, soil density and grain characteristics with depth and laterally across the study area. At shallow depths, low φ' values of about 28° are representative of very loose and loose sands, and high φ' values up 46° are possibly associated with cemented soils. When comparing the results for the different geological formations, slightly higher friction angles were noted for the soils from the Langebaan Formation. This can be ascribed to either the presence of soil cementation or the lower number of data values available for the soils from this formation. Statistical testing confirmed the notion, with the difference between the means of the Langebaan Formation and Witzand Formation in particular being statistically significant.
Friction angles were also derived from Robertson and Campanella's (1983) CPT based transformation model, and Kulhawy and Mayne's (1990) CPTu method. Overall comparison of SPT, CPT and CPTu derived friction angles shows that the means of the three friction angle data sets vary significantly. SPT-derived friction angles have the lowest mean of about 40° and are closest to the direct shear values when compared at similar relative densities. CPT and CPTu data sets both have average friction angles exceeding 42°. From the current assessment, it appears that Chen's (2004) SPT-based method is most suitable when estimating friction angles from penetration tests in Cape Flats sands.
Dilative/contractive behaviour (liquefaction potential)
The aim of investigating the volumetric behaviour and liquefaction potential of the Cape Flats sands was to determine the probable occurrence and extent of cyclic liquefaction during a ground-shaking event. By plotting normalised cone resistance and friction ratios from four CPTu tests (undertaken in the Witzand Formation to approximately 10 m depth) on Robertson's SBTn chart (Robertson 2016), the sands were found to be mostly dense and dilative. These soils may be prone to cyclic liquefaction with deformations occurring during cyclic loading, when a brief loss in shear resistance occurs. Deformations will stabilise when the cyclic loading ends. Loose, contractive sands were noted, but limited in extent.
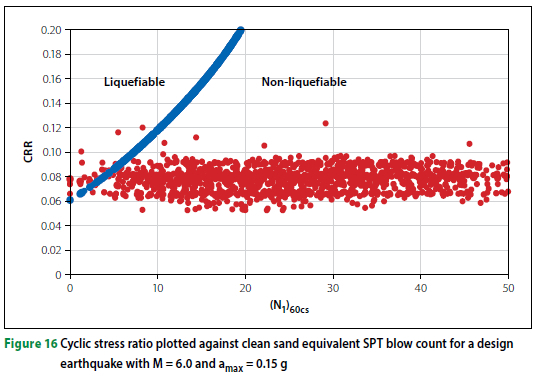
The cyclic liquefaction potential of the Cape Flats sands was studied in terms of the triggering of liquefaction. Figure 16 shows the liquefaction triggering curve in blue with cyclic stress ratio (CSR)-(N1)60cs data points for a design earthquake with a moment magnitude of 6.0 and a PGA of 0.15 g. The design earthquake compares to the magnitudes and horizontal ground accelerations recorded for historic seismic events associated with the intraplate fault line extending through the study area (SANS 2010; Brandt 2011). Of the 1 526 data pairs obtained from 178 boreholes plotted in Figure 16, only 19 pairs from 14 boreholes showed the potential to liquefy during an earthquake with the magnitude and acceleration mentioned above. It is evident that the Cape Flats soils are typically resistant to liquefaction during an earthquake of the specified magnitude and acceleration. Liquefiable soils were identified in all three formations, between upper and lower depth limits of about 3.2 m and 19 m, with layer thicknesses varying from about 0.3 m to 2 m. Liquefaction can only occur in saturated soils and therefore the outcome will be influenced by changes in water levels.
Compressibility
The assessment of compressibility focuses on the soil elastic modulus (E'). The results associated with the resilient modulus (Mr) acquired from repeated load triaxial tests, and the small strain elastic modulus (E0) obtained from CSW tests, can be found in Fouché (2021).
The soil elastic modulus was determined through triaxial testing on modified Witzand Formation sands and estimated using SPT and CPT-based transformation models (refer to Table 3 on page 16).
Soil elastic modulus
Triaxial testing
Monotonic triaxial tests were performed on modified sands (94% fine sand with 6% inert soil fines added) prepared at two densities (1 560 kg/m3 and 1 660 kg/m3), each at OMC and 75% of OMC. The four sample types (density and moisture content variants) were subjected to allround pressures of 50 kPa, 100 kPa and 150 kPa, and a static vertical load applied until specimen failure occurred. The results (plots of deviator stress against axial strain) showed that the 9% moisture content (75% of OMC) specimens experienced a dilative response to shear at both 1 560 kg/m3 and 1 660 kg/m3. At 12% moisture (OMC) the stress-strain curves are indicative of a more ductile material (larger strains before failure occurs) (see Figures 17 and 18). An increase in soil strength with increasing soil density was noted, the result of increased inter-grain sliding friction, interlocking friction and rolling friction. Lower peak stress was noted for the 9% moisture specimens (at both soil densities), indicating a reduction in strength with decreasing moisture content. Soil strength typically increases as soil moisture decreases due to reduced lubrication of interparticle contacts and an increase in suctions. The lower moisture content samples were, however, subjected to higher compaction energy (longer periods of compaction), likely leading to particle damage (abrasion and breakage) and reduced frictional resistance and strength.
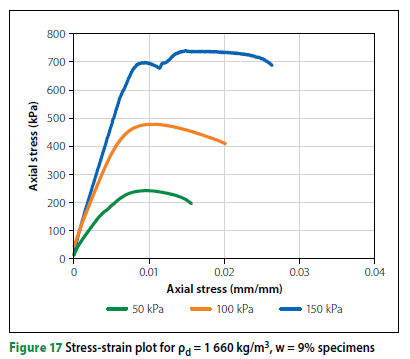
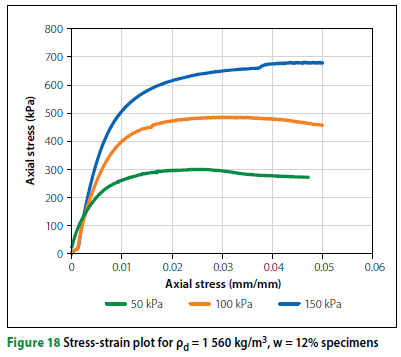
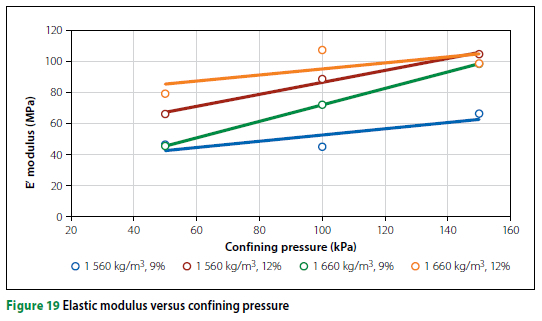
The elastic modulus of the material was obtained from the gradient of the initial straight-line portion of each stress-strain curve and plotted against confining pressure (see Figure 19). Typically, an increase in soil stiffness is related to an increase in confining pressure, as indicated by the trendlines in Figure 19, and noted in Figures 17 and 18 (gradients of the stressstrain curves). This result is expected, as a rise in confining pressure increases the resistance to vertical pressure. It should be noted that the triaxial elastic moduli values may be a slight overestimation of true stiffnesses because of the membrane which enclosed the specimens during testing.
Transformation models
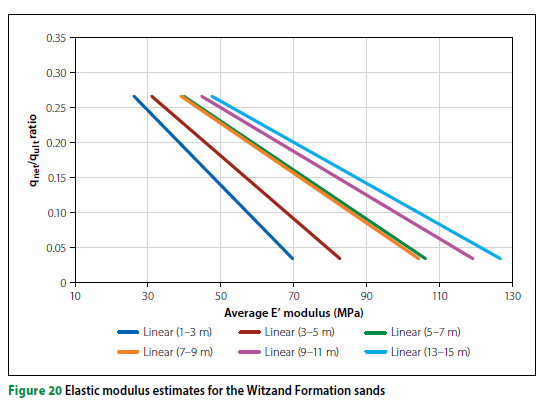
The SPT-based method proposed by Stroud (1989) was applied in the study, as it recognises the influence of strain on stiffness. Elastic moduli were calculated from 1 521 SPT N60 values from 178 boreholes distributed across the study area. SPT N-values were not corrected for stress level, as Stroud argued that both penetration resistance and stiffness increase with increasing overburden pressure. The elastic modulus of the Cape Flats sands was determined for three qnet/qult ratios. Factors of safety of 3 (qnet/qult = 0.33), 7 (qnet/qult = 0.14) and 20 (qnet/qult = 0.05) on bearing capacity were selected. The over-consolidated curve from Stroud's graph was considered to best represent the stress history of the site soils. It is the continuous mobilisation of the dune sand across the low-gradient landscape during summer months (by the dominant south-easterly winds), together with removal of dune sands for mining purposes, which will result in over-consolidation in most areas.
The stiffness data was separated into formation and into 2 m depth intervals to allow inter formation and vertical variations to be studied. The average modulus value for each depth interval was plotted against the relevant strain level. The result is shown in Figure 20 for the Witzand Formation (refer to Fouché 2021 for similar plots for the Springfontyn and Langebaan Formations). The influence of strain on stiffness is evident - as the qnet/qult ratio increases (and the factor of safety decreases) there is a marked decrease in soil stiffness.
The spread of the modulus values in each depth interval is also given in the form of box plots as shown for the Witzand Formation and a factor of safety of 3 (see Figure 21). These plots enable the spread of the soil compressibility data to be studied and for detailed comparison between formations.
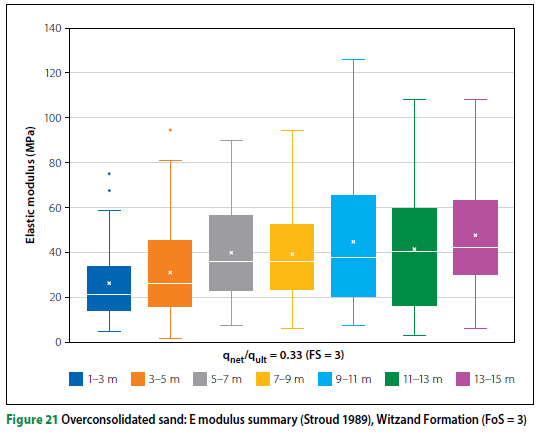
In separate plots, individual elastic modulus values were plotted against the average SPT depth for each formation, which showed an overall positive relationship between the elastic soil modulus and test depth as the overburden pressure and soil relative density increased. A large spread in the data about the plotted trendlines was noted, illustrative of the non-uniform stiffness profiles.
Soil stiffness in the Langebaan Formation consistently exceeds equivalent values in the other formations. Cemented sands and limestone banks are considered to be responsible for the higher stiffnesses. Similar stiffness profiles are observed for the Witzand and Springfontyn Formation soils to a depth of about 7 m. Below this depth, the Springfontyn Formation soils consistently display greater stiffness.
Elastic moduli estimated from Robertson's CPTu-based method were found to be comparable to SPT-derived stiffnesses based on Stroud's method.
Other soil characterisation properties
The main findings associated with the remainder of the soil characterisation properties are the following:
■ The specific gravity of soils with pre-dominantly sand-size grains, ranges between 2.62 and 2.69. The range of values obtained for seemingly similar soil textures can be ascribed to the mineralogical makeup of the soils. Soils containing organic matter were associated with lower values of Gs.
■ The unconsolidated aeolian sands from the study area are mostly semi-pervious, as determined with the constant head permeability test. The associated soil types ranged from clayey silty fine sand to well-graded sand. The wider range of hydraulic conductivities previously documented for Cape Flats sands reflect the presence of cohesive soils, peaty layers and cementation. The predictive methods by Carrier (2003) and Chapuis (2004), based on grading and in-situ density, were found to overestimate soil permeability in comparison with the laboratory-determined values.
■ Surface infiltration rates vary between 1.2 χ 10-4 and 5.5 χ 10-4 m/s (average of 2.4 χ 10-4 m/s), as determined through DRI testing. These moderate to high infiltration rates will result in generally minor runoff or ponding, thus aiding recharge of groundwater in the unconfined aquifer underlying the study area. Notwithstanding this, blinding of the surface with soil fines and detritus, and the presence of less permeable layers below surficial soils can hinder recharge rates, and result in ponding and flooding on the ground surface during periods of heavy rainfall.
■ In the upper metre of the soil profile, bulk density varies between 1 624 kg/m3 and 1 951 kg/m3. The in-situ moisture content ranged from 2.4% to 6.3%.
The calculated dry densities, varying between 1 571 kg/m3 and 1 844 kg/m3, represent the typically loose, shallow sands and the dense cemented sands regularly occurring close to the soil surface in the Witzand and Langebaan Formations.
CONCLUSIONS AND RECOMMENDATIONS
There are very few publications on the geotechnical and engineering geological properties of the upper Quaternary age sands of the Cape Flats. Many geotechni-cal investigations have been undertaken in the area, but the valuable geotechnical data from these investigations has largely remained uninvestigated and unpublished. The aim of this research was to present the first major contribution towards classifying and describing the recent aeolian sands covering the entire Cape Flats area in terms of their physical properties and engineering behaviour.
The Cape Flats sands have been found to be highly variable, with a wide range in many material properties. The findings of this research may be used to form initial appreciation of the likely properties of the material.
This research has shown that there is merit in broadening the current approach to site investigations of the Cape Flats, which traditionally rely heavily on shallow test pits and dynamic penetrometer testing. It should, however, be noted that this aspect will be dependent on development requirements.
ACKNOWLEDGEMENTS
The research would not have been possible without the geotechnical data from past investigations made available by the following companies: Aurecon South Africa (Cape Town), Roadlab (Cape Town), Geoscience Laboratories, Fairbrother Geotechnical Engineering, Council for Geoscience (Cape Town), M van Wieringen and Associates, Core Geotechnical Consultants, Kantey and Templer Consulting Engineers (Cape Town), Melis and Du Plessis Consulting Engineers, SMEC South Africa (Cape Town), Airports Company South Africa (Cape Town), Peregrine Geoconsultants (Pretoria), ASLA Group (Cape Town), and the Geotechnical Engineering Division of the University of Cape Town.
The authors would also like to thank:
■ Core Geotechnical Consultants for allowing us to perform our investigations alongside theirs.
■ Jones & Wagener (Pty) Limited and the Geo Group, who made the piezocone penetrometer testing possible.
■ Prof Gerhard Heymann and CSW Soil Engineering for funding and performing the CSW tests.
REFERENCES
Adelana, S, Xu, Y & Vrbka, P 2010. A conceptual model for the development and management of the Cape Flats aquifer, South Africa. Water SA, 36(4). [ Links ]
Amdurer, S S 1956. The engineering geology of the Cape Flats. Unpublished Doctoral Thesis. Cape Town: University of Cape Town. [ Links ]
AASHTO (American Association of State Highway and Transportation Officials) 2008. M145-912008. Standard Specification for Classification of Soils and Soil-Aggregate Mixtures for Highway Construction Purposes. Washington, DC: AASHTO. [ Links ]
ASTM (American Society for Testing and Materials) 2007. ASTM D422 2007. Standard Test Method for Particle-Size Analysis of Soils (withdrawn 2016). West Conshohocken, PA: ASTM. [ Links ]
ASTM 2016. ASTM D1883 2016. Standard Test Method for California Bearing Ratio (CBR) of Laboratory-Compacted Soils. West Conshohocken, PA: ASTM International. [ Links ]
ASTM 2017. ASTM D2487 2017. Standard Practice for Classification of Soils for Engineering Purposes (Unified Soil Classification System). West Conshohocken, PA: ASTM International. [ Links ]
Basson, J J 1989. Deterioration of concrete in aggressive waters: Measuring aggressiveness and taking countermeasures. Johannesburg: Concrete-Durability Bureau of the Portland Cement Institute. [ Links ]
Brandt, M 2011. Seismic hazard in South Africa. Council for Geoscience Report No 2011-0061. Cape Town: Council for Geoscience. [ Links ]
Brink, A B A 1985. Engineering Geology of Southern Africa. Vol 4. Post-Gondwana Deposits. Pretoria: Building Publications. [ Links ]
BRE (Building Research Establishment) 2005. Concrete in aggressive ground. Part C: Assessing the aggressive chemical environment. Special Digest 1. 3rd ed. Watford, UK: Building Research Establishment. [ Links ]
Carrier, W D 2003. Goodbye, Hazen; Hello, Kozeny-Carman. Journal of Geotechnical and Geoenvironmental Engineering, 6(3): 287-326. [ Links ]
Chapuis, R P 20 04. Predicting the saturated hydraulic conductivity of sand and gravel using effective diameter and void ratio. Canadian Geotechnical Journal, 41(5): 787-795. [ Links ]
Chen, J R 200 4. Axial behaviour of drilled shafts in gravelly soils. PhD Thesis. Ithaca, NY: Cornell University. [ Links ]
Dakshanamurthy, V & Raman, V 1973. A simple method of identifying expansive soil, soils and foundations. Japanese Society of Soil Mechanics and Foundation Engineering, 13(1): 91-104. [ Links ]
DoT (Department of Transport) 1990 TRH14. TRH14: Guidelines for Road Construction Materials. Pretoria: DoT. [ Links ]
DoT 1990 TRH20. TRH20: The Structural Design, Construction and Maintenance of Unpaved Roads. Pretoria: DoT. [ Links ]
Fouché, N 2021. Geotechnical characterisation of the upper Quaternary sands of the Cape Flats. PhD Thesis. Stellenbosch University. [ Links ]
Franceschini, G 2003. Geology of aeolian and marine deposits in the Saldanha Bay region, Western Cape, South Africa. PhD Thesis. University of Cape Town. [ Links ]
Hay, R, McGibbon, D, Botha, F & Riemann, K 2015. Cape Flats aquifer and False Bay: Opportunities to change. Proceedings, 79th Institute of Municipal Engineering of Southern Africa (IMESA) Conference, 27-30 October, Cape Town. [ Links ]
Henzen, M 1973. The reclamation, storage and abstraction of purified sewage effluents in the Cape Peninsula. DSc Thesis. University of the Free State. [ Links ]
Hettiarachchi, H & Brown, T 2009. Use of SPT blow counts to estimate shear strength properties of soils: Energy balance approach. Journal of Geotechnical and Geoenvironmental Engineering, 135: 25-32. [ Links ]
Hill, R S & Theron, J N 1981. Silica sand of the Cape Flats. Bulletin 69. Pretoria: Geological Survey of South Africa. [ Links ]
Howayek, A E, Huang, P T, Bisnett, R & Santagata, M C 2011. Identification and behaviour of collapsible soils. Report No FHWA/IN/JTRP-2011/12. Joint Transportation Research Program: Indiana Department of Transportation and Purdue University. [ Links ]
Idriss, I M & Boulanger, R W 2004. Semi-empirical procedures for evaluating liquefaction potential during earthquakes. Proceedings, 11th International Conference on Soil Dynamics and Earthquake Engineering (ICSDEE) and 3rd International Conference on Earthquake Geotechnical Engineering (ICEGE), 7-9 January, Berkeley, CA, 32-56. [ Links ]
Jennings, J E B 1974. Contribution by Jennings to Newsletter No 2 of the SAICE Geotechnical Division, August. [ Links ]
Johnson, M R, Anhaeusser, C R & Thomas, R J (Eds) 2006. The Geology of South Africa. Pretoria: Council for Geoscience. [ Links ]
Kalumba, D 1998. Effect of grading and grain size on the friction characteristics of a sand/geotextile interface. MSc Eng Dissertation. University of Cape Town. [ Links ]
Kulhawy, F H & Mayne, P W 1990. Manual on estimating soil properties for foundation design. Final Report, Project 1493-6, EL-6800. Palo Alto, CA: Electric Power Research Institute. [ Links ]
Meigh, A C 1987. Cone Penetration Testing: Methods and Interpretation. Construction Industry Research and Information Association (CIRIA - London), Series on Ground Engineering Report: In-Situ Testing. Oxford: Butterworths. [ Links ]
Msadala, V, Gibson, L, Le Roux, J, Rooseboom, A & Basson, G R 2010. Sediment yield prediction for South Africa: 2010 Edition. WRC Report K5/765. Pretoria: WRC. [ Links ]
Paige-Green, P & Du Plessis, L 2009. The use and interpretation of the Dynamic Cone Penetrometer (DCP) test. Pretoria: CSIR Built Environment. [ Links ]
Parker, R J 1991. A study of the liquefaction potential of sandy soils with specific reference to the Cape Flats. MSc Eng Dissertation. Stellenbosch University. [ Links ]
Roberts, D L 2001. The geology of Melkbosstrand and Environs. Explanation of Sheet 3318CB. Pretoria: Geological Survey of South Africa. [ Links ]
Robertson, P K 2009. Interpretation of cone penetration tests: A unified approach. Canadian Geotechnical Journal, 46: 1337-1355. [ Links ]
Robertson, P K 2016. Cone penetration test (CPT)-based soil behaviour type (SBT) classification system: An update. Canadian Geotechnical Journal, 53: 1910-1927. [ Links ]
Robertson, P K & Campanella, R G 1983. Interpretation of cone penetration tests. Part I: Sand. Canadian Geotechnical Journal, 20: 718-733. [ Links ]
Rogers, J 1980. First report on the Cenozoic sediments between Cape Town and Eland's Bay. Unpublished report. Pretoria: Geological Survey of South Africa. [ Links ]
Schoeman, J J 2018. The liquefaction potential of soils on the Cape Flats established by means of empirical correlation. MSc Eng Dissertation. Stellenbosch University. [ Links ]
Schwartz, K 1985. Problem soils in South Africa: Collapsible soils. The Civil Engineer in South Africa, 27(7): 379-393. [ Links ]
Sitela, V 2018. Determining the collapsibility of Cape Flats soil. Project Report FYP458. Stellenbosch University. [ Links ]
SANS (South African National Standard) 2010. SANS 10160-4:2010. Basis of Structural Design and Actions for Buildings and Industrial Structures. Part 4. Seismic Actions and General Requirements for Buildings. Pretoria: SABS Standards Division. [ Links ]
Stapelberg, F D J 2009. The engineering geology of Bellville and environs, Western Cape South Africa (1:50 000): Explanation of Sheet 3318DC. Bellville: Council for Geoscience. [ Links ]
Stroud, M A 1989. The standard penetration test: Its application and interpretation. Proceedings, Institute of Civil Engineers Conference on Penetration Testing in the UK, 6-8 July 1988, Birmingham, UK. [ Links ]
Theron, J N (Compiler) (Geological Survey of South Africa) 1990. 1:25 000 geological series [South Africa]. 3318. Pretoria: Government Printer. [ Links ]
Theron, J N, Gresse, P G, Siegfried, H P & Rogers, J 1992. The geology of the Cape Town area: Explanation of Sheet 3318. Pretoria: Geological Survey of South Africa. [ Links ]
Van der Merwe, D M 1964. The prediction of heave from plasticity index and percentage clay fraction of soils. The Civil Engineer in South Africa, 6(6): 103-107. [ Links ]
Wischmeier, W H & Smith, D D 1978. Predicting rainfall erosion losses. A guide to conservation planning. Agriculture Handbook No 537. Washington, DC: US Department of Agriculture. [ Links ]
 Correspondence:
N Fouché
Department of Civil Engineering, Stellenbosch University
Private Bag X1, Matieland 7602, South Africa
T: +27 83 602 0893; E: naninef@sun.ac.za
P W Day
Department of Civil Engineering, Stellenbosch University
Private Bag X1, Matieland 7602, South Africa
T: +27 82 450 6540; E: day@jaws.co.za

DR NANINE FOUCHÉ, who is an Associate Member of the South African Institution of Civil Engineering (SAICE), is a senior lecturer in geotechnical engineering at Stellenbosch University where she also provides support to geotechnical research students. She started her career with a Bachelor's degree in Earth Science, and gained valuable experience as an engineering geologist at Aurecon South Africa (now known as Zutari) where she undertook geotechnical and foundation investigations for a wide range of projects. She subsequently studied further, obtaining a PhD in geotechnical engineering in 2021 focusing on the aeolian sands of the Cape Flats. Her research interests include problem soils, in-situ testing and geotechnical earthquake engineering.

DR PETER DAY is adjunct professor of geotechnical engineering at Stellenbosch University. He also consults for the Johannesburg-based company Jones & Wagener, where he has been working for more than 40 years. He is an Honorary Fellow of the South African Institution of Civil Engineering (SAICE), and a recipient of the SAICE Geotechnical Gold Medal, as well as the Gold Medal of the South African Institute for Engineering and Environmental Geologists (SAIEG). His main fields of activity include site investigations for heavy industrial and mining projects, and the investigation of geotechnical failures. He has published widely, and also presented the prestigious Terzaghi Oration at the opening of the 2017 International Conference on Soil Mechanics and Geotechnical Engineering in Seoul, South Korea. He furthermore serves on committees of the Engineering Council of South Africa, and the South African Bureau of Standards.

