


Services on Demand
Article
 English (pdf)
 Article in xml format
 Article references
Indicators

Related links
-
 Cited by Google
 -
 Similars in Google
Share

 Permalink
Journal of the South African Institution of Civil Engineering
On-line version ISSN 2309-8775
Print version ISSN 1021-2019
J. S. Afr. Inst. Civ. Eng. vol.64 n.1 Midrand Mar. 2022
http://dx.doi.org/10.17159/2309-8775/2022/v64no1a3
TECHNICAL PAPER
Incorporation of additional information into the South African Wind Load Formulation
F P Bakker; N de Koker; C Viljoen
ABSTRACT
The South African wind loading standard SANS 10160-3:2019 recently adopted an improved map of characteristic basic wind speeds and increased the wind loading partial safety factor from 1.3 to 1.6. These changes represent an overhaul of the design wind loads throughout South Africa and were the result of several studies on the wind loading standard. Since these studies were conducted, substantially more wind speed data has been made available. This investigation aimed to use this data to assess the current design loads by estimating location-specific design values that maintain the current reliability level of the standard. A statistical test was developed to assess whether the design values in SANS 10160-3:2019 could be supported by the new data. It was found that several updates could be considered. These were incorporated into a new recommended map of basic wind speeds that could be considered for inclusion in the next revision of SANS 10160-3.
Keywords: wind loading, structural reliability, wind engineering
NOMENCLATURE
Wind load
q random variable representing the wind loading
qddesign wind load
qd-sans current SANS design wind load
qdestimate of design wind load
Ywwind load partial safety factor
Wind speed
v wind speed
v50 50-year characteristic value of the basic wind speed
v50:updated updated 50-year characteristic wind speed
vddesign wind speed
Vd estimate of design wind speed
vsimsimulated wind speed
vwpreconditioned wind speed
w wind speed preconditioning exponent
Wind load modification factor
c wind load modification factor Ckcharacteristic wind load modification factor
cddesign value of the wind load modification factor
C a specific component of the load modification factor, e.g. pressure coefficient characteristic value of a specific component of the load modification factor
Cprobfactor used to adjust the characteristic value for different design lives
Cprob-asCefactor to adjust the characteristic value to different design lives in ASCE
Cprob-sansfactor to adjust the characteristic value to different design lives in SANS
Probability
P probability
p annual exceedance probability
pttarget annual exceedance probability
pt.Vdannual exceedance probability of the design wind speed
ßttarget reliability index
aCFORM sensitivity factor of the wind load modification factor
av FORM sensitivity factor of the wind speed
φ standard cumulative normal distribution function
θ standard score, i.e. number of standard deviations away from the mean
θtstandard score of the design value
θk-optoptimal standard score of the characteristic value
Wind speed statistics
δvw coefficient of variation of pre-conditioned wind speeds δvi coefficient of variation of squared wind speeds
δvi.e coefficient of variation of wind speeds raised by an exponent of 1.6
δv1.6 average coefficient of variation of wind speeds raised by an exponent of 1.6
δy1.6 estimate of mean coefficient of variation of wind speeds raised by an exponent of 1.6
δv2.synaverage coefficient of variation of synoptic-squared wind speeds
δv2tsaverage coefficient of variation of thunderstorm-squared wind speeds
μvw mean of the preconditioned wind speed
μvi.6 sample estimates of mean of wind speeds raised by an exponent of 1.6
μvi-6.simsample mean of simulated wind speeds raised by an exponent of 1.6
σvwstandard deviation of the pre-conditioned wind speed
σv1.6sample estimates of standard deviation of wind speeds raised by an exponent of 1.6 σvi.6.simsample standard deviation of
simulated wind speeds raised by an exponent of 1.6
λ skewness
K kurtosis
0 set of distribution parameters
®simsimulated set of distribution parameters
Other
p air density
l limit state
r random variable representing the structural resistance
rddesign value of structural resistance
g random variable representing the permanent loading
gddesign values of permanent loading
n, M, m some number of f a function of
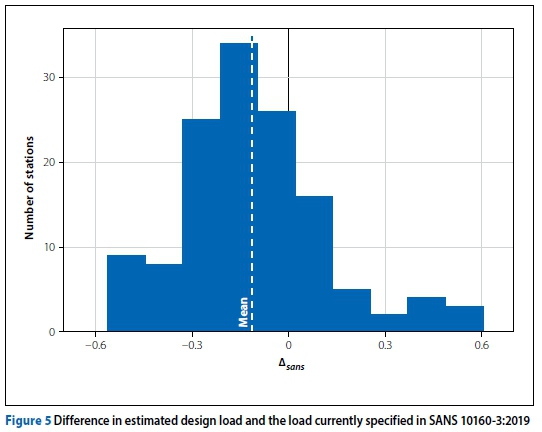
Δsans relative difference between the predicted and the current SANS design wind load
Y Euler's gamma = 0.577...
a* statistical significance level
H0null hypothesis
r proportion of simulated design values that are less than the current SANS design load
INTRODUCTION
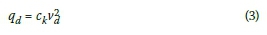
The current South African wind loading standard SANS 10160-3:2019 (SANS 2019b) is largely based on the Eurocode EN 1991-1-4 (EN 2005), and uses Davenport (1982)'s wind loading chain to convert a representative wind speed v50 to a design wind load/ dynamic pressure as
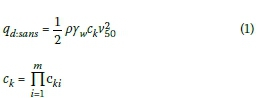
where p is the air density. The v50value is the characteristic value of the basic wind speed, with an annual exceedance probability p = 0.02, representing wind speed measured at 10 metres above ground level in open country terrain with low vegetation. The load is tailored to site and structural conditions using ck, which is the product of other factors cki. These account for different aspects of the particular load, including the change in load due to height, topography and aerodynamics of the structure. To ensure that the calculated load meets the reliability requirements of the standard SANS 10160-1:2019 (SANS 2019a), uncertainties are accounted for using the partial safety factor yw.
New wind speed data has recently been made available (Bakker & Viljoen 2019) and more research into applicable statistical techniques has been conducted (Bakker et al 2021; Bakker 2021), which present an opportunity to improve the representation of the South African wind climate in SANS 10160-3.
Basic wind speed
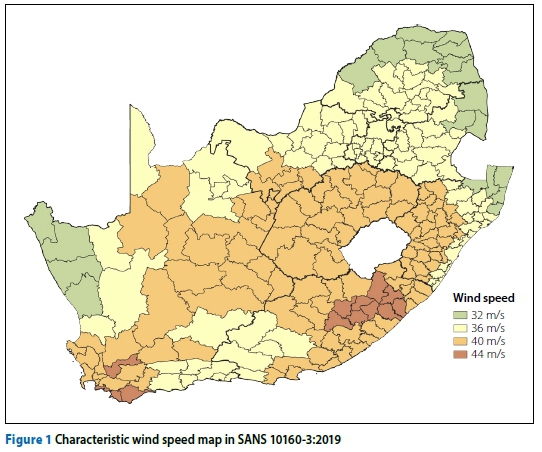
In Equation 1 the wind climate is explicitly represented by the basic wind speed v50. Different v50values are specified to account for regional differences in climate. In SANS 10160-3:2019, one of four values v50 6 ε{32, 36, 40, 44} m/s is specified for each district and metropolitan municipality (administrative divisions of a South African province) using a characteristic wind speed map (Figure 1) and table. SANS 10160-3:2019 introduced this map, which represents a substantial improvement over previous maps. Before Figure 1 was adopted, the characteristic map was based on studies which only had access to sparse data (Milford 1985; 1987). A background on the various basic wind speed maps that have been used in South Africa since 1952 is presented by Goliger et al (2017).
The current map originates from an analysis of gust wind speeds collected at 92 weather stations throughout South Africa performed by Kruger (2011), who estimated the annual p = 0.02 exceedance gust wind speeds using Peak-Over-Threshold (POT) and Gumbel analyses (Palutikof et al 1999). The derivation of the current map is described by Kruger et al (2017).
Cook (1985) recommends at least 20 years of data for reliable Gumbel results, but data used by Kruger (2011) was limited to the period between 1990 and 2008, with a longest series of only 16 years, which is why Kruger (2011) also performed the POT analysis. To be conservative, Kruger (2011) then adopted the maximum 75th percentile gust wind speed of the Gumbel and POT analysis.
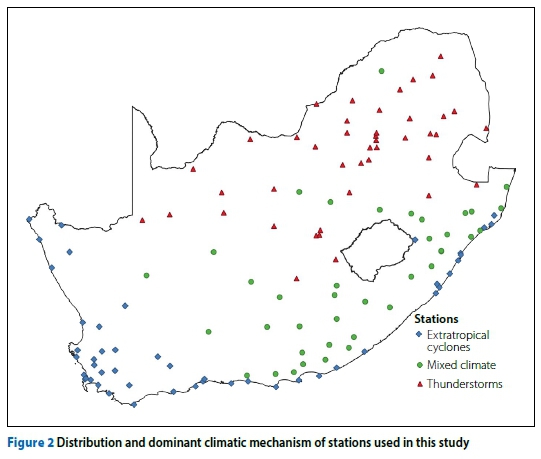
In response to the shortage of data, an effort to increase the quantity of available quality data has been made (Bakker & Viljoen 2019). This yielded an extended dataset which includes over 3 500 annual gust maxima from 132 stations classified by dominant storm type and normalised to standardised conditions. This is more than a twofold increase in data compared to Kruger (2011)'s study. The location and dominating extreme wind speed mechanism of each station are shown in Figure 2.
Bakker et al (2021) considered the extended dataset from Bakker and Viljoen (2019) in terms of model selection and found that a Gumbel analysis was preferred. The downside of using the Gumbel distribution is that its inflexibility relative to distributions with more parameters, such as the Generalised Extreme Value distribution, could introduce significant modelling bias. To reduce modelling bias without a significant increase in statistical uncertainty, Bakker et al (2021) recommended regional preconditioning of the wind speed (raising the wind speeds by an exponent w) before fitting the Gumbel distribution. Bakker et al (2021) developed a maximum likelihood-based procedure to estimate this exponent and found that a value of w = 1.6 should lead to a reduction of modelling bias, given the extended South African dataset. This technique and the new data could be used to update the v50 values in SANS 10160-3, which should improve its representation of the extreme wind climate.
Reliability performance
In Equation 1 the wind climate is also implicitly represented by the partial factor Yw. The Ywaccounts for uncertainties in the load, a significant portion of which can be attributed to the wind climate (Ellingwood & Tekie 1999; Holický 2009; Botha et al 2018b). A reliability assessment by Botha et al (2018a) led to the yw= 1.6 currently used in SANS 10160-1:2019 (SANS 2019a).
A reliability assessment aims to ensure that a structure designed according to the standard has an acceptably low lifetime probability of failure. This requirement can be considered for a wind loading standard using a limit state l of
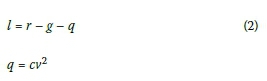
where r, g and q are random variables representing the structural resistance, permanent loading, and wind loading respectively. The wind loading can be decomposed into two separate random variables: the wind load modification factor c and the wind speed v.
An acceptable design is found by specifying a set of design values {rd, gd, qd] which ensure that the probability of a load exceeding the resistance P(l < 0) equals some target probability pt. This pt is associated with a specified target level of reliability and is typically referred to using the target reliability index ßt= φ-1(1 - pt), with φ the standard cumulative normal distribution function. Because structures differ in performance, consequence of failure, and nature of failure, different ßt values are specified for different reliability classes (Retief & Dunaiski 2009). Deviation from these ßtvalues should be minimised throughout the scope of the standard.
If distributions of the random variables can be defined, then a set of optimal design values, at the most probable point of failure, can be found. An efficient way to achieve this is provided by the First Order Reliability Method (FORM) (Ang & Tang 1984). This also provides sensitivity factors a which indicate the relative contribution of each component.
Botha et al (2018a) considered a single representative distribution of dynamic wind pressure (equivalent to v2) and a range of g, r and c distributions in their reliability assessment of SANS 10160-3. Unlike the probability distribution of r, g and c, which can reasonably be considered location independent, the distribution of v could differ by climatic region and thus vary by location (Ellingwood & Tekie 1999). This implies that using a single distribution of v to derive a single ywmay lead to geographical variation in reliability performance. This may be acceptable if the region covered by the standard has a fairly homogeneous wind climate (Hong et al 2016), as is the case for many countries that use EN 1991-1-4.
Larger regions are likely to experience substantial variation in the wind climate and could see significant geographical variation in reliability performance if a single Ywis specified for the entire region. Therefore, standards that aim to cover diverse climatic regions, including the American ASCE 7-16 (ASCE 2017)) and Australian AS/NZS 1170.2 (AS/NZS 2011) standards, adapted the partial factor-based format of Equation 1.
Instead, a high return period design wind speed vdthat corresponds with the target reliability is specified, effectively setting Yw= 1. This ensures that, as long as regionally representative statistics are used to estimate vd, the regional variation in the wind climate is accounted for in the design (Hong et al 2016). The strong wind climate throughout South Africa is diverse (Kruger et al 2010), and so an approach similar to ASCE 7-16 (ASCE 2017) and AS/NZS 1170.2 (AS/NZS 2011) could be considered to yield more uniform reliability performance.
ESTIMATION OF DESIGN WIND SPEEDS
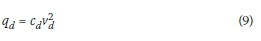
Direct consideration of design wind speeds
The use of a single partial factor across an area with some regions dominated by synoptic storms and others by tropical cyclones is inappropriate because the variability of wind speeds from tropical cyclones is typically higher than synoptic storms. This has been recognised in standards that need to cover both cyclone and synoptic storm regions; in the United States and Australia an "importance factor" / "cyclone factor" was used to increase design loads to account for the higher variability of tropical cyclones (Holmes 2018). In both standards this practice has been superseded and a design wind speed vdis used instead. The exceedance probability of this design wind speed pt:vdis specified to correspond to the target reliability. This avoids the need to have different regional partial factors because the regional differences are reflected in vd.
ASCE 7-16 (ASCE 2017) and AS/NZS 1170.2 (AS/NZS 2011) specify multiple vdvalues at a given location depending on the reliability class (risk categories in ASCE 7-16 (ASCE 2017) or importance levels in AS/NZS 1170.2 (AS/NZS 2011)) because the difference in variability between cyclonic and non-cyclonic winds is too large to reasonably allow conversion between pt:vdvalues using a single formula.
South Africa has a diverse wind climate, dominated by synoptic winds in the southwest and thunderstorm winds in the northeast (Kruger et al 2010). These different climatic mechanisms were found to have significantly (P-value % 0.01) different coefficients of variation of v2with means of δv'2:Syn = 0.24 and δvi:tss= 0.29 for synoptic and thunderstorm regions respectively (Botha 2016).
This trend was further investigated using the dataset compiled by Bakker and Viljoen (2019). The coefficient of variation δv2 of the 170 available series was estimated, then inverse distance weighting was used to interpolate between stations, and δv2 was aggregated by municipality. This yielded a map of δv2 as shown in Figure 3. There is a clear increase in δv2 from south-west to northeast that correlates with the dominant climatic mechanism (Figure 3), confirming the trend observed by Botha (2016) of synoptic-dominated regions having a lower δv2 and thunderstorm-dominated regions a higher δv2.
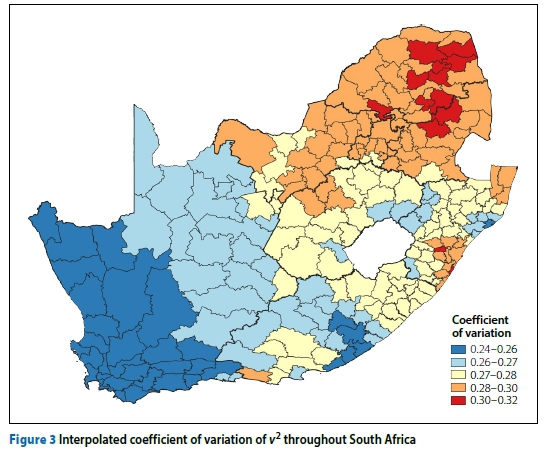
Botha et al (2018a) aimed to perform a reliability assessment for the country as a whole and used δv2 = 0.31 to calibrate the partial factor yw= 1.6 for the entire country. While this δv2 was a reasonable choice for nationwide consideration, Figure 3 suggests it may have been overly conservative for synoptic regions in the southwest of the country. Therefore, direct consideration vdof values is proposed to obtain more regionally representative design loads. An advantage of directly considering vdinstead of the characteristic values (p = 0.02) is that statistical techniques can be applied directly, and the full impact of the new information (Bakker & Viljoen 2019; Bakker et al 2021; Bakker 2021) can be realised.
The vdshould be estimated for an exceedance probability pt:vdthat will result in attainment of the target reliability. This pt:vdcould be found by performing
a reliability assessment using FORM and finding the pt:vdfrom the design point. SANS 10160-3:2019 is meant to apply to a wide range of design situations (Retief & Dunaiski 2009) and so multiple resistance distributions and wind to total load ratios would need to be considered, which would lead to ambiguity about which design point to use. Alternatively, because Botha et al (2018a) have already calibrated the reliability level of the standard, the pt:vdcurrently provided by SANS 10160-3:2019 could be calculated and used instead. This would avoid having to repeat the subjective decisions and calibration procedure done by Botha et al (2018a).
ASCE exceedance probability
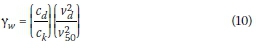
The pt:vdused by ASCE 7-16 (ASCE 2017) was back-calculated from provisions in ASCE 7-05 which used a similar format to SANS 10160-3:2019 (Cook et al 2011) with design wind loads also calculated using Equation 1. If it is assumed that the variability of the wind speed dominates the uncertainties accounted for by the partial factor Yw, an alternative formulation using a design wind speed vdis:
Combining this with Equation 1 means vd can be represented in terms of the previous provisions as:
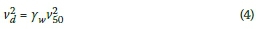
ASCE 7-05 allowed adjustment of the characteristic value to another annual exceed-ance probability p using:
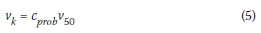
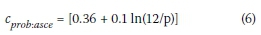
where Cprobis a factor used to adjust the characteristic value for different design lives, which in ASCE 7-05 is:
Combining this with Equation 4 gives:
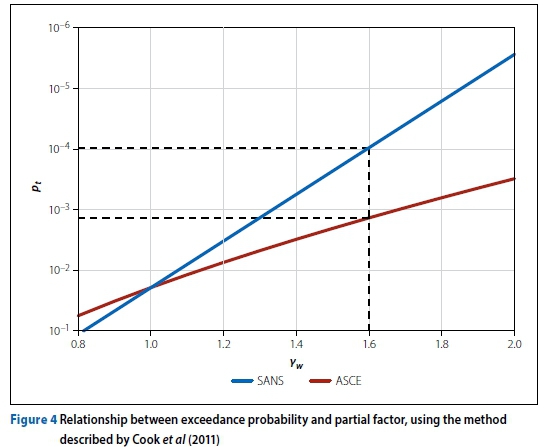
from which the pt:vdthat matches the reliability of the wind speeds can be determined. For example, the ASCE 7-16 (ASCE 2017) reference level of reliability (Risk Category II) with yw= 1.6 gives pt:vd= 1.4 X 10⁻³ (700-year return period). The similarities between ASCE 7-05 and SANS 10160-3:2019 mean that the same procedure could be considered for South Africa.
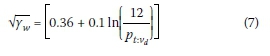
In SANS 10160-3:2019 the adjustment of v50to a different annual exceedance probability is done with:
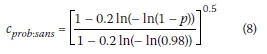
The relationship between ptand ywresulting from Cprobis depicted in Figure 4, where a significant discrepancy between ASCE and SANS is evident. The partial factor in SANS 10160-1:2019 is also yw= 1.6, but Cprob:sansimplies an annual pt= 10-4, which is more conservative than ASCE by an order of magnitude.
The ASCE method of determining pt:vdassumes that v dominates the uncertainty of the wind loading formulation. Prescribing all the uncertainty to v means that the variability of v dictates the design load qd. Therefore, if uncertainties in c are large and pt:vdis calculated neglecting these uncertainties, then the pt:vdobtained would be too far into the tail of the distribution, resulting in too much weight being given to the variability of v. Thus, qdwould be overestimated in areas where the variation of v is high and underestimated in areas where the variation of v is low.
Research by Botha et al (2018b) found that uncertainties in other components of Davenport (1982)'s wind loading chain could be significant. These findings were incorporated into the Botha et al (2018a) calibration of SANS 10160-3; hence, neglecting uncertainties in c when back-calculating the target reliability is not considered reasonable.
Most probable exceedance probability
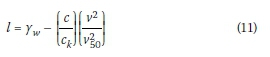
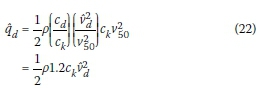
If uncertainties in c are considered, the design wind load can be represented as:
which can be combined with Equation 1 to give:
Unlike the ASCE method, there are multiple possible vdvalues, with corresponding cd values, which together satisfy Equation 10.
Defining exceedance of the design load as failure means that:
represents an acceptable limit state, with c and v as random variables. Assuming {vd, cd} are at the design point, solving P(l < 0) using FORM provides both the probability ßq that the wind load exceeds its design value and the most probable {vd, Cj} solution. The exceedance probabilities of cdand vdare then defined by their sensitivity factors, for example pt:vd= 1 - φ(avßq).
The limit state can be formulated in terms of preconditioned wind speeds (as defined in the Introduction) vwas:
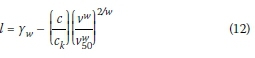
Bakker et al (2021) investigated w using the extended dataset from Bakker and Viljoen (2019) and found that a w = 1.6 fits the data significantly better than if the Gumbel distribution were applied to the wind speeds (w = 1) or dynamic wind pressures (w = 2).
Applying w = 1.6, and since in South Africa Yw= 1.6,
The FORM P(l < 0) solution can then be found if the distributions of c and vwrelative to their values in the standard c/ckand v1.6/v501.6are defined.
Distribution of v
A Gumbel distribution is often used to represent the distribution of wind speeds (Botha et al 2018a; Kruger 2011; Hong et al 2014; JCSS Model Code (JCSS 2001)). A generalisation of the Gumbel distribution to vwhas a cumulative density function of:
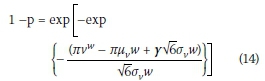
where y = 0.577 ... is Euler's gamma. The μvw and σvw are the mean and standard deviation of the preconditioned wind speed vw. Equation 14 can also be represented as:
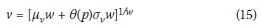
where 6 is a standardisation function given as:
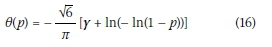
The vw/vw50would still be Gumbel distributed, with mean:
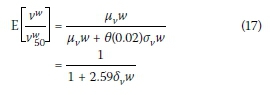
and standard deviation
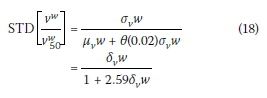
where δvw = avw/μvw is the coefficient of variation of vw.
Botha et al (2018a) used a δv2= 0.31 to represent the variation of v2. This annual coefficient of variation is equivalent to Sv1.6 = 0.25. The distribution of v1.6/v501.6can therefore be reasonably represented by a Gumbel distribution with mean E[vw/vw50] = 0.6 and standard deviation STD[vw/vw50] = 0.15 defined by Equations 17 and 18.
Distribution of c
Botha et al (2018a) specified each c/ck component ci/ckias having a normal distribution, with mean E[ci/Cki] and standard deviation STD[ci/cki]. Botha et al (2018a) was mainly concerned with estimating E[C/Cki\ and STD[ci/Cki] rather than the specific distribution of C/Ck.
A log-normal distribution has also been used for ci/cki(JCSS 2001; Baravalle & Köhler 2018; Hong et al 2016). The product of a series of log-normally distributed random variables also follows a log-normal distribution, with parameters defined by its component distributions. Therefore, if each ci/Ckiis assumed to be log-normally distributed with mean and standard deviation defined by Botha (2016), then these can be combined (Castillo et al 2005) to find the distribution of c/ck.
Botha et al (2018a) considered four different sets of c/ckidistributions, resulting in four probabilistic models. The first model (New-SANS) was the result of a detailed study into wind load uncertainties by Botha (2016), who found that uncertainties in c/ckcould be significantly higher than typically assumed.
Botha et al (2018a) was concerned that, given the significant increase in variability of c/Ck, using only the New-SANS model in a reliability assessment may be too drastic. Instead, a Bayesian philosophy was employed, where the New-SANS model was taken as a prior and used to update three other existing c/ckmodels by Holicky (2009), Milford (1985) and Gulvanessian and Holicky (2005). The ci/ckicomponents of each of Botha et al (2018a)'s four models (New-SANS and the three updated models) were assumed to be log-normally distributed and combined to give four log-normal c/ckdistributions, with means E[c/Ck] and standard deviations STD[c/Ck] given in Table 1.
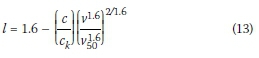
FORM results
Using the limit state function (Equation 13) and defined v1.6/'v501.6and Cckdistributions, a FORM analysis was performed. The results for each of Botha et al (2018a)'s probabilistic models are given in Table 1.
For all models these results imply that the wind load dominates the uncertainty of the overall formulation, with the annual exceedance probability of the design wind load ßqbetween 78% and 96% of the annual
reference target exceedance probability ßt= 4.0. The high variability of C/ckin the New-SANS model means that, unlike the other three models, ac> avindicates that c contributed more to the total uncertainty of the wind load than v. This directly contradicts the ASCE method, where ac= 0 was assumed.
The updated models all have a fairly consistent design point with an effective partial factor for other components of the design load Cd/ck = 1.2 and design wind speed annual exceedance probability pt:vd = 2 X 10⁻³ (500-year return period).
Given that Botha et al (2018a) did not advocate the direct use of the New-SANS model, the design point indicated by the updated models is accepted as representative of the overall reliability currently offered by SANS 10160-3.2019.
Optimal estimation procedure
If only the recordings from a particular site are used to estimate vd, then more representative values are obtained on average (low bias), although this introduces substantial statistical uncertainty (high variance) (Hong et al 2016). A lower variance alternative is to regionally aggregate the data (Hosking & Wallis 2005), although this risks higher bias.
Bakker (2021) considered this problem in terms of the bias variance trade-off (Friedman et al 2001). It was found that, by employing an optimal combination of site and regional statistics, a design value which better corresponds to pt.vdcould be found. This optimal estimate Vd is found using sample estimates of mean μv1.6and standard deviation <v1.6 from the n preconditioned annual maximum wind speeds measured at a particular site, located in a region with an average coefficient of variation δv1.6, as:
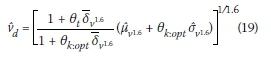
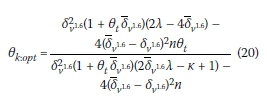
In this formulation θt= 6(pt:vd) is the standard score (i.e. the number of standard deviations away from the mean) of the design value, and the X and K are the skewness and kurtosis of the Gumbel distribution, equal to 1.14 and 5.4 respectively.
The δv1.6 can be estimated by weighting the estimated coefficient of variation of each of the N series δv1.6iby its sample size nias suggested by Hosking and Wallis (2005):
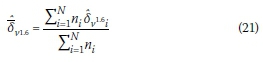
and if N is large enough (> 20), then δv1.6 ~ δv1.6. Bakker (2021) recommended that thunderstorm and synoptic dominated areas be considered as separate regions with their own δv= 1.6. The 83 thunder-storm series yield Sv1.6 = 0.25 and the 87 synoptic series yield δv1.6 = 0.18.
An estimate of the design wind speed vdcan thus be found for a pt:vd. This can be expressed as vd= f(Pt:Vd, ©) where/denotes that vdis a function of pt:vdand some other parameters © dependent on the available data. In sites with a single mechanism © = {μv1.6, σv1.6, n, δv1.6} and in sites with two mechanisms the parameters from both need to be considered © = {©1, ©2}. The vd at sites with more than one mechanism can be found by accounting for multiple mechanisms, as recommended by Gomes and Vickery (1978), described in Appendix A.
The procedure outlined in this section provides a solution for the estimation of vdat weather stations throughout South Africa, but it is still unclear how to extend this information for the entire country and incorporate it into the standard.
UPDATING DESIGN WIND LOADS IN SANS
The current wind loads in SANS 101603:2019 are the culmination of a significant research effort that includes detailed surface roughness correction (Kruger et al 2011), climatic classification (Kruger et al 2010), statistical modelling (Kruger et al 2013a), mapping considerations (Kruger et al 2013b; 2017), and expert engineering and climatological knowledge.
The estimation procedure outlined above with some interpolation procedure (Ye et al 2015) could be used to replace the current map, although much of the information contained in it would be lost. Alternatively, the current map could be used as a basis from which changes are recommended where new data (Bakker & Viljoen 2019) and statistical techniques (Bakker et al 2021; Bakker 2021) provide a strong enough indication that the current values are inappropriate. This approach will incorporate the new information and provide a solution to the extension of the design values throughout the country, while maximising the amount of expert knowledge retained.
Comparison of estimated design loads to SANS
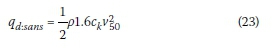
Using the pt:vd= 2 x 10⁻³ design fractile and the statistics from the available data ©, vdcan be estimated at each station using the optimal estimation procedure described in the previous section vd= f(2 x 10⁻³, ©). An estimated design load qdfor each station can then be obtained using Equations 1 and 10:
This can be compared to the design wind load currently specified by SANS 10160-3:2019:
where v50is found using the characteristic wind map in SANS 10160-3:2019 (Figure 1).
The difference between the predicted qd and the current qd.sansdesign load can be assessed as:
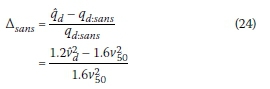
The distribution of Δsans values from all the stations is summarised in Figure 5. This shows that SANS 10160-3:2019 is conservative overall, with the average Δsans = -10%, which could be attributed to the conservative measures taken by Kruger (2011) or the use of wind speed intervals in the map (Botha et al 2018b). There are qdvalues that differ significantly from qd:sans, suggesting that some could be reconsidered.
Identification of stations with unacceptable design wind speeds
The accuracy of vdis dependent on the quantity and quality of the v data used. Therefore, updating qd.sansto closely match qdmay not always result in the most appropriate design loads.
Large differences between qd.sansand qd present evidence that qd:sans should be changed, but stations with more data present stronger evidence because there is higher confidence in these estimates. To determine at which stations there is enough evidence to reconsider qd:sansa statistical test was developed. This is based on the null hypothesis H0 that the current design value is correct:
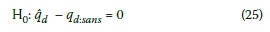
If the pt:vd= 2 X 10⁻³ design fractile is accepted, then this H0 is equivalent to:
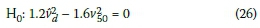
A statistical test with this null hypothesis means sufficient evidence must be presented before modification of the current standard is considered.
This test is founded on the assumption that v1.6is Gumbel-distributed and that μ^v1.6and σ^v16 are fairly unbiased estimators of the mean and standard deviation (Bakker et al 2021; Bakker 2021). To test H0, a set of simulated vd values is obtained through Monte Carlo simulation:
1. For a series of n representative wind speed v observations available at a station, it is assumed that v1.6follows a Gumbel distribution with mean μv1.6and standard deviation σv1.6 equal to the sample estimates at the station.
2. Then n simulated wind speeds vsimare drawn from this Gumbel distribution.
3. The mean μv1.6.simand standard deviation σv1.6:sim ofvsim are estimated.
4. The ®sim= {μv1.6:sim, σv.1.6sim n δV1.6} isthus available. For stations in a mixed climate, steps 1 to 3 are performed for each separate mechanism and ® sim = {®sim:1 ®sim:2}.
5. Asimulated vdis then vd:sim= f(pt:vd'®sim).
6. Steps 2 to 5 are repeated m times to obtain a set of m simulated vd:simvalues.
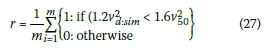
The proportion r of simulated design values which would result in a load less than qd:sans is then calculated as:
If m is large enough then a P-value can be found:
A significance level a* can be selected and if P-value < a*, then H0 can be rejected, and a change of qd:sansat that station considered. The r value also indicates whether an increase r < a*/2 or decrease r > 1 - a*/2 in qd:sansshould be considered.
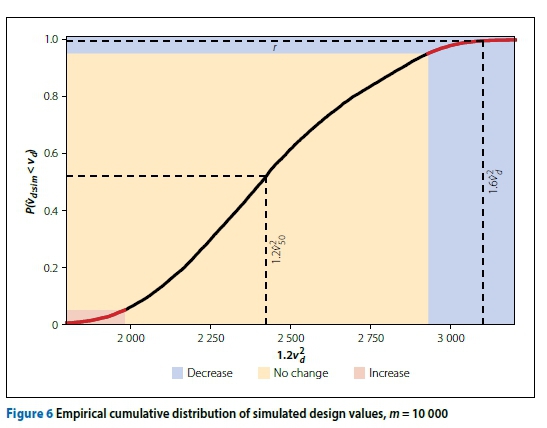
To demonstrate application of the test, an example showing how r, vd, and v50relate to the empirical distribution of v(i.simat the Worcester station is shown in Figure 6, where m = 10 000 was used. An r value of 0.995 was obtained, which means that the current design value can be rejected at a high significance level and that a decrease in the prescribed wind speed could be considered.
Recommended changes to SANS 10160-3
Bakker and Viljoen (2019) described the quality control of the data. This involved visual inspection of each gust to remove erroneous measurements, surface roughness correction, and accounting for the dynamic response of data recorded using a Dines anemometer. Bakker and Viljoen (2019) did not account for topographical features or obstructions around instruments, so some stations with poor exposure cannot be considered representative of typical climatic conditions. Of the 132 stations, 102 have data with acceptable exposure.
Figure 7 overlays the results of the hypothesis test developed in the previous section applied to each of these 102 stations onto the current characteristic map. On this figure the shape and colour indicate whether an increase or decrease would be appropriate (red triangles vs blue inverted triangles) according to r, and the size of the symbol indicates the strength of the evidence against the current value (P-value). This figure will be used to guide recommended changes to SANS 10160-3:2019.
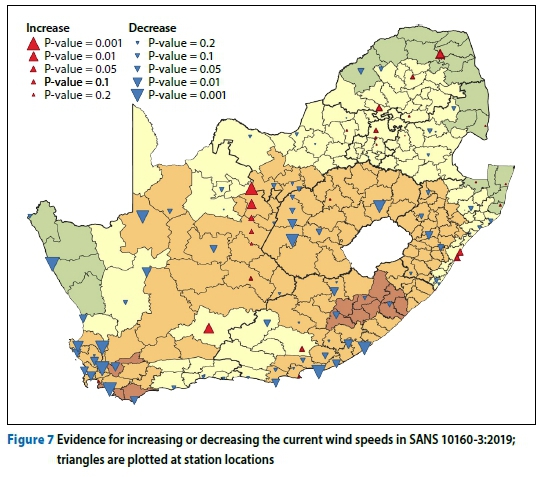
Figure 7 shows that, while there are some isolated municipalities where an increase could be considered, notably the eThekwini (Durban) metropolitan municipality, there is strong evidence to support the reduction of qd:sansthroughout much of South Africa. This is especially clear in the southwest of the country where synoptic winds dominate the extreme wind climate, such as the western parts of the Western Cape and a stretch along the Eastern Cape coast. The indication of a decrease in these areas can be attributed to the lower coefficient of variation in these areas, which means that yw= 1.6 was probably overly conservative in these regions.
For 150 of the 234 municipalities there are no usable weather stations, and so no wind speed data is currently available. These municipalities tend to be rural, with limited development, and thus the lack of data is not a major issue as SANS 10160-3:2019 aims to provide for the built environment.
To improve the standard, different qd-sansvalues which better represent the data could be recommended. The areas where change could be considered can be identified using Figure 7. To streamline the revision process and simplify implementation for practising engineers, it would be desirable if these changes can be made without significantly modifying the current format of the standard.
Specifying vdvalues per reliability class, as done in ASCE 7-16 (ASCE 2017) and AS/ NZS 1170.2 (AS/NZS 2011), would require a substantial modification to the format of SANS 10160-3:2019. Synoptic and thunder-storm winds, which dominate South Africa, are more similar to each other than cyclonic winds (Holmes 2018). Therefore, adjusting the design value from the reference reliability (annual ßt= 4.0) (Retief & Dunaiski 2009) to other classes should not introduce significant error and only the vdcorresponding to ßt= 4.0 will be considered. This means that modification to the standard could be implemented by making adjustments to the characteristic wind speed map (Figure 1).
New characteristic wind map
There are a number of valid approaches which could be used to update the characteristic map, and therefore updating will
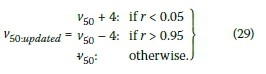
be a somewhat subjective process. As a starting point, a* = 0.1 is used to inform a first round of updates. The current V50 values are thus increased or decreased to an updated value v50.Updated as:
It was found that 42 stations had a P-value < 0.1, indicating that at these locations there is reasonable justification to change the qd:sans. For the majority of these stations a decrease in qd:sanscould be considered, with r > 0.95 at 37 stations.
Some municipalities have multiple stations. In this case, a change was only implemented if it could be supported at all the stations in the municipality. This was the case for Buffalo City (East London), eThekwini (Durban), and Saldanha Bay. If stations in a municipality contradicted each other, then the more conservative option was taken and only increasing v50 was considered. This was the case for the City of Cape Town and Msunduzi (Pietermaritzburg) where the current V50values were maintained despite one station indicating that a decrease could be appropriate.
The V50:updatedvalues are shown in Figure 8 where municipalities with data are highlighted. Because the selection of a* = 0.1 is somewhat arbitrary, this updated map is only meant to serve as a foundation for further changes.
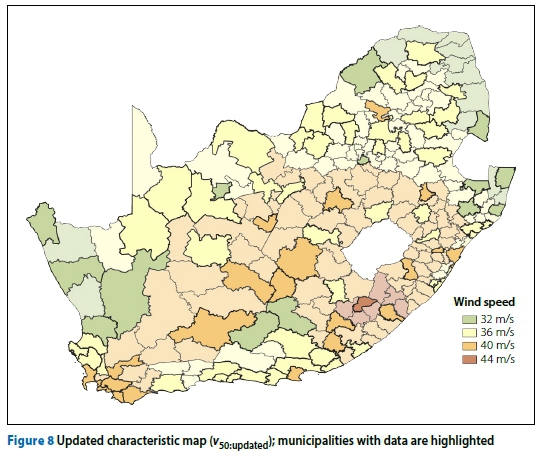
The Koingnaas station located in the Kamiesberg municipality indicates that a decrease could be considered at a 10% significance level, but here v50= 32 m/s and could not be decreased without creating another v50category. Since this is an isolated case, another category was not created, and the current value was maintained atv50:updated= 32 m/s.
A noticeable difference between the updated map versus the current map is the reduction in municipalities with the highest v50= 44 m/s wind speed category. There is only one station (Elliot) for which v50= 44 m/s cannot be rejected at a 10% significance level. The data from this station still indicates that a decrease would not be unreasonable with r = 0.92. Therefore, without reasonable justification to maintain the v50= 44 m/s category, it is recommended that it be eliminated.
Historical data, recorded using a Dines anemometer, is available for several stations. This data is of lower quality due to uncertainty in the accuracy of the correction applied by Bakker and Viljoen (2019). Inclusion of the Dines data results in less variation of v2d.simvalues which leads to lower P-values. Given these uncertainties in the quality of this data, it alone was not considered sufficient evidence to modify qd.sans. It was checked whether the more recent data, for which there is more certainty in the exposure and instrument response, could support a change independent of the Dines data. If it could not, as was the case at the Cape Town station, then changes were not made.
Kruger et al (2017) assigned the current v50values to municipalities without data, using interpolation and his knowledge of climatology. Therefore, it is argued that the v50values at these municipalities can be changed to create a smoother map where necessary. There are also some isolated municipalities where the v50.updated value is surrounded by stations which generally support a different v50.updated value. These irregularities were removed by adopting the more common v50.updated from surrounding stations.
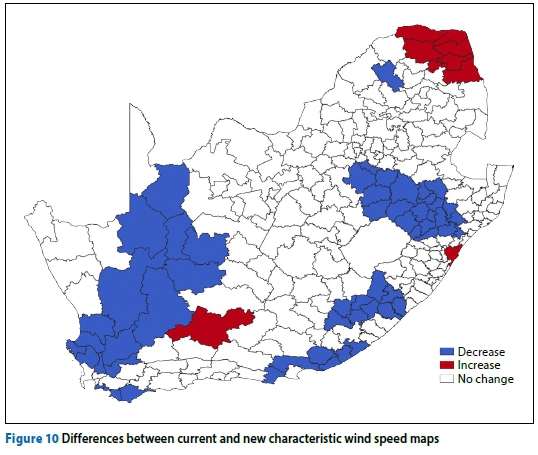
The smoothing and elimination of v50= 44 m/s in the updated map yielded a final recommended characteristic wind speed map, shown in Figure 9. The new map results in changes to 63 of the 234 municipalities throughout the country (Figure 10), of which 54 involve a decrease in v50.
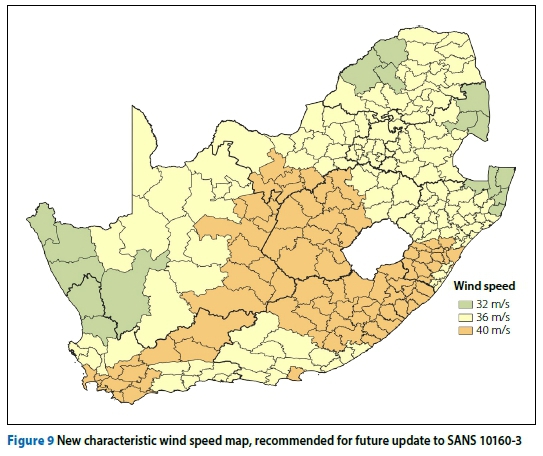
There are eight metropolitan municipalities in South Africa. These contain a large proportion of the population and built environment of the country, which means changes to SANS 10160-3.2019 in these areas are of higher consequence. The new map recommends changes for the eThekwini (Durban) and Buffalo City (East London) metropolitan municipalities. In both eThekwini and Buffalo City a P-value < 0.1 was observed at two stations, which is considered to be sufficient evidence that the recommended changes for metropolitan municipalities could be adopted.
CONCLUSIONS
The South African Weather Service has collected a large quantity of wind speed data which has been organised into a dataset appropriate for assessment of the South African wind loading standard. This data can be incorporated into the standard by directly considering the design values rather than characteristic values to utilise more information and better attain the target reliability.
This study does not aim to modify the reliability level of the standard. Thus, to avoid recalibration, the annual design wind speed exceedance probability currently provided by the standard could be used to estimate design wind speeds.
To find this exceedance probability, an approach used for the American ASCE standard was investigated. This was found to be inappropriate, as it made the assumption that all wind loading uncertainties could be attributed to wind speeds, which does not match the assumptions used to derive the current loads in the South African standard.
Instead, the wind load uncertainty models used to calibrate the current standard were applied to calculate the exceedance probability of a design wind speed and an effective partial factor for other components of the design load. Together these were used to estimate the design wind load using the available data and an optimal procedure that combines wind speed data collected at a specific site with regional averages.
Deviation of the estimated design values from the current design values provides evidence in favour of changing the current design values, although the strength of this evidence is dependent on the quantity and quality of the data used. To determine where there was sufficient evidence that the current design values were inappropriate, a statistical hypothesis test was developed.
This test indicated that changes to the current design values could be considered at a number of sites throughout the country. These changes were implemented in a new characteristic map of basic wind speed (Figure 9) that should lead to a better reflection of the South African climate in the standard.
REFERENCES
Ang, A H-S & Tang, W H 1984. Probability concepts in engineering planning and design. Vol 2. Decision, risk, and reliability. New York: Wiley, p 608. [ Links ]
ASCE (American Society of Civil Engineers) 2017. ASCE 7-16. Minimum Design Loads and Associated Criteria for Buildings and Other Structures. Reston, VA: ASCE. [ Links ]
AS/NZS (Australian Standard/New Zealand Standard) 2011. AS/NZS 1170.2 (2011). Structural Design Actions. Part 2. Wind Actions. Joint Technical Committee BD-006, Australia/New Zealand. [ Links ]
Bakker, F P & Viljoen, C 2019. An analysis of South African wind gust data in the context of the built environment. Proceedings, 7th International Conference on Structural Engineering, Mechanics and Computation (SEMC 2019), Boca Raton, FL: CRC Press, pp 2352-2358. [ Links ]
Bakker, F P, De Koker, N & Viljoen, C2021. Preconditioning wind speeds for standardised structural design. Engineering Structures, 238, 111856. [ Links ]
Bakker, F P2021. Characterisation of the South African extreme wind environment relevant to standardisation. PhD Thesis. Stellenbosch University. [ Links ]
Baravalle, M & Köhler, J 2018. On the probabilistic representation of the wind climate for calibration of structural design standards. Structural Safety, 70: 115-127. [ Links ]
Botha, J 2016. Probabilistic models of design wind loads in South Africa. PhD Thesis. Stellenbosch University. [ Links ]
Botha, J, Retief, J & Viljoen, C 2018a. Reliability assessment of the South African wind load design formulation. Journal of the South African Institution of Civil Engineering, 60(3): 30-40. [ Links ]
Botha, J, Retief, J V & Viljoen, C 2018b. Uncertainties in the South African wind load design formulation. Journal of the South African Institution of Civil Engineering, 60(3): 16-29. [ Links ]
Castillo, E, Hadi, A S, Balakrishnan, N & Sarabia, J M 2005. Extreme Value and Related Models with Applications in Engineering and Science. Hoboken, NJ: Wiley. [ Links ]
Cook, N 1985. The designers' guide to wind loading of building structures. Part 1. Watford, UK: Building Research Establishment. [ Links ]
Cook, R, Griffis, L, Vickery, P & Stafford, E 2011. ASCE 7-10 wind loads. Proceedings, Structures Congress 2011, 14-16 April 2011, Las Vegas, NV, pp 1440-1453. [ Links ]
Davenport, A 1982. The interaction of wind and structures. In Plate, E J (Ed.), Engineering Meteorology. Amsterdam: Elsevier, pp 527-572. [ Links ]
Ellingwood, B R & Tekie, P B 1999. Wind load statistics for probability-based structural design. Journal of Structural Engineering, 125(4): 453-463. [ Links ]
EN (European Standard) 2005. EN 1991-1-4 2005. Eurocode. Actions on Structures. Parts 1-4: General Actions - Wind Actions. Brussels: European Committee for Standardisation (CEN). [ Links ]
Friedman, J, Hastie, T & Tibshirani, R 2001. The Elements of Statistical Learning. Vol 1. New York: Springer Series in Statistics. [ Links ]
Goliger, A M, Retief, J V & Kruger, A C 2017. Review of climatic input data for wind load design in accordance with SANS 10160-3. Journal of the South African Institution of Civil Engineering, 59(4): 2-11. [ Links ]
Gomes, L & Vickery, B 1978. Extreme wind speeds in mixed wind climates. Journal of Wind Engineering and Industrial Aerodynamics, 2(4): 331-344. [ Links ]
Gulvanessian, H & Holicky, M 2005. Eurocodes: Using reliability analysis to combine action effects. Proceedings of the Institution of Civil Engineers -Structures and Buildings, 158(4): 243-252. [ Links ]
Holicky, M 2009. Reliability Analysis for Structural Design. Stellenbosch: African Sun Media. [ Links ]
Holmes, J D 2018. Wind Loading of Structures. Boca Raton, FL: CRC Press. [ Links ]
Hong, H, Mara, T, Morris, R, Li, S & Ye, W 2014. Basis for recommending an update of wind velocity pressures in Canadian design codes. Canadian Journal of Civil Engineering, 41(3): 206-221. [ Links ]
Hong, H P, Ye, W & Li, S H 2016. Sample size effect on the reliability and calibration of design wind load. Structure and Infrastructure Engineering, 12(6): 752-764. [ Links ]
Hosking, J R M & Wallis, J R 2005. Regional Frequency Analysis: An Approach Based on L-Moments. Cambridge, UK: Cambridge University Press. [ Links ]
JCSS (Joint Committee on Structural Safety) 2001. JCSS Model Code (2001 February). Probabilistic Model Code. JCSS Standard. [ Links ]
Kruger, A C, Goliger, A M, Retief, J V & Sekele, S 2010. Strong wind climatic zones in South Africa. Wind and Structures, 31(1): 37-55. DOI:10.12989/was.2010.13.1.037. [ Links ]
Kruger, A C 2011. Wind climatology of South Africa relevant to the design of the built environment. PhD Thesis. University of Stellenbosch. [ Links ]
Kruger, A, Retief, J & Goliger, A M 2011. An updated description of the strong-wind climate of South Africa. Proceedings, 13th International Conference on Wind Engineering, 10-15 July 2011, Amsterdam, Netherlands. [ Links ]
Kruger, A, Retief, J & Goliger, A M 2013a. Strong winds in South Africa. Part 1. Application of estimation methods. Journal of the South African Institution of Civil Engineering, 55(2): 29-45. [ Links ]
Kruger, A, Retief, J & Goliger, A M 2013b. Strong winds in South Africa. Part 2. Mapping of updated statistics. Journal of the South African Institution of Civil Engineering, 55(2): 46-58. [ Links ]
Kruger, A C, Retief, J & Goliger, A 2017. Development of an updated fundamental basic wind speed map for SANS 10160-3. Journal of the South African Institution of Civil Engineering, 59(4): 12-25. [ Links ]
Milford, R 1985. Extreme value analysis of South African gust speed data. CSIR Unpublished Internal Report, 85/4. Pretoria: CSIR. [ Links ]
Milford, R V 1987. Annual maximum wind speeds for South Africa. Civil Engineering/Siviele Ingenieurswese, 1987: 15-19. [ Links ]
Palutikof, J, Brabson, B, Lister, D & Adcock, S 1999. A review of methods to calculate extreme wind speeds. Meteorological Applications, 6(2): 119-132. [ Links ]
Retief, J V & Dunaiski, P 2009. Background to SANS 10160: Basis of Structural Design and Actions for Buildings and Industrial Structures. Stellenbosch: African Sun Media. [ Links ]
SANS (South African National Standard) 2019a. SANS 10160-1. Basis of Structural Design and Actions for Buildings and Industrial Structures. Part 1. Basis of Structural Design. Pretoria: SABS Standards Division. [ Links ]
SANS (South African National Standard) 2019b. SANS 10160-3. Basis of Structural Design and Actions for Buildings and Industrial Structures. Part 3. Wind Actions. Pretoria: SABS Standards Division. [ Links ]
Ye, W, Hong, H & Wang, J 2015. Comparison of spatial interpolation methods for extreme wind speeds over Canada. Journal of Computing in Civil Engineering, 29(6): 04014095. [ Links ]
 Correspondence:
Frederik Bakker
Department of Civil Engineering Stellenbosch University
Private Bag X1, Matieland 7602, South Africa
T: +27 84 392 1123; E: fred_bakker@trimble.com
Nico De Koker
Department of Civil Engineering, Stellenbosch University
Private Bag X1, Matieland 7602, South Africa
T: +2 7 21 80 8 4 434; E: ndekoker@sun.ac.za
Celeste Viljoen
Department of Civil Engineering, Stellenbosch University
Private Bag X1, Matieland 7602, South Africa
T: +27 21 808 4444; E: celesteviljoen@sun.ac.za

DR FREDERIK BAKKER obtained a BEng (Civil) degree in 2017 and a PhD (Structural Engineering) in 2021, both from Stellenbosch University. His research interests are in structural reliability, wind loading, and informatics. He is currently employed as a Software Engineer at Trimble Quest in Cape Town.

PROF NICO DE KOKER (Pr Eng, MSAICE) is a computational physicist and structural engineer, currently serving as Head of the Department of Civil Engineering at Stellenbosch University. Following many years specialising in thermodynamics and heat transfer in materials at extreme conditions, he shifted hisfocusto engineering, completing a second PhD in reliability-based design through Stellenbosch University. His research interests focus on the analysis of uncertainty in engineering calculations, and its expression in design via risk and reliability.

PROF CELESTE VILJOEN (Pr Eng, FSAICE) is currently Vice-Dean Teaching in the Faculty of Engineering at Stellenbosch University, after previously serving as Head of the Division of Structural Engineering and Civil Engineering Informatics at the same university. Her research considers structural risk and reliability, including the assessment of various structural standard provisions in reinforced concrete design, steel design, and loading. She has been widely involved in structural standardisation, notably as the convenor of the SANS 10100-3 Working Group, member of the Working Group for the Revision of ISO 13824, and member of the International Joint Committee on Structural Safety.
APPENDIX A
A series of annual maximum wind speeds may not be identically distributed, because the extreme wind environment could be a result of m different extreme wind mechanisms.
The v fractile vjointthat results from the joint distribution of m mechanisms for a given exceedance probability p is unknown. This can be found if the extreme wind speed record can be segregated by mechanism, i.e. an extreme from each mechanism extracted per block and the joint distribution considered, as recommended by Gomes and Vickery (1978).
The v jointis equal to the fractile of each marginal distribution vi:
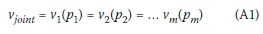
Provided each mechanism is independent, p can be related to the exceedance probability of each independent mechanism pias:
These m unknown pivalues and the unknown vjointconstitute (m + 1) unknowns.
Equations A2 and A3 yield a system of (m + 1) equations. Therefore, provided each vican be related to pi, the (m + 1) equations can be used to solve the (m + 1) unknowns. This solution will provide the v jointfor a given p, as is typically required.

