


Services on Demand
Article
 English (pdf)
 Article in xml format
 Article references
Indicators

Related links
-
 Cited by Google
 -
 Similars in Google
Share

 Permalink
Journal of the South African Institution of Civil Engineering
On-line version ISSN 2309-8775
Print version ISSN 1021-2019
J. S. Afr. Inst. Civ. Eng. vol.64 n.1 Midrand Mar. 2022
http://dx.doi.org/10.17159/2309-8775/2022/v64n1a2
TECHNICAL PAPER
Utilising Land Type data for geotechnical investigations
G C Fanourakis
ABSTRACT
In South Africa, a Land Type Survey (LTSS) has been conducted of the entire country. The information available from the LTSS is readily and inexpensively made available to the public (in the form of maps and accompanying memoirs). This survey includes information on the climate, terrain and soils. The soil information given includes qualitative data (such as pedological classifications, soil profiles and soil types), as well as quantitative physical and chemical properties of representative soils tested. Such information is used primarily for agricultural purposes. This paper proposes an approach for inferring information, of relevance in reconnaissance geotechnical engineering surveys, from Land Type data, to supplement geotechnical investigation data. The proposed procedure was verified using actual information from a geotechnical report. This investigation indicated that general engineering properties can be inferred from qualitative pedological data. In addition, statistically significant engineering properties (including the grading, Atterberg Limits and the USCS and AASHTO classifications) were determined from quantitative pedological data, in 86% of cases, for the soils considered. It is evident from this research that data from the Land Type survey data can be successfully used for geotechnical investigation purposes for certain developments (such as roads and townships) where the depth of interest is relatively shallow.
Keywords: land type survey, soil surveys, pedology, soil mapping, geotechnical investigations
INTRODUCTION
Pedological classification systems and databases
There are various definitions of pedology. Essentially, pedology is the study of soils as naturally occurring phenomena, including their formation, composition, classification and distribution.
A number of pedological soil classification systems have been established and used as a basis for mapping soils. Such systems, which include an internationally accepted system and many national systems, are listed in Fanourakis (2012) and Fanourakis (2022).
The commonly used South African Pedological Soil Classification System is titled "Soil Classification: A Binomial System for South Africa" (MacVicar et al 1977). An overview of this classification is given in Fanourakis (2012).
Pedological databases
Various international, regional and national databases comprising pedological, climatic, topographical and other information have been developed, as detailed in Fanourakis (2012).
The South African database, which contains information for the entire country, is the Land Type Soil Survey (LTSS 2021).
The Land Type Survey has been incorporated into the SOTER (Soil and Terrain) world database, which includes maps and soil information (in a standard format), that has already been compiled for a number of countries. This includes the New Generation Soil Property Maps for Africa (ISRIC 2021).
Therefore, a significant amount of pedological classification and mapping has been conducted worldwide. Although this data is used primarily for agricultural purposes, such information, particularly that on soils and terrain, could be used for geotechnical engineering investigations.
The Land Type Survey
The Land Type Survey, which was initiated in 1972 and was completed in 2002 (Patterson et al 2015), comprises a publicly available completed survey of the entire South Africa, which includes information on the soils, terrain, climate and geology. This survey was conducted by the Institute of Soil, Climate and Water (formerly the Soil and Irrigation Research Institute) of the Agricultural Research Council.
The soil data included in the Land Type Survey of South Africa (LTSS 2021) includes the pedological properties and pedological classification in accordance with the South African Binomial Classification System (after MacVicar et al 1977).
The data acquired in the course of the Land Type Survey is published in the form of maps (at a scale of 1:250 000), known as Land Type maps, and accompanying documents which are referred to as Land Type memoirs. At the time of publication of this paper, the cost of a Land Type map on paper (on a topo-cadastral background) was R100.00 and on semi-transparent matt film (without a topo-cadastral background) was R350.00. The cost of memoirs, which are currently mainly available on CD (as opposed to a hardcopy book), was R75.00 each. In addition, an optional CD containing an explanation of the contents of any particular map is available at a cost of R75.00.
Objectives of this paper
Despite the different depths of soil which are of concern in pedology and in engineering, information gathered by pedologists is also of potential use to engineers. Translating the classification system on which pedological maps, such as the Land Type maps, are based into engineering terms, even if only for the uppermost 1.2 m of the soil profile, may be of significant value in engineering projects concerned with transportation links, canals, township development and the location of natural construction materials (Harmse & Hattingh 1985).
Paige-Green and Turner (2007) generally discussed how the information from the Land Type Survey could potentially assist, specifically, in road engineering surveys. Furthermore, Calitz (2021) developed a detailed Soils Effects Grouping (SEG) system to convert pedological information to information useful in geotechnical assessments. The approach used by Calitz (2021) is different to that discussed in this paper.
The primary objective of this paper is to demonstrate the extent to which Land Type data can be used in geotechnical investigations, particularly at the reconnaissance stages, which are undertaken at the planning stages of proposed developments, where the depth of interest is relatively shallow (e.g. for roads and township developments). The terrain and soil information inferred from the LTSS would typically be used together with other information, such as geological maps, aerial photographs, topographical maps and technical reports (if available) to effectively plan detailed soil surveys. In this paper, this was illustrated by utilising the LTSS data pertaining to a particular road route to infer information or estimate properties applicable to the reconnaissance geotechnical investigation. The inferred information was then verified by being compared to the data from the actual engineering geotechnical investigation report that was compiled for the same road.
In achieving this objective, an overview of the information that is incorporated in the Land Type Survey is given.
THE LAND TYPE SOIL SURVEY
The identification of Land Types
Areas known as Land Types were identified and delineated on a 1:250 000 scale, such that each Land Type displayed a marked degree of uniformity with regard to terrain form, soil pattern and climate. The Land Types were initially delineated on 1:50 000 quarter degree sheets, each comprising a 1:250 000 sheet, and then the boundaries were transferred onto the relevant 1:250 000 sheets (LTSS 2021).
The establishment of Land Type inventories
Approximately 7 070 Land Types were established, based on approximately 400 000 soil observations, which translate to approximately one observation per 300 ha (Patterson et al 2015).
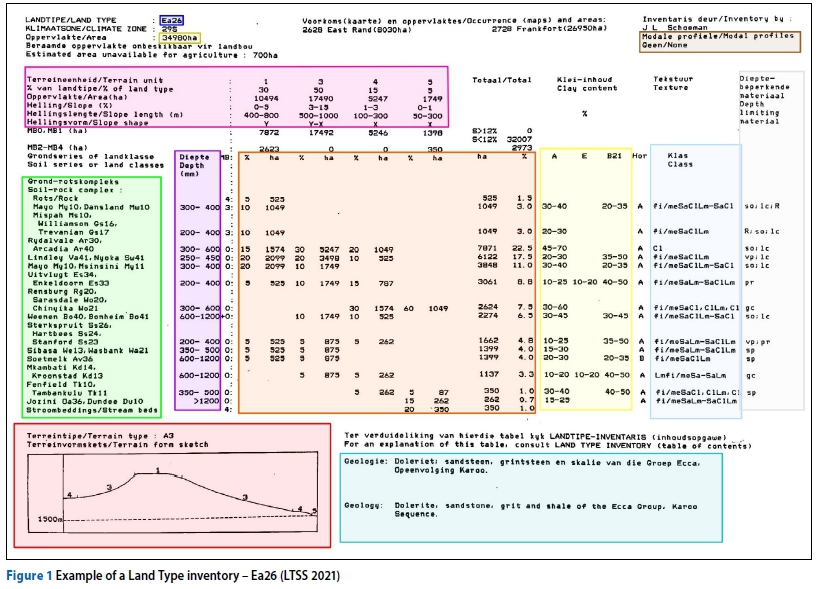
A Land Type inventory was established for each delineated unit (Land Type). The Land Type inventories are included in the relevant memoirs. Each Land Type inventory contains information on the terrain, pedology, climate and geology of that Land Type. An example of a Land Type inventory is shown in Figure 1 (on page 13).
With reference to Figure 1, the following information regarding soil and terrain is included in the inventory:
■ The Land Type designation (shown in the blue rectangle), corresponding with that on the map unit (e.g. Ea26).
■ The area of the Land Type unit (shown in the olive rectangle).
■ A terrain type and terrain form sketch (profile sketch) in the red rectangle. This indicates the terrain type (e.g. A3) which is based on estimates of the slope and local relief, according to standard ranges, representative of the terrain characterising the Land Type. The section (profile) which is representative of the terrain of the Land Type comprises (numbered) terrain units. A terrain unit is any part of the land surface with a homogeneous form and slope (LTSS 2021).
■ Classification of the soils occupying the Land Type according to the South African Binomial Classification System (MacVicar et al 1977) (shown in the green rectangle).
■ Clay content ranges for each soil horizon type (shown in the yellow rectangle).
■ The textural class of each horizon (shown in the light blue rectangle).
■ Depth range of soil/rock horizons of each soil form (shown in the purple rectangle).
■ The depth limiting material in the case of each soil form (shown in the grey rectangle)
■ The area of each of the terrain units that is occupied by the different soil series, as well as the area occupied by rock, is estimated in terms of percentages of the area of that unit, as well as in hectares (shown in the orange rectangle).
■ The percentage and area (in hectares) of the Land Type occupied by each of the terrain units (numbers 1 to 5 in the terrain form sketch; red rectangle) as well as the slope and slope shape of each of the units, are shown in the magenta rectangle
■ The geology of the Land Type unit (shown in the turquoise rectangle).
■ The numbers of any modal profiles (see below) in that Land Type, shown in the brown rectangle.
Similarities between Land Types and land systems of engineering regional surveys
Regional surveys carried out for engineering projects include the detailed mapping of selected areas which are representative of each land system. This entails the gathering of general information regarding the climate, topography, vegetation, soil and rock comprising each selected area. Each representative area consists of landfacets such as crests, midslopes, footslopes and valley bottoms (Brink et al 1982). In addition, the soils in each land facet are sampled for testing for the relevant properties. Using this soil data together with the information acquired on the terrain of the land system - such as the approximate altitude range, approximate relief, gradient conditions, type of surface form and the extent of cut required in a particular project - the suitability of the land system for the proposed development may be evaluated (Brink et al 1982).
The Land Types and terrain units of the Land Type Survey are comparable in information gathered to the land systems and land facets, respectively, of the engineering terrain classification system (delineated during regional surveys). The Land Types and land systems are delineated at the same scale.
The in-depth analysis of modal soil profiles
A number of soil profiles, termed modal profiles, were identified in each area covered by a 1:250 000 Land Type sheet. The locations of these profiles, which are indicated on the relevant Land Type map, are such that the range of soils occurring on the Land Type sheet is represented by these profiles (LTSS 2021). These modal profile numbers are also included in the Land Type inventories.
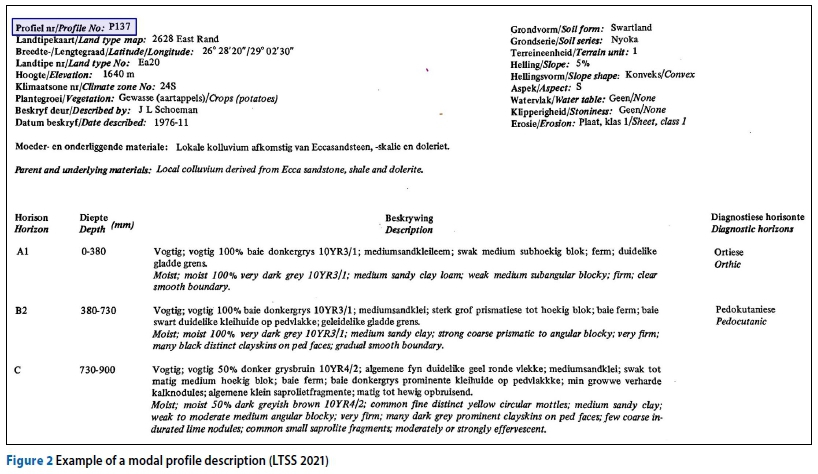
Approximately 2 500 modal profiles were described countrywide (Patterson et al 2015). The soil occurring in the uppermost 1.2 m of each modal profile is described according to pedological terminology and classified according to the South African Binomial System (MacVicar et al 1977). An example of a modal profile description (P137) is given in Figure 2 (LTSS 2021).
As is evident from Figure 2, substantial information is included in the profile description. This includes the pedological classification, coordinates, elevation, climate zone, terrain unit type, slope, slope shape and details on the water table. In addition, each layer is described according to moisture, colour, consistency, structure and soil type. Although some of the standard terminology may differ from that of Jennings et al (1973), which is employed by the geotechnical fraternity, the engineering terminology can be inferred from the pedological terminology. Furthermore, unlike the Jennings et al (1973) method, where the origin is given for each layer, the pedological system states the parent and underlying materials for the entire profile.
Analytical data of modal profile horizons
Approximately 10 000 representative soil samples were taken from modal profiles for detailed analysis (Patterson et al 2015).
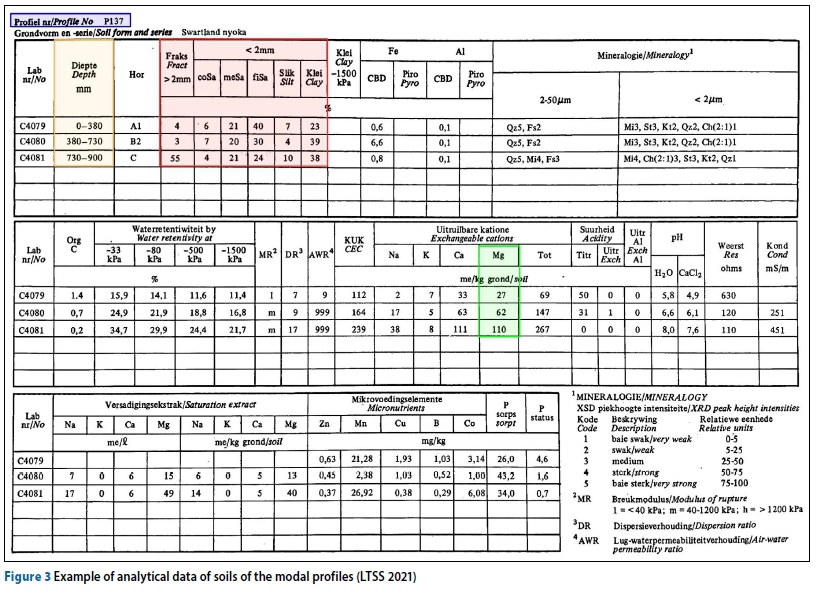
The quantitative physical and chemical properties, as well as the mineralogical composition of the soil comprising each horizon occurring in the uppermost 1.2 m of each modal profile, are given in the Land Type memoirs. A typical example of the physical, chemical and mineralogical data given for each soil of the modal profiles is shown in Figure 3 (LTSS 2021).
With reference to Figure 3, the following data of particular relevance to this paper is included:
■ The pedological classification.
■ The depth range of each horizon (shown in the brown rectangle).
■ The pedological size soil separates (shown in the red rectangle). The sand, silt and clay separates are expressed as a percentage of the mass of the fraction finer than 2 mm.
■ The exchangeable magnesium cations, in milli-equivalents per kg (me% x 10) (shown in the green rectangle).
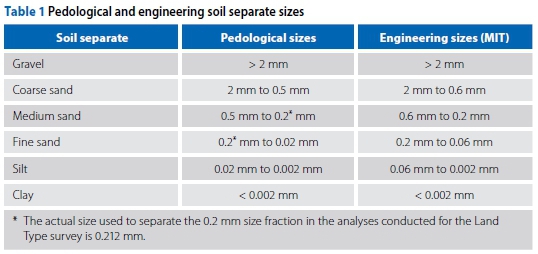
The pedological soil separate sizes, which differ from the MIT Engineering sizes are compared in Table 1.
A comprehensive discussion, including typical examples, on the information that can be obtained from the Land Type maps and their accompanying memoirs, as well as reference to test methods, is included in each Land Type memoir.
METHODOLOGY FOR UTILISING LAND TYPE DATA FOR RECONNAISSANCE ENGINEERING SURVEYS
Approach
The extent to which Land Type data could be used for reconnaissance geotechnical investigations was illustrated by considering an area traversed by an existing road in the Standerton District in the Mpumalanga Province. An approximately 21 km portion of the 22.3 km route, which extends from Roberts Drift to Standerton (Road number P53/3), was considered.
The aim of this theoretical exercise was to assess the extent to which any of the data included in the reconnaissance report, compiled prior to the construction of this road, could have been determined from the Land Type data available for this area. In particular, emphasis was placed on the terrain and soil data aspects. This was done in the following two stages:
Stage one - comprised inferring terrain and soil information, which is relevant for geotechnical investigations, from the relevant Land Type inventories.
Stage two - comprised determining quantitative engineering properties, including grading, plasticity and the USCS (USAEWES 1960) and the AASHTO system (HRB 1945) classification groups, from the quantitative analytical data of soils of the modal profiles, using the model discussed in Fanourakis (2022). This was carried out specifically for the soils previously researched (of the Arcadia, Hutton, Shortlands, Swartland and Valsrivier forms).
Although the model developed by Fanourakis (2022) was based on data of soils in an area located approximately 320 km northeast of the Standerton area, it was applied to the area traversed by the road, as the soils in both areas were expected to be similar (Harmse & Hattingh 1985).
The proposed approach was verified for accuracy by considering the Land Types traversed by an approximately 21 km section of the Standerton-Roberts Drift Road and comparing the information inferred from the Land Type data to the actual properties from the geotechnical investigation report for the same road.
Data used
Land Type data
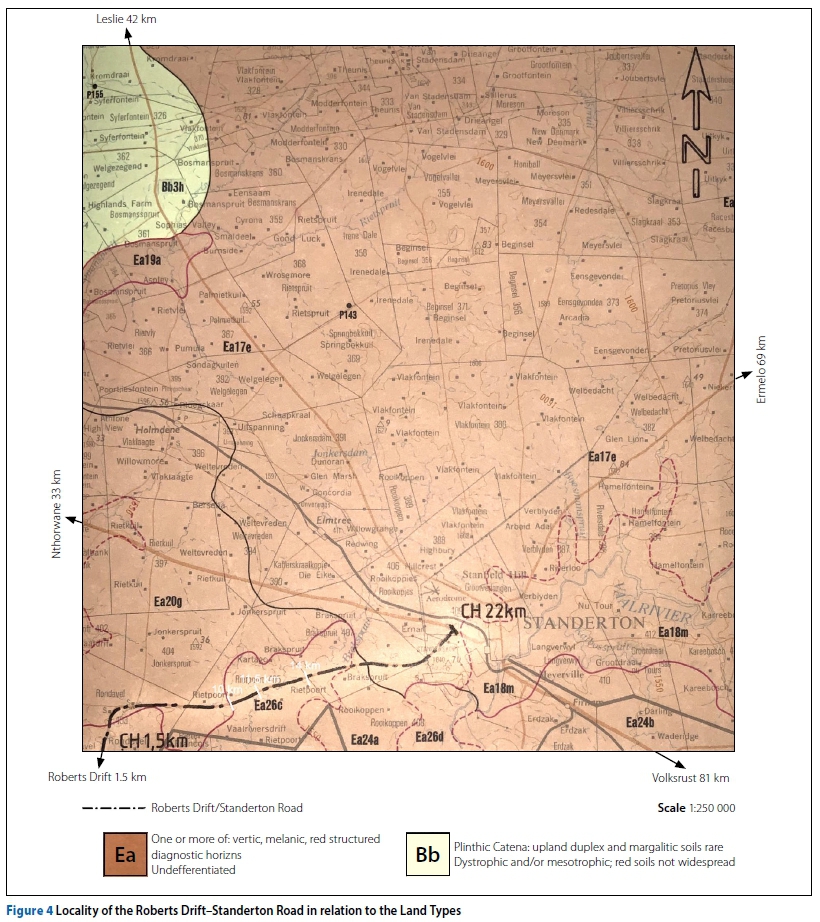
Approximately 21 km of the road considered is located in the area covered by the 2628 East Rand Land Type map and accompanying memoir (LTSS 2021). The remaining 1.5 km portion on the Roberts Drift end of the road occurs in the area covered by the 2728 Frankfort Land Type map. The section of the road covered by the 2628 East Rand Land Type map was considered. Figure 4 shows the locality of the road considered in relation to the Land Types of the Standerton District, from the 2628 East Rand Land Type map.
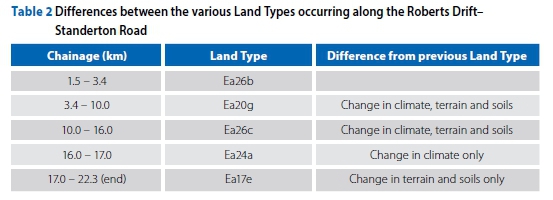
The section of road considered traverses five Land Type units. With respect to possible Land Type boundary types on Land Type maps, solid black indicates a pedosystem boundary, which means that the climate on either side is the same but the terrain and/or soil differ on either side. Solid red lines denote a climate and a pedosystem boundary, which means that either climate, terrain and soil are different on either side, or climate and terrain are different on either side, or climate and soil are different on either side. Broken red lines indicate a climate boundary only (LTSS 2021). Table 2 lists the different Land Types in relation to the road chainages. The respects (climate, terrain or soils) in which the Land Types differ are also listed in this table.
Referring to the Land Type inventories, included in the East Rand memoir (LTSS 2021), four Land Type inventories apply along this route, namely, Ea17, Ea20, Ea24 and Ea26 (see Figure 4). The Land Types Ea26b and Ea26c are characterised by the same soils, terrain and climate, but are separated by another Land Type and hence the lowercase letter following the Ea26 is used to indicate separated occurrences of the same Land Type. Furthermore, Land Type Ea24 comprises the same soils and terrain pattern as Land Type Ea26 but is characterised by a different climate.
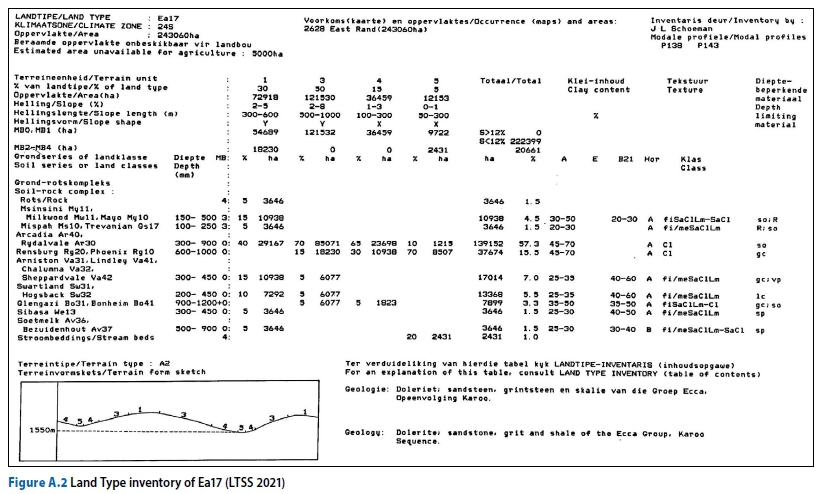
Since climate was irrelevant to this exercise the data given in the Land Type inventory of unit Ea26 was assumed to apply to the area covered by Land Type Ea24 as well. The soil and terrain inventories for the three Land Type units which the road traverses (Ea26, Ea20, Ea17) are given as Figures 1, A1 and A2, respectively (see Appendix for Figures A1 and A2).
A total of six Land Type modal profiles (P130, P136, P137, P138, P141 and P143) occurred in the units traversed by the road. However, P136 comprised soil of the Sterkspruit form that was not researched by Fanourakis (2012) and hence was excluded.
The soil form and series of the profile, depth of horizons and the pedological soil separates and exchangeable magnesium (in me %) for each horizon, for each profile, extracted from the analytical data given for these modal profiles, are given in Table 3. This is the information required by the model proposed by Fanourakis (2022) for estimating grading, plasticity and engineering classifications from pedological data.
Geotechnical report for Roberts Drift-Standerton Road
The data used in this exercise included the reconnaissance report for this road (Van Gruting et al 1975). A total of 28 soil profiles were described as part of the engineering investigation conducted (Van Gruting et al 1975). Disturbed soil samples were taken from a number of these profiles and tested for the determination of their engineering characteristics (mainly grading, plasticity and classifications). Two of these profiles were located within the first 1.5 km of the road, which is covered by the Frankfort Land Type map, and hence were not considered in this exercise.
TRANSLATION OF PEDOLOGICAL DATA INTO ENGINEERING DATA
Stage one - General properties
Geology
In the three Land Type inventories (Ea26, Ea20 and Ea17) pertaining to the area covered by this road, the geology of these areas is given as "dolerite, sandstone, grit and shale of the Ecca Group, Karoo Sequence". Incidentally, the Karoo Sequence is superseded by the Karoo Supergroup. According to the geological sheet covering this area (Council for Geoscience 1986), the dolerite occurs mainly between chainages 10 km and 11.5 km. The geological map also indicates tertiary deposits between chainages 11.5 km and 14 km.
Terrain
According to the three relevant Land Type inventories, more than 80 per cent of the land along the entire route is characterised by slopes of less than eight per cent (the terrain type commences with an "A"). The difference between the highest and lowest points in the landscape is greatest in Land Type Ea26 (between chainages 1.5 km to 3.4 km and 10 km to 17 km), being between 90 m to 150 m (denoted by a local relief class "3" after the "A" in the terrain type. i.e. "A3"). The typical land pattern between these chainages comprises mainly (50%) of mid-slope units (with slopes of 3% to 15% and slope lengths of 500 m to 1 000 m) and (30%) flat crests (with slopes of 0% to 5% and slope lengths of 400 m to 800 m). As dolerite occurs in the area, these crests may be dolerite dykes.
The typical land pattern along the remainder of the route (Land Types Ea20 and Ea17) consists of less local relief (compared to Land Type Ea26), comprising gently undulating hills that are dominated (50% to 60%) by mid-slope units and 30% of crests.
Soils
According to the soil legend which is used on the Land Type maps, the Ea units comprise dark-coloured and/or red soils, usually clayey, which have a high base status (low degree of leaching). More than half of this Land Type is covered by soil forms
with Vertic, Melanic and Red Structured diagnostic horizons (LTSS 2021).
The percentages of the various terrain units (e.g. crests and midslopes) which are occupied by the various soil forms according to the South African Binomial Classification System (MacVicar et al 1977) are given in each inventory (Figures 1, A1 and A2).
From this data the area of each Land Type (expressed as a percentage) which is occupied by rock and various Soil Groups was determined. The seven possible Soil Groups were determined by the author, grouping soil forms which have comparable physical properties from an engineering perspective (for example colour and/or structure and soil type). The colour, structure and soil type are reflected in the characteristics of the various diagnostic horizons which are discussed in the pedological classification handbook (MacVicar et al 1977).
The soil type (texture), according to the pedological textural triangle of the horizon on which series determination is based, is given for the soils of the forms comprising each Land Type in the relevant Land Type inventory. Using the information on soil texture recorded in the Land Type inventory, a point was located in the pedological textural triangle (MacVicar et al 1977). The corresponding point was then located in the engineering textural triangle (Tschebotarioff 1951) which determined the engineering textural soil type.
Table 4 contains the occupancy of each group, horizon depths and engineering soil type (textural class) comprising each unit of each Land Type occurring along the Roberts Drift-Standerton Road.
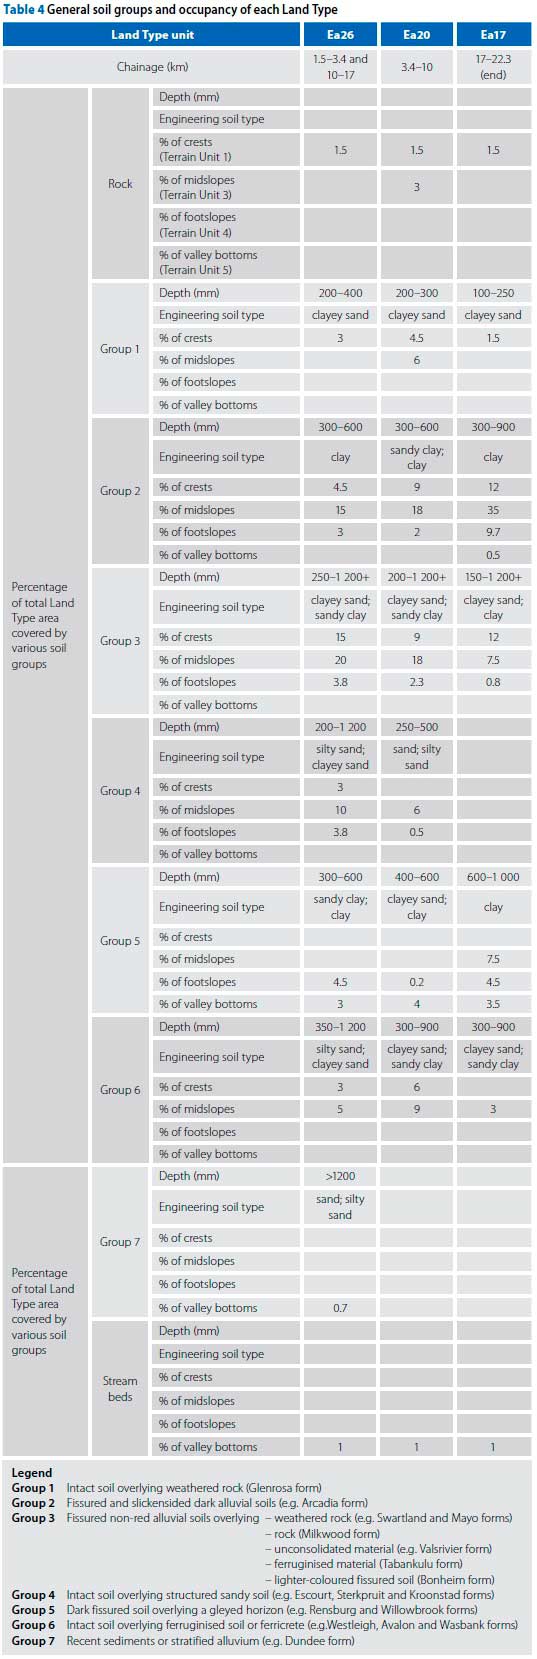
Figure 5 shows the proportion of the various groups, as a percentage, occupying the section of the road considered. These percentages consider the proportion of the road occurring in each of the three Land Type units. These percentages were calculated on the premise that the distribution of the various soils within each Land Type was uniform.
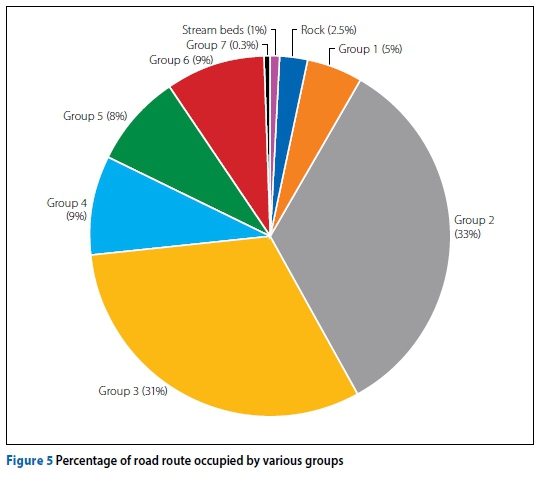
As is evident from Figure 5, the dominant Soil Groups 2 and 3 occupy approximately 33% and 31% of the route, respectively.
Furthermore, certain inferences, regarding engineering properties, can be made for each group, on the basis of physical characteristics and the soil types (textures), for example:
■ Groups 1 and 6 may be prone to settlement.
■ Group 2 will be prone to expansiveness and possibly consolidation settlement.
■ Group 3 may be prone to settlement and expansion.
■ Groups 4 and 7 may be prone to settlement or collapse settlement.
■ Group 5 may be prone to expansion and settlement.
Stage 2 - Estimating quantitative engineering soil properties
Procedure
The engineering soil properties of each horizon were estimated by applying the mathematical model proposed in Fanourakis (2022), using the modal profile data included in Table 3 as input.
However, with regard to the component of the model that estimates engineering grading characteristics from pedological soil separates, there were two deviations from the model pertaining to the estimation of the percentages (by mass of the total sample) passing 0.075 mm and 0.425 mm, referred to as P0.075 mm and P0.425 mm, respectively. These deviations were because the actual size used to separate the 0.2 mm size fraction in the analyses conducted for the Land Type survey was 0.212 mm, whereas in the pedological sieve analyses conducted by Fanourakis (1999) the sieve size was 0.25. This was appropriately accounted for in this paper.
The engineering soil properties were estimated by applying the mathematical model to the modal profile data pertaining to a given unit. A profile in the same unit described as part of the engineering investigation (Van Gruting et al 1975) which had physical properties (such as colour and structure) similar to those of the modal profile was then selected. The engineering profile selected had to be a profile from which samples were taken and for which the test results were available. The estimated and actual engineering properties of the soils comprising the various modal profiles representing each of the three Land Types traversed by this road are respectively given in Tables 5 to 7. The estimated and actual properties for the three units are discussed below.
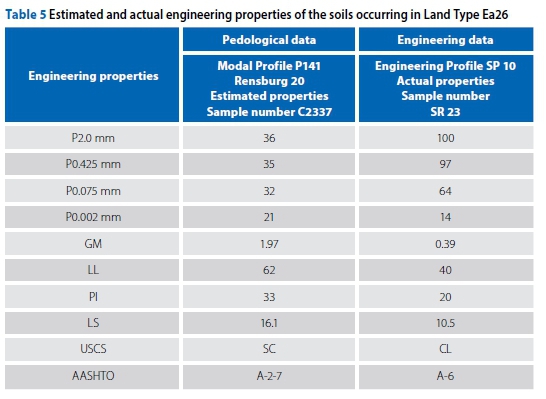
Land Type Ea26 (chainages 1.5 km to 3.4 km and 10 km to 17 km)
Only one modal profile (P141) occurred in this unit. The soil comprising this profile was classified as a Rensburg which consists of a Vertic A horizon underlain by a G horizon which is calcareous in its upper section (MacVicar et al 1977). Although soils of the Rensburg form were not researched in this project, the soils of the Vertic A horizon, which solely comprise the Arcadia form, were researched.
Eleven soil profiles were described between the above chainages during the reconnaissance survey (Van Gruting et al 1975). Only one of seven profiles (profile SP10), from which one or more samples were taken for testing, had physical characteristics resembling those of the Rensburg soil form.
The estimated results of the Vertic A horizon of the modal profile were compared to the actual results of sample number SR23 from soil profile SP10 (Van Gruting et al 1975). The estimated and actual engineering properties of the soils in Land Type Ea26 are given in Table 5.
Referring to Table 5, a paired t-test conducted on the grading and plasticity data of the mean of the estimated values and the actual values indicated that the difference between the two paired sets is not significant (P = 30%). However, despite this statistical outcome, which indicates that the outcome of significance of difference was not established, and not necessarily complete acceptance of the null hypothesis, it is evident that, practically, the estimated and actual grading characteristics of this horizon differ considerably. The difference between the estimated and actual plasticity characteristics appears to be due to the difference in the grading characteristics of these two soils, since the plasticity characteristics were determined from the grading characteristics and exchangeable magnesium of the soil using the appropriate regression equation from Fanourakis (2012). Hence, if the soil comprising the Vertic A horizon of the modal profile had similar grading characteristics to those of the Vertic A horizon in profile SP10, the same plasticity characteristics could probably be expected from both these soils. However, this could not be proved, as using the actual engineering grading with the chemical data (from modal profile P141) yielded values that were outside of the range on which the relationships in Fanourakis (2012) were based. It should be noted that the two soils compared were located approximately 29 km apart and changes in grading characteristics over this distance are obviously not unusual. Nevertheless, the soil type in the modal profile description of P141 indicates this soil to be a dry, black, very hard, blocky clay, which would render it unsuitable for founding of a road or as a road building material. Finally, with reference to Table 4, this soil is characterised as Group 2, which confirms its unsuitability.
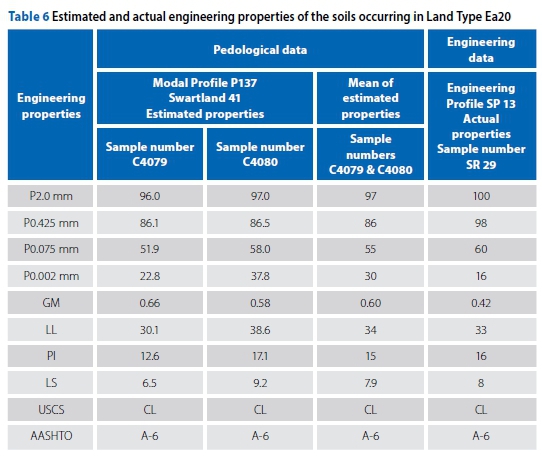
Land Type Ea20 (chaînage 3.4 km to 10 km)
A total of two modal profiles occurred in this unit (P130 and P137), as shown in Table 3. Modal profiles P130 and P137 comprised soils of the Swartland and Valsrivier forms, respectively (LTSS 2021).
Eleven profiles were recorded between the above chainages as part of the engineering reconnaissance survey conducted (Van Gruting et al 1975). These profiles comprised soils of the Swartland, Arcadia, Rensburg, Katspruit, Glenrosa and Mispah forms. This was determined by simply inspecting the physical characteristics of the horizons in each of the profiles. Only one of the profiles from which samples were taken for testing (SP13) had the physical characteristics of the Swartland form. Sample number SR29 was tested from this profile (Van Gruting et al 1975).
The plasticity estimation component of the model could not be applied using the modal profile data from profile P130 for the following reasons:
■ The cation exchange capacities (CECs) of the soils comprising the three horizons in this profile ranged from 1.1 to 2 milli-equivalents per 100 g soil. These were lower than those of the soils researched by Fanourakis (2012), which were 2.2 to 4.4 milli-equivalents per 100 g soil.
■ The exchangeable sodium percentages (ESPs) were in excess of 50% (ranging from 55% to 136%), whereas those of the soils researched, and on which the relationships in Fanourakis (2012) were based, were generally below 5%. The mathematical model was then applied using the pedological data from profile P137. The estimated and actual engineering properties of the soils in Land Type Ea20 are given in Table 6.
Referring to Table 6, a paired t-test conducted on the grading and plasticity data of the mean of the estimated values and the actual values indicated that the difference between the two paired sets was not significant (P = 78%). Hence the null hypothesis was not rejected. Furthermore, the Atterberg Limits in the two sets compared were almost identical and the classification groups are identical.
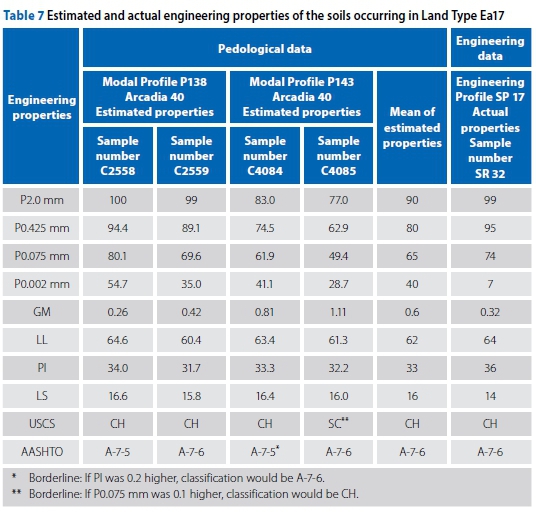
Land Type Ea17 (chaînage 17 km to end)
Two modal soil profiles occurred in this unit, P138 and P143 (LTSS 2021). Each of these profiles comprised two Vertic A horizons and are classified as Arcadia according to the South African Binomial Classification System (MacVicar et al 1977). Five soil profiles were recorded between the above chainages during the reconnaissance surveys (Van Gruting et al 1975). Of these five profiles, profile SP17 comprised soil which had the physical characteristics of a Vertic A horizon. Sample number SR32, taken from this horizon which appeared to have the physical properties of a Vertic A horizon, was tested to determine its engineering properties (Van Gruting et al 1975).
The model was applied to the four sets of pedological data pertaining to the two horizons of each of the two modal profiles to determine their engineering properties.
The estimated and actual engineering properties of the soils in Land Type Ea17 are given in Table 7.
Referring to Table 7, a paired t-test conducted on the grading and plasticity data of the mean of the estimated values and the actual values indicated that the difference between the two paired sets is not significant (P = 95%). This non-rejection of the null hypothesis was despite the difference in clay content (40% and 7%) of the two groups compared. The actual reported clay content value of 7% (in the road report) is questionable, as this indicates an activity of clay in excess of five. Although such high activities of clay are possible (Skempton 1953), the similar soils of the Arcadia form researched comprised activities of clay ranging from 0.47 to 1.95. Finally, in the two sets compared, the Atterberg Limits were almost identical, and the classification groups were identical.
General comparison of the road reconnaissance report to Land Type data
In the reconnaissance report the entire area was mapped as a single land pattern or unit, whereas according to the Land Type map the road is located across three different units. The section of the reconnaissance report dealing with the soils along the proposed road briefly discusses the dominant alluvial soils and colluvial/ residual soils separately.
The alluvial soils have a sandy to clayey silt texture and are present over most of the area mapped. These soils extend to depths between 1.0 m and 4.0 m, and are thought to have been deposited in the past by the Vaal River. Mention is also made that certain zones which may contain expansive or heaving clays were identified during the aerial photographic interpretation (Van Gruting et al 1975).
The surface soils which are colluvial or residual are scattered throughout the area and are only associated with the plateaux and raised dolerite ridges. The colluvial soils, which extend to depths ranging from 0.1 m to in excess of 1.0 m and have a silty to sandy clay texture, are usually underlain by residual dolerite or shale along the side slopes of the ridges (Van Gruting et al 1975).
The discussion on the soils in the reconnaissance report essentially contains the same information as data given in the Land Type inventories of the Land Types traversed by the road.
The engineering soil properties estimated from the quantitative modal soil profile data were all statistically significant and compared favourably to those of the same soil types tested during the reconnaissance survey, in the case of 86% (six of the seven) sets of data. The differences in the grading characteristics of the soils compared may be attributed to the horizontal distances (ranging from 29 km to 5.6 km) between the modal profiles and the profiles to which they were compared.
No modal profiles were recorded in the dolerite areas. This is of great importance when establishing potential borrow areas. In addition, the probability that a modal profile will be located on a route which in future may be used for the construction of a road or in a potential borrow area is slight. In general, when investigating borrow pits, it is the pedocretes (such as pedological "C"-horizons, etc) or weathered rock which are of interest and warrant testing. In the pedological soil classification system none of the soil series are determined on the properties of the pedocretes or weathered rocks, and hence no indication of the physical and/or chemical composition of the pedocretes is given in the soil series. However, the pedological profile may indicate that pedocretes do occur in a particular area.
The geological data supplied in the Land Type inventories are merely transcriptions of the standard geological survey data which appear on the geological maps (Council for Geoscience 1986) and are, therefore, brief. The geological data in the engineering reconnaissance report is given in detail, including a geological cross-section of the route.
CONCLUSIONS
Land Type data, together with the model developed, may be successfully used, ideally by appropriately qualified registered geotechnical professionals, to plan reconnaissance surveys. Soils of the same soil form with physical and chemical properties as the soils included in the research project, but which occurred outside the area in which the research was conducted, displayed statistically significant (P = 30% to P = 95%) estimated engineering properties (when compared to the actual properties). In 86% of the data sets the estimated properties were almost identical to the actual properties.
This case study highlighted the fact that data of engineering relevance determined using the Land Type memoirs and the mathematical model by Fanourakis (2022) may be used to obtain an indication of materials, drainage characteristics, subgrade conditions and potential problem soils occurring in an area or along a route. Such information would be of benefit, including during reconnaissance geotechnical surveys, and in planning and costing detailed investigations.
Since the information contained in the Land Type maps is (because of the small scale used) too general to enable the location of borrow material, it appears that the use of conventional aerial photographic interpretation techniques is a more effective method of locating potential borrow areas.
REFERENCES
Brink, A B A, Partridge, T C & Williams, A A B 1982. Soil Survey for Engineering. New York: Oxford University Press, pp 225-227, 258. [ Links ]
Calitz, F 2021. Proposed system to facilitate use of pedological information in preliminary stage geotechnical investigations. PhD Thesis. Potchefstroom: North-West University. [ Links ]
Council for Geoscience 1986. Geological Series Map 2628 East Rand. Scale 1:250 000. Pretoria: Government Printer. [ Links ]
Fanourakis, G C 1999. Engineering soil properties from pedological data. DTech (Eng) Thesis. University of Johannesburg. [ Links ]
Fanourakis, G C 2012. Estimating soil plasticity properties from pedological data. Journal of the South African Institution of Civil Engineering, 54(2): 117-125. [ Links ]
Fanourakis, G C 2022. A mathematical model for determining engineering soil classifications from pedological data. Journal of the South African Institution of Civil Engineering, 64(1): 2-11. [ Links ]
Jennings, J E, Brink, A B A & Williams, A A B 1973. Revised guide to soil profiling for civil engineering purposes in Southern Africa. Transactions of the South African Institution of Civil Engineers, 15(1): 3-12. [ Links ]
Harmse, H J Von M & Hattingh, J M 1985. The pedological profile classes. In Brink, A B A (Ed.), Engineering Geology of Southern Africa, Vol 4, 272-273. [ Links ]
HRB (Highway Research Board) 1945. The United States Bureau of Public Roads Classification System. Proceedings, 25th Annual Meeting of the HRB. Washington, DC. [ Links ]
ISRIC (International Soil Reference and Information Centre) 2021. World soil information: Application of soil information. Wageningen, Netherlands: ISRIC. www.isric.org/explore/library. [ Links ]
LTSS (Land Type Survey Staff) 2021. Land types of South Africa: Digital Map (1:250 000 scale) and soil inventory databases. Pretoria: Institute for Soil, Climate and Water, Agricultural Research Council. https://www.arc.agric.za/arc-iscw/Pages/ARC-ISCW-Homepage.aspx. [ Links ]
MacVicar, C N, De Villiers, J M, Loxton, R F, Verster, E, Lambrechts, J J N, Merryweather et al 1977. Soil classification: A binomial system for South Africa. Scientific Bulletin No 390. Pretoria: Department of Agriculture Technical Services. [ Links ]
Paige-Green, P & Turner, D 2007. The use of soil and land type information maps in road engineering in South Africa. Proceedings, 14th African Regional Conference on Soil Mechanics and Geotechnical Engineering (ARC SMGE), Yaounde, Cameroon, 26-28 November 2007, pp 311-318. [ Links ]
Patterson, G, Turner, D, Wiese, L, Van Zijl, G, Clarke, C & Van Tol, J 2015. Spatial soil information in South Africa: Situation analysis, limitations and challenges. South African Journal of Science, 111(5/6): 1-7. [ Links ]
Skempton, A W 1953. The colloidal activities of clays. Proceedings, 3rd International Conference on Soil Mechanics and Foundation Engineering, Zurich, Switzerland, pp 57-61. [ Links ]
Tschebotarioff, G P 1951. Soil Mechanics, Foundations and Earth Structures. New York: McGraw-Hill. [ Links ]
USAEWES (United States Army Engineer Waterways Experiment Station) 1960. The Unified Soil Classification System. Technical Memorandum No 3-357. Appendix A, Characteristics of soil groups pertaining to embankments and foundations, 1953; Appendix B, Characteristics of soil groups pertaining to roads and airfields. Vicksburg, MS: USAEWES. [ Links ]
Van Gruting, Comninos & Potter 1975. Reconnaissance report on soil engineering mapping, terrain evaluation and construction materials location for the proposed Standerton - Roberts Drift Road (P53/3). Undertaken by P G Hartopp and Associates (Johannesburg) and B W Kraft (Pretoria). [ Links ]
 Correspondence:
G C Fanourakis
Department of Civil Engineering Technology, University of Johannesburg
PO Box 17011, Doornfontein, 2028, South Africa
T: +27 11 559 6416; E: georgef@uj.ac.za

PROF GEORGE FANOURAKIS (FICE, FSAICE) is Associate Professor in the Department of Civil Engineering Technology at the (now) University of Johannesburg, which he joined around 28 years ago after leaving the employ of Jones and Wagener (Pty) Ltd Consulting Engineers. He holds the degrees of MSc(Eng) and DTech(Eng), and is a Chartered Civil Engineer and Fellow of the Institution of Civil Engineers (UK). He is also a Fellow of the South African Institution of Civil Engineering (SAICE), an Honorary Fellow (and Past-President) of the Institute of Professional Engineering Technologists (IPET) and Member of the Soil Science Society of Southern Africa. His professional participation further includes membership of three South African Bureau of Standards (SABS) committees, membership of COM9:Dissemination of Knowledge of the fib (fédération internationale du béton), and membership of TC306 (Geo-Engineering Education) of the International Society of Soil Mechanics and Geotechnical Engineering (ISSMGE).
Appendix


