


Services on Demand
Article
 English (pdf)
 Article in xml format
 Article references
Indicators

Related links
-
 Cited by Google
 -
 Similars in Google
Share

 Permalink
Journal of the South African Institution of Civil Engineering
On-line version ISSN 2309-8775
Print version ISSN 1021-2019
J. S. Afr. Inst. Civ. Eng. vol.63 n.4 Midrand Dec. 2021
http://dx.doi.org/10.17159/2309-8775/2021/v63n4a1
TECHNICAL PAPER
Flow resistance in channels with large emergent roughness elements
C S James
ABSTRACT
Reducing uncertainty in flow resistance estimation in natural channels requires elucidation of contributing influences. Surface shear and form drag are the major contributors in channels containing large roughness elements under emergent flow conditions. The two effects can be accounted for in the Darcy-Weisbach and Manning equations by adding their associated, separate friction factors or taking the square root of the sum of the squares of the corresponding Manning coefficients. The friction factor for form drag can be estimated from the drag coefficient and areal density of the roughness elements and the flow depth. Predictions of the combined effect are tested against results of laboratory experiments with different arrangements of emergent cylinders on smooth and rough beds, using experimentally determined drag coefficients for the cylinders. The variation of the overall resistance coefficient with flow condition depends on the dominant influence, decreasing with flow depth when surface shear dominates, and increasing with depth when form drag dominates.
Keywords: flow resistance, drag, large-scale roughness, low-flow hydraulics, river flow
INTRODUCTION
The flow resistance of a river is an expression of the effects that its physical features have on flow depth and velocity characteristics. Various sources of resistance related to different physical features have been recognised (e.g. Rouse 1965; Yen 2002), the most influential being surface shear associated with grain roughness and form drag arising from flow separation around large roughness elements or irregularities. The resistance effects of the underlying sources can be described at different levels of resolution, depending on the purpose of the application, the information available, and the way in which finer resolution processes are modelled (James & Jordanova 2010). At any particular level, the effects of lower-level processes that are not described explicitly are accounted for through a resistance coefficient.
Many engineering and environmental river problems are appropriately addressed at the river reach level, using 1D or 2D models that require descriptions of resistance to relate cross-section or cell average velocities to flow depths. Commonly used resistance equations are those of Darcy-Weisbach (Equation 8), Chézy, and Manning (Equation 13). The Manning equation is the most widely used, with its resistance coefficient (n) providing a lumped parameter to account for all contributing influences, including both shear and form types. For natural rivers with multiple contributions to overall resistance, the estimation of n is usually based on direct site-specific calibration, experience of similar situations, or synthesis from finer resolution descriptions of the different contributing effects.
Estimation of n by experience is aided by previous calibrations with physical channel characteristics, as documented in tables (e.g. Chow 1959), or presented with photographs for matching (e.g. Hicks & Mason 1991). Although common practice, the use of tabulated values and photographs is unreliable because the value of n can vary significantly with flow magnitude, and it is difficult to select a representative value within the range reported, or to predict the direction and rate of trend with flow depth or discharge. The comprehensive information provided by Hicks and Mason (1991) illustrates this uncertainty more convincingly than it provides confidence in selecting representative values. For more than a third of the documented reaches, the n values vary with flow depth by more than a factor of 2, approaching an order of magnitude in some cases. While n commonly decreases with flow depth, it increases distinctly in some cases and even reverses in trend for some. Association of the range and the direction and rate of trend with the physical characteristics of the river is not obvious, making estimation of a representative value for unmeasured sites very uncertain. Such uncertainty prompted Ferguson (2010) to question the usefulness of the Manning equation, but it does provide a convenient way for lumping the effects of multiple resistance contributions, whether calibrated directly or synthesised from explicit expressions of underlying effects. Reducing the uncertainty in the overall n value requires explanation of its variability, which is unlikely to be gained by observation at the level of resolution of its application; some elucidation of the processes at a higher level of resolution is necessary.
Various synthesis approaches for estimating n have been proposed. These include (a) the use of composite roughness equations for combining different local resistance coefficients across a channel section (such as the equations of Horton (1933) and Pavlovski (1931)), (b) the SCS method initially proposed by Cowan (1956) for augmenting a basic surface n value to account for effects of surface irregularity, channel shape variations, obstructions, vegetation and meandering, and (c) application of a lateral distribution model such as included in the Conveyance Estimation System (CES) software described by Knight et al (2010). The composite roughness equations and lateral distribution model really apply only to transverse variations of surface shear and flow depth across a section, although certain formulations have been shown to apply equally well to areal variations (James & Jordanova 2010). The SCS method applies over a channel reach and does allow for consideration of form drag effects, but is flawed in its linear addition of contributions and in considering multiple effects to be independent (James & Jordanova 2010).
Synthesis by explicit combination of surface shear and form resistance effects has been used in various applications. For alluvial resistance estimation, Einstein and Barbarossa (1952) and many others since have considered total resistance to be the sum of surface grain and bedform contributions. The concept has also been applied to other types of large-scale roughness in natural streams (e.g. David et al 2011; Shields & Gippel 1995) and especially for emergent vegetation (e.g. James et al 2004; James et al 2008; Petryk & Bosmajian 1975; Stone & Shen 2002). Applications to emergent vegetation have generally been with stem densities so high that the overall resistance is almost exclusively form drag, although Schoneboom et al (2010) have demonstrated the contribution of bed shear, and James et al (2004) quantified the error in the resistance coefficient associated with neglect of the bed shear contribution.
In this work, synthesis of a combination resistance coefficient (in terms of either the Darcy-Weisbach f or the Manning n) is considered for a simple case of distinct contributions from bed shear and form drag, such as would occur in a stream comprising a gravel or cobble bed and dispersed boulders. The results have immediate relevance for low-flow hydraulic analysis in environmental flow determinations and in river rehabilitation design involving the placement of boulders to create suitable habitat conditions. The resistance of emergent boulders in a stream is similar in nature to that of emergent vegetation stems, just at a larger scale, and the formulation presented in the following section is essentially similar to that presented by the authors cited above. A similar approach has been followed by Guillén-Ludeña et al (2020) to account for the effect of buildings on floodplains. It is shown further that the variation of drag coefficient with element Reynolds number for large elements is significantly different from that for slender stems, and that the relative contributions of shear and form resistance have a marked influence on the trend of the overall resistance coefficient with flow depth.
FORMULATION
The combination of surface shear and form resistance for a stream with large emergent roughness elements follows formulations for emergent vegetation stems, as presented by Petryk & Bosmajian (1975) and subsequent researchers. The development is presented here to include minor modifications and clarify concepts. The relationship is derived by considering the downslope weight component of a volume of water in uniform flow to be balanced by the sum of the forces arising from bed shear and form drag, i.e.

where F is the downslope weight component of the water, F/is the bed shear force and F//is the form drag. The weight component is
in which p is the water density, g is gravitational acceleration, S is the channel slope and Vol is the volume of water.
The bed shear force is given by
in which Abfis the surface area on which the shear stress acts. (Note that Abfis less than the area of the bed not occupied by form roughness elements Ab, because the shear stress is not effective within the separation zones downstream of each element.) The shear stress Tocan be expressed in terms of the surface friction factor f /as

in which V is the average velocity.
The form drag can be quantified through the drag equation

in which CDis the drag coefficient and Ap is the projected area of the form roughness elements in the flow direction.
Inserting the force expressions in the force balance equation and rearranging terms gives an equation for the velocity in terms off, CD and the channel characteristics, i.e.

Further manipulation of Equation 6 leads to
which can be expressed as
i.e. the conventional form of the Darcy-Weisbach equation, with

where f is the total friction factor and f//is the effective friction factor associated with form resistance, given by

and R is a volumetric hydraulic radius given by

Expressing the bed shear in terms of the Manning resistance coefficient for the surface (n /) rather than the friction factor, i.e.

similarly leads to the conventional Manning equation
with

where n// is the resistance coefficient accounting for the form resistance component, given by

The combined resistance of bed shear and form roughness presented by Equations 8 to 11 or 13 to 15 accounts for the two contributions at a mutually consistent level of resolution: bed shear is represented by a friction factor which may be related to the Nikuradse roughness (ks) of the bed material, and form drag is represented by a similar coefficient related to CD, which depends on the form element size, shape and spacing.
EXPERIMENTAL PROCEDURE
Experiments to test Equations 8 to 11 were carried out in a 12.0 m long, 2.0 m wide tilting flume. The form roughness elements were 0.110 m diameter circular cylinders placed in staggered arrangements with equal longitudinal and transverse spacing. Two sets of experiments were conducted, one with the full width of the flume (Nkosi 2007) and the other with the width reduced to 1.0 m, to enable a wider range of flow conditions and element densities to be tested. For each set, experiments were carried out with different cylinder density arrangements on both the original smooth vinyl flume bed and on a rough bed made with a single layer of crushed gravel with a nominal diameter of 19 mm. Stage-discharge measurements were taken for each of the test conditions listed in Table 1, which also indicates the areal density of bed coverage by the elements associated with each N value. The tests with no cylinders in place (N = 0) were carried out to establish bed friction factor relationships for the two bed types. Figure 1 shows the flume setup for Test B5.


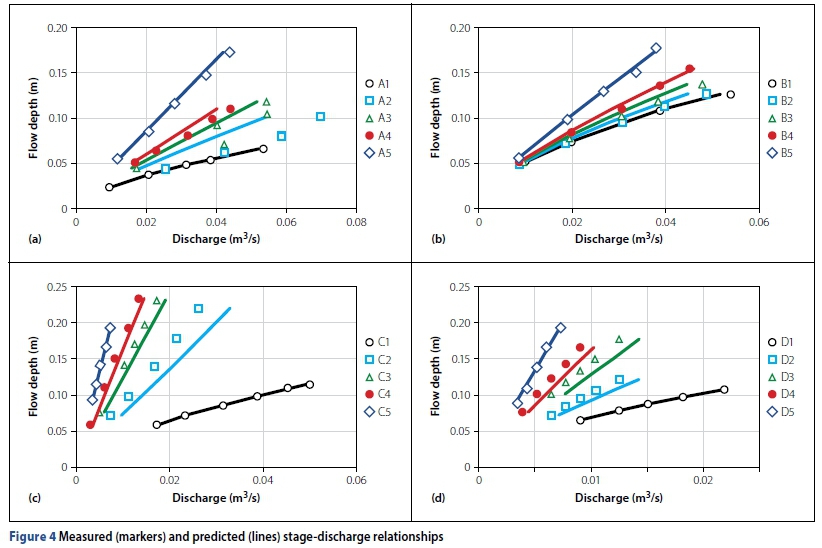
Each setup was tested with five discharges (over the ranges indicated in Figure 4) with the cylinders emerging through the water surface in all cases. The discharge was measured by a turbine meter in the supply line and controlled by a valve in the supply line near the flume entrance. Uniform flow was ensured by adjusting a horizontal weir at the downstream end of the flume. The height of the water surface was measured at 1.10 m intervals along the centre line of the flume using piezometers, and the weir level was adjusted until the water surface slope matched the bed slope. The average of the flow depths at all the measurement locations was used as the uniform flow depth.


Calculation of the form friction factor by Equation 10 requires knowledge of CD. Values of CDfor emergent cylinders have previously been determined (e.g. Kothyari et al 2009; Tanino & Nepf 2008), but only for slender vegetation stems and lower values of element Reynolds number (Re¿) than obtained in this investigation (Red= Vd/v, with v being the kinematic viscosity of water and d the cylinder diameter). As the drag force on cylinders is known to depend strongly on size (Turcotte et al 2015), a series of tests were carried out to obtain estimates of CDfor the cylinders used in these experiments under emergent conditions. Drag forces were measured using the apparatus shown schematically in Figure 2, comprising two lever arms connected at right angles with a pivot at their vertex. A cylinder was attached to the vertical arm, with its base just clear of the flume bed, and a pointer on the horizontal arm was placed in contact with the pan of an electronic balance. Drag on the cylinder produced a measurable force on the balance which could be related to the drag force by moment equilibrium. Measurements were taken with a wide range of discharges and weir settings for single cylinders in isolation and in groups.
RESULTS
Drag coefficients
Values of CDwere calculated from the measured forces by Equation 5, with V taken as the cross-section average velocity calculated from the measured discharge and flow depth. In the moment equilibrium calculations, it was assumed that the drag force was applied at mid-depth (repeating the calculations with the force assumed to be exerted at the bottom of the cylinder and at the water surface showed a maximum difference in calculated CDwithin about ±7%). The value of CDwas found to vary strongly with Red over the lower range tested (Figure 3). The relationships derived for single, isolated cylinders are
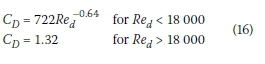
with R2 = 0.90 for the lower Red equation. These results are consistent with those obtained independently for similar cylinders by Mahdi and Bismilla (2014), and Jackson (2016). Also shown in Figure 3 is the "standard" curve for infinitely long cylinders, as presented in many textbooks (e.g. Albertson et al (1960), as well as the upper and lower limits of the data obtained by Tanino and Nepf (2008), and Kothyari et al (2009) for ranges of slender cylinder densities. No clear effect of cylinder density was apparent in the results for the large cylinders, and Equations 16 were used for the following resistance predictions.
Surface friction factors
Tests A1, B1, C1 and D1 were carried out to enable formulation of surface friction factor relationships for the two flume widths and two surface types.
For the smooth beds (Tests A1 and C1) the flow conditions were around the threshold between hydraulically smooth and transitional turbulent flow. The shear Reynolds number (Re* = u*ks/v, with the shear velocity u* = (gRS)0.5) was between 3.7 and 5.2 for Tests A1 and between 7.3 and 8.1 for Tests C1. Friction factor relationships were therefore obtained by calibrating the laws presented by the ASCE Task Force on Friction Factors in Open Channels (ASCE 1963) for both conditions, i.e.

for hydraulically smooth flow, and
for transitional flow. In these equations Re = 4VR/v and the Task Force recommend default coefficient values of a = 12, b = 2.51 and c = 2.0. Using Equation 17 the value of c was fixed at 2.0 and b was recalibrated to give values of b = 6.17 for the 2.0 m wide flume and b = 9.55 for the 1.0 m wide flume. Using Equation 18 the default values for a, b and c were retained, and values of ksfound as 0.22 mm for the 2.0 m wide flume and 0.46 mm for the 1.0 m wide flume.
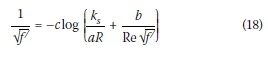
The flow conditions for the rough bed (Tests B1 and D1) were well within the hydraulically rough range and the resistance was characterised by a ksvalue in the hydraulically rough flow equation presented by the ASCE Task Force on Friction Factors in Open Channels (ASCE 1963), i.e.

with a = 12 and c = 2.0. The friction factor for the rough bed fb was calculated by the sidewall correction procedure proposed by Vanoni and Brooks (1957) and ksthen calculated from Equation 19. The value of ksdepends on the height within the bed from where the flow depth is measured. Estimates of the distance below the tops of bed grains to the theoretical bed, defining the origin of the vertical velocity profile, range from 0.15 to 0.35 times the bed particle size (as reviewed by James (1990)).
The best fit factor value for the 1.0 m wide flume was found to be 0.16, and for consistency this was used for the 2.0 m flume as well. The resulting values of kswere found to be 0.040 m for the 1.0 m flume and 0.049 m for the 2.0 m flume.
Friction factors may also be expressed as equivalent Manning coefficients according to
Stage-discharge predictions
Equations 8 to 11 were tested by predicting the stage-discharge relationships for the experimental conditions. For a channel with rectangular cross-section and circular-cylindrical emergent form roughness elements in which Ab is the area of the bed not occupied by form roughness elements, D is the flow depth, N is the number of elements per unit area, d is the element diameter, W is the channel width and a is a factor applied to the element plan area to incorporate the areas of separation over which bed shear is ineffective. Thompson and Roberson (1976) suggest values of a in the range 2.0 to 3.0. Note that if a is assumed to be 1.0 (for a negligible separation zone) and the channel is wide (2D << W), then Abf ~ Aband R ~ D.

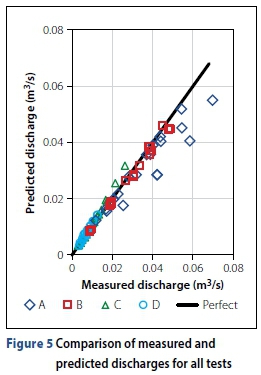
Values of Cdwere calculated by Equations 16, and the surface friction factors by Equations 17 to 19 with the calibrated coefficients (for the smooth channels the results using Equations 17 and 18 were indistinguishable). For the rough channels f /was determined by calculating fbfrom Equation 19 and then applying an inverse Vanoni and Brooks (1957) sidewall correction procedure to obtain a composite f /including the rough bed and smooth side walls. Discharge was calculated by multiplying the velocity by the cross-sectional area adjusted to account for the volume occupied by the cylinders. Predictions were found to be insensitive to the value of a, and a value of 2.5 (in the middle of the range suggested by Thompson and Roberson (1976)) was used throughout. The measured and predicted results are presented in Figure 4. The average absolute prediction errors for each experimental series were 9.9% for Series A, 3.9% for Series B, 10.2% for Series C and 9.5% for Series D. Predicted and measured discharges for all tests with cylinders in place are compared in Figure 5. This shows generally good agreement, except for the smooth channel cases with the lowest element densities.
DISCUSSION
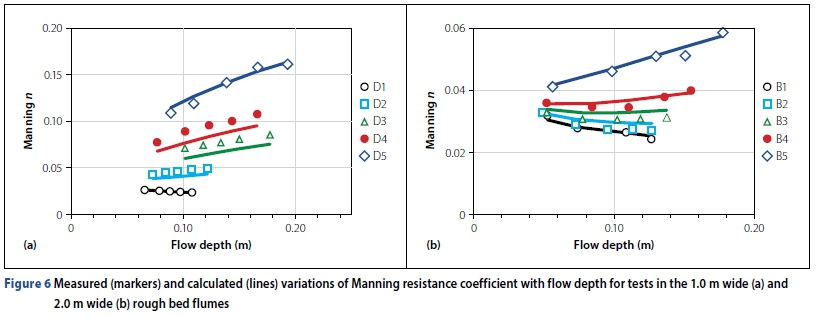
The relative contributions of surface shear and form drag to overall resistance depend on the areal density of elements, the flow depth and the roughness of the surface between the elements. Under conditions where bed shear dominates, i.e. where f// (or n//) is small in comparison with f /(or n/), the average velocity increases with flow depth and the resistance coefficient (either f or n) decreases. Where form drag dominates, the velocity is approximately constant with flow depth (expanding Equation 7 with f/= 0 shows V to be independent of D), and the effective resistance coefficient therefore increases with flow depth to compensate R in the resistance equation. As shown in Figure 6, the presence of form resistance in a channel considerably increases the rate of rise of flow depth with discharge.
Variations of the overall resistance coefficient with flow depth are shown in Figures 6(a) and 6(b) for the 1.0 m and 2.0 m wide flumes with rough beds. (Manning's n, as the more common representation for overall resistance, is plotted here; the relationship is similar in terms off.) Shown with the data are curves of n as predicted using Equation 14 with n //from Equation 15 and n /from Equations 19 and 20, and the inverted Vanoni and Brooks (1957) sidewall correction procedure. The average absolute deviation predicted from experimental n values was 0.0064 for test series D and 0.0013 for test series B. The form resistance component was dominant in the 1.0 m wide rough-bed flume and the resistance coefficient consequently increased with depth (Figure 6(a)). (Form resistance also dominated in all the smooth bed experiments, resulting in similar trends.) For the 2.0 m wide rough-bed flume, the overall resistance coefficient represents a varying balance of the bed shear and form drag contributions (Figure 6(b)). For the relatively sparse element arrangements in the 2.0 m wide flume with the rough bed (Tests B2 and B3) the bed surface contribution is considerable, and the overall resistance coefficient reduces with flow depth. As the element density increases the form roughness contribution increases, eventually producing a consistent increase of resistance coefficient with depth (Test B5). For an intermediate density (Test B4) the resistance coefficient shows a distinct dip in the mid-range of depths, with bed shear dominating at low depths and form drag dominating at high depths. Figure 7 shows the variations of the predicted n/and n//values with flow depth for Test B4, and their combination compared with the measured values. Similar variations and trends of resistance coefficient may be expected in other situations in natural channels where form roughness is significant, such as associated with woody debris, bank irregularities or large bank vegetation, as well as buildings on floodplains.

These results show that uncertainty in estimating resistance coefficients, and especially their variation with discharge, can be reduced by considering surface shear and form resistance characteristics separately, rather than estimating overall resistance directly. Practical estimation of an overall resistance coefficient therefore requires both contributions to be evaluated.
The friction factor of the bed surface between form roughness elements (f/) can be related to its grain size characteristics in terms of a ksvalue. The various approaches available are well reviewed by Ferguson (2007), and include the forms of Equations 17 to 19. For these, various relationships have been proposed for ksin terms of per-centile bed particle sizes (e.g. Millar 1999), and a value of 3.5¿84 has become widely accepted (James 2010) (¿84 is the size of bed particle for which 84% of particles are smaller).
For description at a consistent level of resolution, the friction factor of the form roughness elements f//should be estimated through Equation 10. For field calibration it would be easier to evaluatef//(= 4CDAp/Abf) directly rather than attempting to quantify CD Apand Abfseparately. For preliminary estimates without calibration, it is noted that the term Ap/Abfis linearly related to the relative flow depth D/d, with the coefficient depending on the areal density of the emergent elements. Assuming a value for a = 2.5 and a circular cylindrical shape for the elements, this term can be approximated for densities less than about 20% by in which C is the per cent areal density.

The value of Cd varies with Red (Figure 3) and does so differently for circular cylinders with different diameters. This variation has yet to be described reliably for all sizes, but its approach to a constant value for Red greater than about 18 000 can be reasonably accepted. This limit represents rather low flow velocities, for example about 0.18 m/s for a cylinder diameter of 0.10 m and 0.018 m/s for a diameter of 1.0 m. Cdalso depends on the element shape. Jackson (2016) measured Cdfor 0.11 m diameter circular and 0.10 m width square cylinders placed square and diagonally to the flow
direction. For Red > ~10 000 he measured Cdvalues of about 1.3, 2.0 and 3.0 for the circular, square and diagonal cylinders respectively, which gives an indication of the influence of element angularity. For Red < ~10 000 he found similar variation with Red as shown by the data in Figure 3. Guillén-Ludeña et al (2020) measured Cdvalues for 54 mm square cylinders for Red in the range 3 500 - 24 000 and areal densities between 0.2% and 20%. They propose a single average value of 1.32 as representative for all these conditions. CDhas also been found to vary with element density, especially with slender elements at low Red (e.g. Kothyari et al 2009; Tanino & Nepf 2008). The effect was insignificant for the present experimental conditions, but requires further investigation for large elements and high Red.
For areal densities below about 20% a reasonable estimate off//can therefore be obtained from Equation 10 with Ap/Abfgiven by Equation 25 and, for Red > ~18 000, a value of CDvarying from about 1.3 for smooth rocks up to about 3 for very angular rocks. For Red < ~18 000 the value should be increased according to the variation indicated by Equation 16.
Both f /and f//can be converted to Manning n values using the equivalence relationship, Equation 20.
CONCLUSIONS
The variation of resistance coefficient with flow magnitude in channels with rough
beds and large form roughness elements can be explained by elucidating their respective contributions. The overall resistance coefficient can be obtained by combining independently determined bed shear and form resistance contributions. The overall Darcy-Weisbach friction factor f is the sum of the component friction factors (Equation 9); the overall Manning resistance coefficient n is the square root of the sum of the squares of the component values (Equation 14).
The friction factor f /or resistance coefficient n/for bed shear depends on the roughness size ksof the bed material. The friction factor f //or resistance coefficient n//for form roughness depends on the element drag coefficient CD, the areal density of the elements and the flow depth, according to Equations 10 and 15 respectively.
The variation of CDwith Red for large emergent objects is significantly different from that for slender cylinders (as representing vegetation stems, for example). Under very low-flow conditions the drag coefficient can be expected to vary considerably with Red. For the areal densities of emergent elements investigated (less than about 15%) Cdwas found to be unaffected by the density; the effect for greater densities requires further investigation.
The variation of overall resistance coefficient with flow depth depends on the relative dominance of the two contributions. If bed shear dominates (e.g. with a very rough bed and/or sparse form element distribution) f and n decrease with flow depth; if form drag dominates (e.g. with high form element density and/or relatively smooth bed) f and n increase with flow depth. For intermediate form element densities, the trend of resistance coefficient can reverse as flow depth increases.
ACKNOWLEDGEMENTS
The stage-discharge relationships in the 1.0 m wide flume were measured by Darlington Ikegwuoha. The work is based on research funded by the National Research Foundation, South Africa.
NOTATION
Ab= Bed area unoccupied by elements
Abf= Bed area subjected to surface shear
Ap= Projected area of elements a = Constant in friction factor relationship
b = Constant in friction factor relationship
C = Per cent areal density of emergent elements
CD= Drag coefficient
c = Constant in friction factor relationship
D = Flow depth
d = Cylinder diameter
F = Downslope weight component of water
F/= Surface shear resisting force
F//= Form drag
f = Friction factor
f /= Friction factor associated with bed shear
f//= Friction factor associated with form drag
fb = Friction factor for bed g = Gravitational acceleration
ks= Nikuradse grain roughness
n = Manning resistance coefficient
n/= Manning resistance coefficient associated with bed shear
n//= Manning resistance coefficient associated with form drag
N = Number of elements per unit area of bed
R = Hydraulic radius
Re = Flow Reynolds number
Red = Element Reynolds number
Re* = Shear Reynolds number
S = Channel slope
u*= Shear velocity
V = Average velocity
Vol = Volume of water above bed
W = Channel width
a = Factor to account for area of separation zone
V = Kinematic viscosity of water
p = Water density
To = Boundary shear stress
REFERENCES
Albertson, M L, Barton, J R & Simons, D B 1960. Fluid Mechanics for Engineers. Englewood Cliffs, NJ: Prentice Hall. [ Links ]
ASCE (American Society of Civil Engineers) 1963. Friction factors in open channels: Progress Report of the Task Force on Friction Factors in Open Channels. Journal of the Hydraulics Division, ASCE, 89(2): 97-143. [ Links ]
Chow, V T 1959. Open Channel Hydraulics. New York: McGraw-Hill. [ Links ]
Cowan, W L 1956. Estimating hydraulic roughness coefficients. Agricultural Engineering, 37(7): 473-475. [ Links ]
David, G C L, Wohl, E, Yochum, S E & Bledsoe, B P 2011. Comparative analysis of bed resistance partitioning in high-gradient streams. Water Resources Research, 47: W07507. [ Links ]
Einstein, H A & Barbarossa, N L 1952. River channel roughness. Transactions, ASCE, 117: 1121-1143. [ Links ]
Ferguson, R 2007. Flow resistance equations for graveland boulder-bed streams. Water Resources Research, 43: W05427. [ Links ]
Ferguson, R 2010. Time to abandon the Manning equation? Earth Surface Processes and Landforms, 35: 1873-1876. [ Links ]
Guillén-Ludeña, S, Lopez, D, Mignot, E & Riviere, N 2020. Flow resistance for a varying density of obstacles on smooth and rough beds. Journal of Hydraulic Engineering, 146(2): 04019059. [ Links ]
Hicks, D M & Mason, P D 1991. Roughness characteristics of New Zealand rivers. Wellington, New Zealand: Water Resources Survey. [ Links ]
Horton, R E 1933. Separate roughness coefficients for channel bottom and sides. Engineering News Record, 3(22): 652-653. [ Links ]
Jackson, K S 2016. The determination of form drag coefficient for rigid, emergent objects in open channel flow. MSc (Eng) Project Report. Johannesburg: School of Civil & Environmental Engineering, University of the Witwatersrand. [ Links ]
James, C S 1990. Prediction of entrainment conditions for nonuniform, noncohesive sediments. Journal of Hydraulic Research, 28(1): 25-41. [ Links ]
James, C S 2010. Flow resistance in rivers, Chapter 7. In James, C S & King, J M (Eds). Ecohydraulics for South African Rivers - A Review and Guide. WRC Report No. TT 453/10. Pretoria: Water Research Commission. [ Links ]
James, C S, Birkhead, A L, Jordanova, A A & O'Sullivan, J 2004. Flow resistance of emergent vegetation. Journal of Hydraulic Research, 42(4): 390-398. [ Links ]
James, C S, Goldbeck, U K, Patini, A & Jordanova, A A 2008. Influence of foliage on flow resistance of emergent vegetation. Journal of Hydraulic Research, 46(4): 536-542. [ Links ]
James, C S & Jordanova, A A 2010. Reach-scale resistance of distributed roughness in channels. In Dittrich, A, Koll, K, Aberle, J & Geisenhainer, P (Eds), Proceedings, International Conference on Fluvial Hydraulics (River Flow 2010), 8-10 September 2010, Braunschweig, Germany, Vol 1, pp 333-341. [ Links ]
Knight, D W, McGahey, C, Lamb, R & Samuels, P G 2010. Practical Channel Hydraulics: Roughness, Conveyance and Afflux. London: CRC Press/ Taylor & Francis. [ Links ]
Kothyari, U C, Hayashi, K & Hashimoto, H 2009. Drag coefficients of unsubmerged rigid vegetation stems in open channel flows. Journal of Hydraulic Research, 47(6): 691-699. [ Links ]
Madhi, Y & Bismilla, B A 2014. Drag force on emergent broad circular cylinders. Final Year Investigational Project Report. Johannesburg: School of Civil & Environmental Engineering, University of the Witwatersrand. [ Links ]
Millar, R G 1999. Grain and form roughness in gravel-bed rivers. Journal of Hydraulic Research, 37(3): 303-312. [ Links ]
Nkosi, M M 2007. Flow resistance effect of large-scale roughness elements. Final Year Investigational Project Report. Johannesburg: School of Civil & Environmental Engineering, University of the Witwatersrand. [ Links ]
Pavlovski, N N 1931. On a design formula for uniform flow movement in channels with non-homogeneous walls (in Russian). Transactions of All-Union Scientific Research of Hydraulic Engineering, Leningrad, 3: 157-164. [ Links ]
Petryk, S & Bosmajian, G 1975. Analysis of flow through vegetation. Journal of the Hydraulics Division, ASCE, 101(HY7): 871-884. [ Links ]
Rouse, H 1965. Critical analysis of open-channel resistance. Journal of the Hydraulics Division, ASCE, 91(HY4): 1-25. [ Links ]
Schoneboom, T, Aberle, J & Dittrich, A 2010. Hydraulic resistance of vegetated flows: Contribution of bed shear stress and vegetative drag to total hydraulic resistance. In Dittrich, A, Koll, K, Aberle, J & Geisenhainer, P (Eds), Proceedings, International Conference on Fluvial Hydraulics (River Flow 2010), 8-10 September 2010, Braunschweig, Germany, Vol 1, pp 269-276. [ Links ]
Shields, F D & Gippel, C J 1995. Prediction of effects of woody debris removal on flow resistance. Journal of Hydraulic Engineering, 121(4): 341-354. [ Links ]
Stone, B M & Shen, H T 2002. Hydraulic resistance of flow in channels with cylindrical roughness. Journal of Hydraulic Engineering, 128(5): 500-506. [ Links ]
Tanino, Y & Nepf, H M 2008. Laboratory investigation of mean drag in a random array of rigid, emergent cylinders. Journal of Hydraulic Engineering, 134(1): 34-41. [ Links ]
Thompson, G T & Roberson, J A 1976. A theory of flow resistance for vegetated channels. Transactions of the American Society of Agricultural Engineers, 19(2): 288-293. [ Links ]
Turcotte, B, Millar, R G & Hassan, M A 2015. Drag forces on large cylinders. River Research and Applications, 32(3): 411-417. [ Links ]
Vanoni, V A & Brooks, N H 1957. Laboratory studies of the roughness and suspended load of alluvial streams. Sedimentation Laboratory Report No. E68, Pasadena, CA: California Institute of Technology. [ Links ]
Yen, B C 2002. Open channel flow resistance. Journal of Hydraulic Engineering, 128(1): 20-39. [ Links ]
 Correspondence:
C S James
School of Civil and Environmental Engineering, University of the Witwatersrand
Private Bag 3, Wits 2050, South Africa
T: +27 28 341 0060; E: chris.james@wits.ac.za
Alternative postal address:
PO Box 1140
Stanford 7210 South Africa

PROF CHRIS JAMES is Professor Emeritus in the School of Civil and Environmental Engineering at the University of the Witwatersrand (Wits), Johannesburg. Before retiring, he lectured in hydrology and hydraulics, and carried out research in river hydraulics, sedimentation, hydraulic structures and environmental flows. At Wits he was also a co-director of the interdisciplinary Centre for Water in the Environment.

