


Serviços Personalizados
Artigo
 Inglês (pdf)
 Artigo em XML
 Referências do artigo
Indicadores

Links relacionados
-
 Citado por Google
 -
 Similares em Google
Compartilhar

 Permalink
Journal of the South African Institution of Civil Engineering
versão On-line ISSN 2309-8775
versão impressa ISSN 1021-2019
J. S. Afr. Inst. Civ. Eng. vol.63 no.3 Midrand Set. 2021
http://dx.doi.org/10.17159/2309-8775/2021/v63n3a4
TECHNICAL PAPER
Applicability of CHIRPS-based satellite rainfall estimates for South Africa
J A du Plessis; J K Kibii
ABSTRACT
Long-term rainfall data with good spatial and temporal distribution is essential for all climate-related analyses. The availability of observed rainfall data has become increasingly problematic over the years due to a limited and deteriorating rainfall station network, occasioned by limited reporting and/or quality control of rainfall and, in some cases, closure of these stations. Remotely sensed satellite-based rainfall data sets offer an alternative source of information. In this study, daily and monthly rainfall data derived from Climate Hazards Group InfraRed Precipitation (CHIRPS) is compared with observed rainfall data from 46 stations evenly distributed across South Africa. Various metrics, based on a pairwise comparison between the observed and CHIRPS data, were applied to evaluate CHIRPS performance in the estimation of daily and monthly rainfall. The results show that CHIRPS data correlate well with observed monthly rainfall data for all stations used, having an average coefficient of determination of 0.6 and bias of 0.95. This study concludes that monthly CHIRPS data corresponds well, with good precision and relatively little bias when compared to observed monthly rainfall data, and can therefore be considered for use in conjunction with observed rainfall data where no or limited data is available in South Africa for hydrological analysis.
Keywords: CHIRPS, satellite data, rainfall estimates, remote sensed rainfall, monthly rainfall
INTRODUCTION
South Africa is largely a semi-arid country with a mean annual rainfall of about 450 mm/year (Botai et al 2018). Due to the variable topography, the climate varies from desert and semi-desert in the dry northwestern region, to sub-humid and wet along the eastern and coastal areas (Dinar et al 2008). The country is water-stressed, with high temporal and spatial variability. The high variability of rainfall across South Africa makes it vulnerable to extremes in climate which impact on agriculture, water resources, and the economy at large (Phakula et al 2018).
Analysis of rainfall variability and trends require long-term rainfall data that is adequately distributed and consistent with time. Gauged rainfall stations have in the past been the primary source of rainfall data. However, there is inadequate spatial coverage of the current rain gauge networks. Pitman (2011) provided a worrying picture of the declining number of rainfall monitoring stations in South Africa coupled with poor documentation of hydrological events. Comparing monitoring stations in South Africa between 1970 and 2004, a decline in the number of functional rainfall stations of almost 50% was reported. The number of stations in 2004 was equivalent to the same number of stations that were available in 1920 (Pitman 2011). The World Meteorological Organisation (WMO) recommends that at least one rainfall recording station per 100-250 km2 is required for meaningful information (WMO 2008). Studies by Makapela et al (2015) further highlight that the South African Weather Service (SAWS) and the Agricultural Research Council (ARC), respectively, had about 1 650 and 500 rainfall stations at varying timescales since 1836 and 1940. Furthermore, SAWS has approximately 12 ground radar stations. Measured against WMO criteria, South Africa is short of about 2 700 rainfall stations. The available data is also observed to have some recorded errors, missing data, and in some cases stations were closed for a considerable period. There has thus been an increasing need for satellite-based rainfall data to complement the declining gauged and radar rainfall data in South Africa. Satellite-based rainfall estimates are advantageous as they provide information with a high spatial and temporal resolution over large regions where gauged rainfall data is limited or not available. However, satellite-based rainfall estimates have limitations, with uncertainty over their accuracy of measurement (Funk et al 2015). This is mainly due to satellite sensors that detect proxy variables and use relationships with gauged rainfall to compute rainfall estimates (Toté et al 2015).
Currently, there are a number of satellite products which provide more than 30 years of rainfall time series data. These are the Climate Prediction Centre (CPC), combined with Merged Analysis of Precipitation (CMAP) (Xie & Arkin 1997), the Global Precipitation Climatology Project (GPCP) (Adler et al 2003), African Rainfall Climatology version 2 (ARC2) (Novella & Thiaw 2013), and the Tropical Applications of Meteorology using Satellite and ground-based observation (TAMSAT) rainfall estimates (Dinku et al 2014). The GPCP and CMAP have long time series going back to 1979, but with coarse spatial (2.5° latitude/longitude) and monthly temporal resolutions. These products also combine data from different sources with unique weightings for each year, depending on the availability of data; hence trend and variability analysis based on these products are likely to be misleading (Dinku et al 2014). ARC2 and TAMSAT products have a high spatial resolution, 0.1° and 0.0375° respectively, and are available at daily intervals. These two sources, however, have a limitation of possible inconsistencies arising from the Global Telecommunications System (GTS) which is attributed to the unavailability of daily GTS gauge reports in real-time. The data is also only available in Africa.
Climate Hazards Group InfraRed Precipitation (CHIRPS) is a relatively new product with good spatial (0.05° latitude/ longitude) and temporal (daily, 5-days, and decadal) resolutions with almost worldwide coverage. CHIRPS provides rainfall data estimates dating from 1981, which incorporate satellite information in the data producing algorithm, but has been observed to lack homogeneity in areas where station data is inconsistent over time (Funk et al 2015).
Due to the uncertainties in accuracy posed by satellite rainfall projections, assessment and validation studies have been carried out by several researchers for different climatic and geographic locations. These include, amongst others, Hirpa et al (2010), Paredes-Trejo et al (2017) and Dinku et al (2018). Most of these studies have focused on the challenges of extracting satellite rainfall data over complex topographies. The general observation of the different studies has been that the accuracy of satellite rainfall estimates vary greatly with climate, topography and seasonal rainfall patterns.
This study aims to examine satellite-derived rainfall projections using CHIRPS for South Africa by comparing the CHIRPS-based rainfall estimates with observed rainfall at rain gauge stations. Rainfall estimates for the different rainfall categories, and their variations within a spatial and temporal context, were evaluated in this research. CHIRPS was selected because of its high spatial and temporal resolution. It also covers at least 30 years of global rainfall sufficient for validation, using in situ rain gauge measurements (or data). Uncertainties relating to how CHIRPS-based rainfall data compares with observed rain gauge data for different rainfall categories, over the seasonal and spatial context, were investigated in this study.
MATERIALS AND METHODS
Study area
South Africa lies between the coordinates 22.1° to 34.8° south and 16.4° to 33.0° east. The region is classified as semi-arid having variation in climate and topography from a narrow coastline giving way to mountainous escarpments into the high inland plateaus. South Africa has an area of approximately 1.22 million km2 and its neighbours are Botswana, Lesotho, Mozambique, Namibia, Swaziland and Zimbabwe.
The interannual periodic variation of rainfall in South Africa is mostly controlled by El Niño and La Niña southern oscillations. The El Niño Southern Oscillation phase (ENSO) results in a decreased rainfall and an increase in temperature, while La Niña causes the opposite (MacKellar et al 2014). This interaction between ocean and atmosphere, resulting in cyclic fluctuations of sea surface temperature (SST), determines the wetness or dryness within a given cycle (Lester 2019). The climate of South Africa is characterised by four seasons, i.e. spring (September, October, November), summer (December, January, February), autumn (March, April, May), and winter (June, July, August). There are three distinct regions, i.e. summer, winter and all-year-round precipitation (Figure 1). The all-year-round rainfall is confined to the southern coastal belt. Summer is the wettest season, with winter the driest season for most of the country, except for the Western Cape region where the opposite is true. This region experiences a wet winter as a result of the effects of the cold Benguela current and the northward displacement of high-pressure systems, causing winter rainfall, while the warm, moist Indian ocean currents along the southern coastal belt produce an all-year rainfall along the southern coast and the inland plateau which mainly experiences wet summers with thundershowers (Du Plessis & Schloms 2017). The varied topography and climate across the region offer an opportunity for the validation of CHIRPS-based rainfall data as a complementary source of daily rainfall data over the country.
Rain gauge data
South Africa has a relatively good network of rainfall recording weather stations compared to the rest of Africa and much of the southern hemisphere (Easterling et al 2000; New et al 2000). Pitman (2011), however, reports a considerable decrease in the number of operational rainfall recording stations in South Africa over the last quarter of the 20th century through to the first decade of the 21st century. Despite the relative paucity of rainfall recording stations, the existing network still makes it possible to have a pool of stations that can be sampled for purposes of comparison and validation of CHIRPS-based rainfall data. A representative sample, well distributed over the country, of 71 stations with daily rainfall data for the past 100 years was obtained from SAWS and subjected to data quality and homogeneity analyses, resulting in a total of 46 stations being considered as useable stations for this study. Stations with more than 10% missing data, and those established to be inhomogeneous, were discarded. The distribution of the selected homogenous stations across South Africa is illustrated in Figure 1. Rainfall stations selected are particularly scarce in the dry Northern Cape (ringed in Figure 1). This motivates the need for an alternative (supplementary) rainfall data set to provide insight regarding trends in the variability of regional rainfall, and trends required for water resource studies.
CHIRPS-based data
While only a brief overview of the CHIRPS has been provided here, a detailed description was provided by Funk et al (2015). CHIRPS provides daily precipitation data at a spatial resolution of 0.05° for a quasi-global coverage of 50° N - 50° S from 1981 to near-present. The latest version (version 2.0) can be obtained from https://data.chc.ucsb.edu/products/CHIRPS-2.0/africa_daily. CHIRPS data is estimated using an algorithm which combines data from the Climate Hazards group Precipitation climatology (CHPclim), created using rain gauge data collected from the Food and Agriculture Organisation (FAO), Global Historical Climatology Network (GHCN), and the Cold Cloud Duration (CCD) information; based on thermal infrared data archived from the Climate Prediction Centre (CPC) and National Oceanic and Atmospheric Administration (NOAA); the National Climate Data Centre (NCDC), version 7 TRMM 3B42 data; the version 2 atmospheric model rainfall field from the NOAA Climate Forecast System (CFS); and the observed rain gauge data from multiple sources.
The process to derive the available (via link provided) CHIRPS data is well described by Funk et al (2015) and can be summarised as follows:
The CCD data is calibrated with the TRMM 3B42 data to generate the 5-day CCD-based precipitation estimates. These estimates are then translated into fractions of the long-term mean precipitation estimates. The fractions are then multiplied with CHPclim data to remove the systematic bias and to derive the CHIRPS data. The CHIRPS data is then finally blended with rainfall recording stations data, using a modified inverse distance weighting algorithm, to produce the final CHIRPS data set. These processes are performed at a 5-day timescale. The daily CCD data and daily CFS data are then used to disaggregate the 5-day products to daily precipitation estimates using a simple redistribution. The data is downloaded in raster format and thereafter extracted for each station for use in comparative analysis, using the described methods.
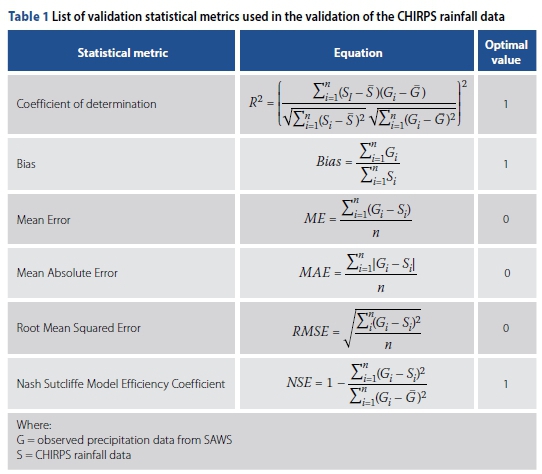
Evaluation methods
For evaluation purposes, six commonly used pairwise statistical metrics (comparing observed gauged daily rainfall data with the daily data as provided in the CHIRPS data set) were used following Duan et al (2016) and Dinku et al (2018). The equations and optimal values of the metrics are summarised in Table 1 on page 45. The coefficient of determination (R2) describes the degree of collinearity between observed rain gauge data and the CHIRPS-based rainfall data, and further depicts the proportion of the variance in observed rainfall data explained by the CHIRPS rainfall product. Bias, mean error (ME), mean absolute error (MAE), and root mean square error (RMSE) were also used to support the analysis.
It should be noted that the validation results are specific to the station networks used and represent accuracy levels in places where station data is available and has been used in this study.
RESULTS AND DISCUSSION
Validation at a daily time-step
Scatter plots of daily precipitation from CHIRPS-based rainfall data against observed rain gauge data for all the stations show a large scatter, as illustrated by a typical example (Cape Point with R2 = 0.05) in Figure 2.
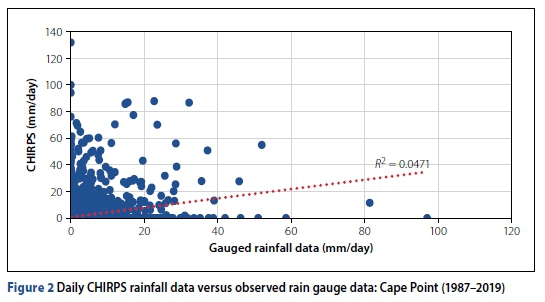
The large scatter is an example of expected poor agreement between CHIRPS-based rainfall data and observed rainfall data at a daily time-step. CHIRPS data is obtained by an algorithm that combines different data sets obtained by different procedures and then blended into one product. Daily CHIRPS data is obtained through the disaggregation of estimated 5-day rainfall data. The process followed at arriving at daily CHIRPS rainfall data anticipates several factors that may lead to a poor agreement with observed rain gauge data. These include possible satellite sampling errors, errors in estimation algorithms, data blending algorithms, bias correction algorithms, disaggregation procedures, and use of unrepresentative data in bias correction (Duan et al 2016).
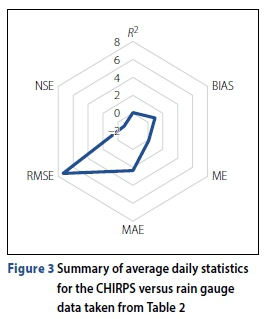
The results of statistical metrics at a daily timescale are summarised in Table 2, and its average values are illustrated in Figure 3. The average coefficient of determination (R2) is 0.06. This value is extremely low, indicating a lack of correlation between daily CHIRPS-based rainfall data and observed rainfall data as anticipated by a typical scatter plot in Figure 2. The average NSE value of -0.83 further suggests that CHIRPS-based rainfall data is not best at estimating the daily mean rainfall. Bias is relatively good with an average 0.95 out of an optimal value of one. ME and RMSE values are relatively high, suggesting a relatively low correspondence between the observed rainfall data and the CHIRPS-based rainfall data at a daily time-step.
Validation at monthly time-steps
The daily precipitation data for both CHIRPS and observed rain gauge data was accumulated to monthly totals and a similar statistical evaluation, as done for the daily time-step series conducted. Monthly scatter plots, providing an overview of the expected relationship between CHIRPS-based rainfall data and observed monthly rainfall data, are illustrated by the typical example in Figure 4, showing scatter plot for the Ottoshoop Pol station with an R2 of 0.78.
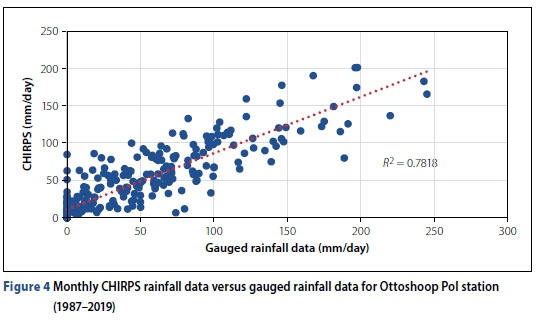
Compared to the performance of the daily data analysis, monthly CHIRPS rainfall data and the observed rain gauge data exhibit significantly stronger correlation. The results of the statistical metrics for the comparison are summarised in Table 3.
The coefficient of determination ranges from a minimum of 0.35 to a maximum of 0.78, with a mean value of 0.6, as shown in Table 3 and illustrated in Figure 5. These values indicate the existence of a reasonable correlation between monthly CHIRPS-based rainfall data and observed rain gauge data, as also suggested by the scatter plot in Figure 4. Bias is observed to be good with an average of 0.95 out of an optimal value of 1. The distributions of the coefficient of determination and bias across South Africa are illustrated in Figures 5 and 6 respectively.
The northeastern region has the highest R2 while the southwestern region has the lowest values. The Limpopo, Vaal, Mfolozi, Olifants and Komati catchments have an excellent R2of at least 0.7. The Kromme catchment along the southern coast has the poorest R2ranging from 0.43 to 0.46. Bias distribution across the country follows a similar trend to that of R2. The central part of the country has an optimal bias value of 1, which increases northwards and decreases southwards. The ME, MAE, RMSE and NSE parameters all reflect poor similarity. Comparing the results of these four parameters with statistical results for daily analysis, NSE is the only statistical parameter that improves slightly at a monthly time-step, but it remains below 0.65, which is the lowest acceptable value.
However, six stations are observed to have an NSE value of greater than 0.65, suggesting CHIRPS to be a good estimator of monthly rainfall data for them. Stations numbered 1, 35, 37, 39, 40 and 46, having good NSE values, are geographically located in the northern part of the country (Limpopo, Olifants and Komati catchments) which experiences relatively high rainfall. This is in contrast to Station Number 1, of which the average annual rainfall is 621 mm, located on the west coast of the Western Cape region (Berg catchment), as illustrated by the stations' distribution in Figure 1.
The mean values for ME, MAE, RMSE and NSE, based on monthly data, are 1.24, 21.60, 42.70, and 0.49, respectively. These four statistical parameters do not improve to optimal values with a change in timestep, as was also observed by other studies such as those of Dembélé and Zwart (2016), Duan et al (2016) and Dinku et al (2018).
Monthly validation
Taking into account the monthly variation in precipitation as a factor influencing the relationship between CHIRPS-based rainfall data and gauged rain data (Duan et al 2016), a monthly validation analysis was performed to determine if specific months compare better than others. To better understand the results of monthly specific pairwise comparison of CHIRPS-based rainfall data and observed rainfall data it is important to have a picture of the characterisation of precipitation in South Africa. The distribution of precipitation in time and space is categorised into four main seasons, with peak precipitation occurring during November, December and January (summer). For most of the country, winter (June, July, August) is the driest period, while autumn (March, April, May) and spring (September, October, November) represent the rising and descending limb in the distribution of annual rainfall in the summer rainfall region. However, in the Western Cape, the opposite is true, as it is a winter rainfall region. The region, mainly dominated by a Mediterranean climate, receives winter rainfall from cyclones originating over the South Atlantic, while its summer is dry (Du Plessis & Schloms 2017). Some parts of the Southern Cape, however, have different rainfall mechanisms, mostly influenced by the movement of warm, moist air from the Indian Ocean.
These regions experience an all-year rainfall with its peak in summer, like in other parts of the country. The results of the summer rainfall region analyses are illustrated using radar diagrams in Figure 7.
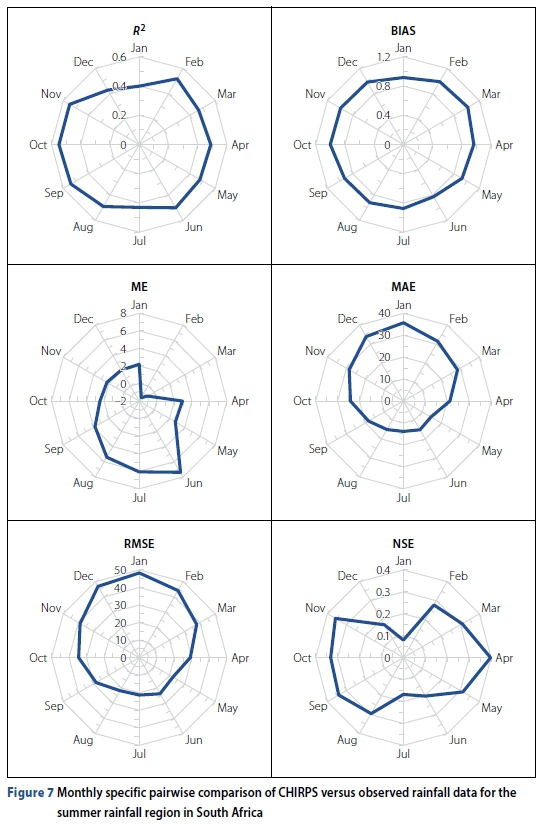
The R2, NSE and bias statistical parameters follow a similar trend throughout the year. These statistical metrics attain their best values during the spring and autumn seasons, while reflecting the worst comparison during the dry winter season, as illustrated in Figure 7. Summer, which is the wettest season, also has a low correlation. The results presented in Figure 7 suggest a stronger correlation between CHIRPS-based rainfall data and observed rainfall data during the start and end of the rainy season, evidenced by the strongest correlation during April and October. The low correlation during winter and summer confirms the findings of Duan et al (2016) of higher errors in satellite rainfall products (inclusive of CHIRPS data) during the winter season when precipitation is low and low error values during the wet summer seasons.
The results of winter rainfall region analyses are illustrated using radar diagrams in Figure 8.
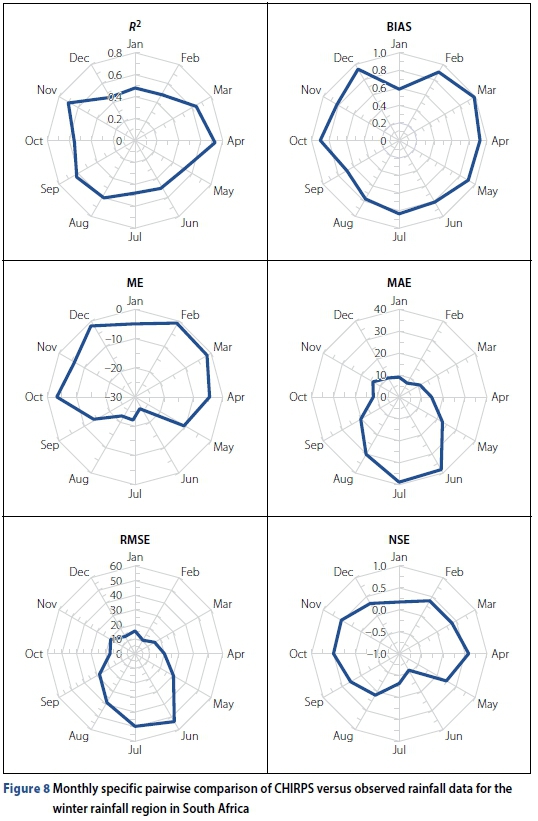
For winter rainfall regions experiencing a Mediterranean climate, an observation is made of a stronger correlation during the autumn and spring seasons, evidenced by the strong correlation recorded in April, September and November, as illustrated in Figure 8.
For the winter rainfall regions, correlation is low during winter because of the multiple errors likely to be attributed to winter precipitation associated with shallow clouds not detected by satellite algorithms, as highlighted in studies by Tian et al (2007) and Mei et al (2015). Satellite algorithms have also been observed to perform better in detecting precipitation in warm seasons, especially with convectional rainfall systems (Duan et al 2016). Further, Tian et al (2007) noted that ice and snow cover add errors to satellite signals by producing disturbing signals from those ice particles in the atmosphere. This is supported by the observation of high ME, MAE, RMSE and low R2values during winter months, as illustrated in Figure 8. The NSE values are low and follow a similar trend across the year to that of R2.
The results of the all-year rainfall region analyses are illustrated using radar diagrams in Figure 9.
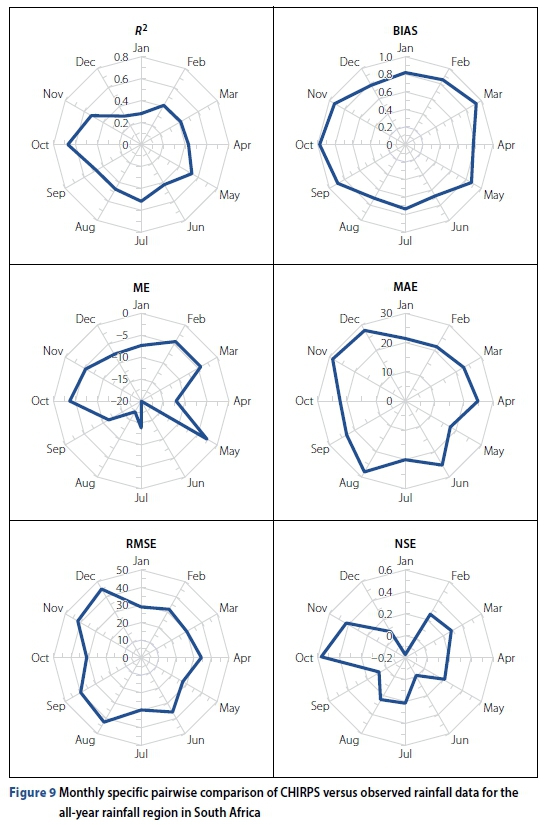
For regions experiencing rainfall throughout the year, the South Coast value of R2is such that it is the strongest during spring and the weakest during summer. The strongest correlation is recorded in October with an R2of 0.67, while the least correlation is in January with R2 of 0.28, as illustrated in Figure 9.
The R2values are generally low, with most values below the average of 0.5. This is an indication of poor correlation for CHIRPS and observed monthly rainfall for regions experiencing an all-year rainfall distribution. This is illustrated in Figure 5 where the Bushmans, Kromme and Swartkops catchments along the South Coast have values below 0.5 R2. The low correspondence between CHIRPS and observed monthly rainfall for this region is supported by the high MAE and RMSE and low NSE values illustrated in Figure 9.
Comparing the distribution of R2for the three rainfall regions, the all-year rainfall region has R2values increasing from May, with its peak in October, while the summer and winter regions' R2values tend to be high during March, April, May, September, October and November, as shown in Figures 7, 8 and 9. The R2values are the highest in the summer rainfall regions, followed by winter rainfall regions, and least for all-year rainfall regions, as also illustrated in Figure 7, 8 and 9.
Observing results for the winter, summer and all-year rainfall regions, the following deductions can be made:
The MAE and RMSE are observed to be high during summer and winter compared to the other seasons, while NSE is relatively high during spring and autumn for the summer and winter rainfall regions, respectively. For the winter and summer seasons, irrespective of whether the region experiences a winter, summer or all-year rainfall, the correlation is observed to be slightly lower than that of the spring and autumn seasons, as illustrated in Figures 7, 8 and 9. This is explained by the fact that CHIRPS tends to overestimate low amounts of rainfall and underestimate high amounts of rainfall for the different time intervals (Dinku et al 2018). This is well illustrated by the difference in peaks between the CHIRPS and observed rainfall, as shown in Figure 10, representing the monthly plot for the Ottoshoop Pol station 39, which is located near the border between the Orange area and the Limpopo Province, as depicted in Figure 1. Generally, the four parameters RMSE, ME, MAE and NSE do not improve significantly from daily to monthly, as mentioned earlier. The first three parameters (RMSE, ME and MAE) indicate the magnitude of overestimation/underestimation, while the latter (NSE) shows predictive accuracy relative to the mean of observed rainfall. Despite the decrease in the magnitude of overestimation/underestimation from daily to monthly, the effects are still pronounced at a monthly time-step as illustrated in Figure 10.
CONCLUSIONS
CHIRPS-based rainfall data was evaluated using a network of forty-six stations adequately distributed across South Africa. The analysis was done at daily and monthly time-steps with CHIRPS data of spatial resolution 0.05° latitude/longitude from 1987 to 2019. Validation statistics were computed for the entire region. The results of CHIRPS-based rainfall data validation statistics across South Africa were observed to show similar findings to previous studies in other regions, such as in East Africa by Kimani et al (2018) and in Italy by Duan et al (2016).
CHIRPS rainfall data is observed to be good in estimating monthly rainfall (based on accumulated daily rainfall data), except for the all-year rainfall regions, but poor in estimating daily rainfall. The poor estimation of daily rainfall is likely due to the processes involved in computing daily CHIRPS-based rainfall data through the disaggregation of a 5-day rainfall product, as highlighted by Funk et al (2015).
Monthly CHIRPS rainfall data (based on accumulated daily data) is observed to have good correspondence with observed rainfall data evinced by stronger correlation values. The correspondence of monthly rainfall, however, varies for different regions. The all-year rainfall region has its best correspondence during spring and its lowest in summer. This is different from the winter and summer rainfall regions, which have a similar correspondence pattern between them. These regions have their best correspondence during the autumn and spring months, and the lowest during winter and summer. The winter and summer rainfall regions have a low correlation during winter and summer seasons respectively due to the overestimation/ underestimation of observed rainfall during the wet and dry seasons.
For the South Coast (the all-year rainfall region), the correspondence is slightly low and records its strongest correlation in October. The low correspondence is likely because of rainfall formation mechanisms, nature and the amount of rainfall, which affect the quality of CHIRPS data for this region. Dinku et al (2018) credit the low correlation between CHIRPS data and observed rainfall data to the effects of frontal systems along the coastline of East Africa. Low correlation (below 0.4) is observed in parts of Gourits, Gamtoos, Sundays, Kromme and Swartkops catchments in the all-year rainfall region, and care should be taken when using CHIRPS rainfall data in these areas.
CHIRPS rainfall data performs well in the northern part of the country. Correspondence decreases southwards to the dry Northern Cape region, with an R2 of approximately 0.5-0.6. In these areas, CHIRPS offers a good alternative source of monthly rainfall data. The Limpopo, Olifants, Komati, Mfolozi, and parts of Tugela and Vaal have the best R2of at least 0.7.
The Berg catchment in the Western Cape and parts of the Vaal, Tugela and Mkomazi catchments follow closely with R2 of at least 0.65. The rest of the catchments have R2ranging between 0.5 and 0.6.
The catchments along the Eastern Coast have the lowest R2 values (less than 0.5). Therefore, the use of CHIRPS data in hydrological analysis should be guided accordingly, while appreciating the variation in correlation across the different regions of South Africa, as illustrated in Figure 5. In regions with a strong correlation, such as the northern part of the country with R2 greater than 0.7, CHIRPS data can be used confidently. However, the use of CHIRPS data is not advisable for regions with significantly low correlation (R2below 0.5), such as the Eastern Coast in the Keiskamma, Mzimvubu, Mkomazi and Mfolozi catchments.
Finally, this study found that CHIRPS-based rainfall data at a monthly time-step is an adequate alternative to use in complementing observed rainfall data in hydrological analyses for different regions across South Africa. The confidence in using CHIRPS data should, however, be in line with the strength of correlation (Figure 5), which varies for different rainfall regions, as discussed. The findings of this study complement observations by several other studies, such as Toté et al (2015), Ayehu et al (2017), Kimani et al (2017), Dinku et al (2018) and Muthoni et al (2019) in countries such as Mozambique, Ethiopia, Uganda, Tanzania and Kenya, which is comforting.
ACKNOWLEDGEMENT
The authors wish to thank Stellenbosch University for providing an enabling environment for research and SAWS rainfall data.
REFERENCES
Adler, R F, Huffman, J G, Chang, A, Ferraro, R, Xie, P, Janowiak, J et al 2003.The version-2 global precipitation climatology project (GPCP) monthly precipitation analysis (1979-present). Journal of Hydrometeorology, 4(6): 1147-1167. doi: 10.1175/1525-7541(2003)004<1147:TVGPCP>2.0.CO;2. [ Links ]
Ayehu, G, Tedesse, T T, Gessesse, B & Dinku, T 2017. Validation of new satellite rainfall products over the Upper Blue Nile Basin, Ethiopia. Atmospheric Measurement Techniques, 11: 1921-1936. doi: 10.5194/atm-11-1921-2018. [ Links ]
Botai, C M, Botai, J O & Adeola, A M 2018. Spatial distribution of temporal precipitation contrasts in South Africa. South African Journal of Science, 114(7-8): 1-9. doi: 10.17159/sajs.2018/20170391. [ Links ]
Dembélé, M & Zwart, S J 2016. Evaluation and comparison of satellite-based rainfall products in Burkina Faso, West Africa. International Journal of Remote Sensing, 37(17): 3995-4014. doi: 10.1080/01431161.2016.1207258. [ Links ]
Dinar, A, Hassan, R, Mendelsohn, R, Benhin, J et al 2008. Climate Change and Agriculture in Africa: Impact Assessment and Adaptation Strategies. London: Routledge. doi: 10.4324/9781849770767. [ Links ]
Dinku, T, Hailemariam, K, Maidment, R, Tarnavsky, E & Connor, S 2014. Combined use of satellite estimates and rain gauge observations to generate high-quality historical rainfall time series over Ethiopia. International Journal of Climatology, 34(7): 2489-2504. doi: 10.1002/joc.3855. [ Links ]
Dinku, T, Funk, C, Peterson, P, Maidment, R, Tedesse, T, Gadain, H et al 2018. Validation of the CHIRPS satellite rainfall estimates over eastern Africa. Quarterly Journal of the Royal Meteorological Society, 144(August): 292-312. doi: 10.1002/qj.3244. [ Links ]
Duan, Z, Liu, J, Tuo, Y, Chiogna, G & Disse, M 2016. Evaluation of eight high spatial resolution gridded precipitation products in Adige Basin (Italy) at multiple temporal and spatial scales. Science of the Total Environment, 573: 1536-1553. doi: 10.1016/j.scitotenv.2016.08.213. [ Links ]
Du Plessis, J A & Schloms, B 2017. An investigation into the evidence of seasonal rainfall pattern shifts in the Western Cape, South Africa. Journal of the South African Institution of Civil Engineering, 59(4): 47-55. doi: 10.17159/2309-8775/2017/v59n4a5. [ Links ]
Easterling, D R, Evans, J L, Groisman, P Y, Karl, T R, Kunkel, K E & Ambenje, P 2000. Observed variability and trends in extreme climate events: A brief review. Bulletin of the American Meteorological Society, 81(3): 417-425. doi: 10.1175/1520-0477(2000)081<0417:OVATIE>2.3.CO;2. [ Links ]
Funk, C, Peterson, P, Landsfeld, M, Pedreros, D, Verdin, J, Shukla, S et al 2015. The climate hazards infrared precipitation with stations: A new environmental record for monitoring extremes. Scientific Data, 2: 1-21. doi: 10.1038/sdata.2015.66. [ Links ]
Hirpa, F A, Gebremichael, M & Hopson, T 2010. Evaluation of high-resolution satellite precipitation products over very complex terrain in Ethiopia. Journal of Applied Meteorology and Climatology, 49(5): 1044-1051. doi: 10.1175/2009JAMC2298.1. [ Links ]
Kimani, M W, Hoedjes, J C.B & Su, Z 2017. An assessment of satellite-derived rainfall products relative to ground observations over East Africa. Remote Sensing, 9(5): 430-451. doi: 10.3390/rs9050430. [ Links ]
Kimani, M W, Hoedjes, J C B & Su, Z 2018. Bayesian Bias correction of satellite rainfall estimates for climate studies. Remote Sensing, 10(7): 1-18. doi: 10.3390/rs10071074. [ Links ]
Lester, L A2019. Exploratory investigation of extending rainfall records in the Western Cape by means of dendroclimatology. MEng Dissertation. Stellenbosch University. [ Links ]
MacKellar, N, New, M & Jack, C 2014. Observed and modelled trends in rainfall and temperature for South Africa: 1960-2010. South African Journal of Science, 110(7-8): 1-13. doi: 10.1590/sajs.2014/20130353. [ Links ]
Makapela, L, Newby, T, Gibson, L A, Majozi, N, Mathieu, R, Ramoelo, A et al 2015. Review of the use of earth observations and remote sensing in water resource management in South Africa. WRC Report No. KV 329/15 Pretoria: Water Research Commission. [ Links ]
Mei, Y, Anagnostou, E N, Nikolopoulos, E I & Borga, M 2015. Reply to "Comments on 'Error analysis of satellite precipitation products in mountainous basins' ". Journal of Hydrometeorology, 16(3): 14451446. doi: 10.1175/JHM-D-15-0022.1. [ Links ]
Muthoni, F K, Odongo, V O, Ochieng, J, Mugalavai, E M, Mourice, S K, Hoesche-Zeledon, I et al 2019. Long-term spatial-temporal trends and variability of rainfall over Eastern and Southern Africa. Theoretical and Applied Climatology, 137(3-4): 1869-1882. doi: 10.1007/s00704-018-2712-1. [ Links ]
New, M, Hulme, M & Jones, P 2000. Representing twentieth-century space-time climate variability. Part II: Development of 1901-1996 monthly grids of terrestrial surface climate. Journal of Climate, 13(July): 2217-2238. doi: 10.1175/1520-0442(2000)013<2217. [ Links ]
Novella, N S & Thiaw, W M 2013. African rainfall climatology version 2 for famine early warning systems. Journal of Applied Meteorology and Climatology, 52(3): 588-606. doi: 10.1175/JAMC-D-11-0238.1. [ Links ]
Paredes-Trejo, F J, Barbosa, H A & Lakshmi Kumar, T V 2017. Validating CHIRPS-based satellite precipitation estimates in Northeast Brazil. Journal of Arid Environments, 139(April 2017): 26-40. doi: 10.1016/j.jaridenv.2016.12.009. [ Links ]
Phakula, S, Landman, W A & Beraki, A F 2018. Forecasting seasonal rainfall characteristics and onset months over South Africa. International Journal of Climatology, 38(January): e889-e900. doi: 10.1002/joc.5417. [ Links ]
Pitman, W V 2011. Overview of water resource assessment in South Africa. WRC 40-Year Celebration Special Edition 2011, 37(5): 659-664. doi: 10.4314/wsa.v37i5.3. [ Links ]
Tian, Y, Peters-Lidard, C D, Choudhury, B J & Garcia, M 2007. Multitemporal analysis of TRMM-based satellite precipitation products for land data assimilation applications. Journal of Hydrometeorology, 8(6): 1165-1183. doi: 10.1175/2007JHM859.1. [ Links ]
Toté, C, Patricio, D, Boogaard, H, Van der Wijngaart, R, Tarnavsky, E & Funk, C 2015. Evaluation of satellite rainfall estimates for drought and flood monitoring in Mozambique. Remote Sensing, 7(2): 1758-1776. doi: 10.3390/rs70201758. [ Links ]
WMO (World Meteorological Organisation) 2008. Hydrological data. In: Manual on Low-flow Estimation and Prediction. Operational Hydrology Report No. 50, WMO-No.1029. Geneva, Switzerland: WHO. [ Links ]
Xie, P & Arkin, P A 1997. Global precipitation: A 17-year monthly analysis based on gauge observations, satellite estimates, and numerical model outputs. Bulletin of the American Meteorological Society, 78(11): 2539-2558. doi: 10.1175/1520-0477(1997)078<2539:GPAYMA>2.0.CO;2. [ Links ]
 Correspondence:
J A du Plessis
Department of Civil Engineering, Stellenbosch University
Private Bag X1, Matieland 7602, South Africa
T: +2 7 21 80 8 43 5 6; E: jadup@sun.ac.za
J K Kibii
Department of Civil Engineering, Stellenbosch University
Private Bag X1, Matieland 7602, South Africa
T: +254 70 555 5439; E:kibiiyjoshua@gmail.com

PROF KOBUS DU PLESSIS (Pr Eng, FSAICE, FIMESA) has more than 33 years of experience in water engineering, of which the past 19 years were in the Civil Engineering Department at Stellenbosch University, where he is responsible for Hydrology and Environmental Engineering. Fie has a special interest in integrated management of water resources in South Africa as applied by local authorities, as well as in flood hydrology. He obtained his PhD (Water Governance), MEng (Water Resource Management) and BEng (Civil) from Stellenbosch University. He presently serves on the Executive Committee of IMESA (Institute of Municipal Engineering of Southern Africa) and on the Education and Training Panel of SAICE (South African Institution of Civil Engineering).

Joshua Kibii is a final-year Master's (Civil Engineering) student at Stellenbosch University. His research area covers the investigation of rainfall trends and variability in South Africa over the past century. He has also been involved in modelling impacts of climate variability, and land use change on catchment hydrologic response using remotely sensed data.

