


Services on Demand
Article
 English (pdf)
 Article in xml format
 Article references
Indicators

Related links
-
 Cited by Google
 -
 Similars in Google
Share

 Permalink
Journal of the South African Institution of Civil Engineering
On-line version ISSN 2309-8775
Print version ISSN 1021-2019
J. S. Afr. Inst. Civ. Eng. vol.63 n.3 Midrand Sep. 2021
http://dx.doi.org/10.17159/2309-8775/2021/v63n3a1
TECHNICAL PAPER
Three-dimensional contact stresses of a slick solid rubber tyre on a rigid surface
M De Beer; Y Van Rensburg; J W Maina
ABSTRACT
The main aim of this paper is to quantify the three-dimensional contact stresses imposed by a single slow-moving (or rolling) slick solid rubber tyre on a relatively rough contact surface, such as stiff asphalt concrete or airport concrete surfacing layers. The results indicated the tyre-contact patch of a slick solid rubber tyre to be of rectangular shape for a vertical tyre loading range between 20 kN and 100 kN. The rectangular tyre contact shape was confirmed with static paper prints, as well as an electronically measured contact patch with the stress-in-motion pad device. The study included load calibration using a mass load scale, and a stress-in-motion device. These were used with an existing full-scale accelerated pavement test device, referred to as the heavy vehicle simulator. In addition, simplistic multi-layer linear elastic modelling was used to quantify differences between stress and strain responses of two types of two relatively 'stiff' based pavements, such as an asphalt concrete base and Portland cement concrete base, on similar subbase and subgrade layers. Notable differences were obtained, which could potentially influence further detailed studies on the performance of full-scale slick solid rubber tyres on typical multi-layered pavements.
Keywords: slick solid rubber tyre, three-dimensional contact stresses, 3D, stress-in-motion (SIM) device, heavy vehicle simulator (HVS), multi-layer linear elastic (MLLE) modelling, asphalt concrete (AC) base, Portland cement concrete (PCC) base
BACKGROUND
Firstly, in the realm of tyre-pavement contact stress, little is known about the actual tyre-pavement contact between full-scale slick solid rubber tyres, as opposed to pneumatic rubber tyres. As pavement modelling methodologies develop, it is possible to model the actual shape of the tyre-pavement contact patch, as well as include three-dimensional (3D) contact stress data input. This is an introductory paper into this aspect, and it includes tyre-pavement contact shape and capturing of the actual 3D stress regime at the interface described by De Beer et al (1997), De Beer and Maina (2011), and Maina et al (2013). The stress-in-motion (SIM) pad device described by De Beer and Fisher (2013) was used for the measurements of these stresses. Secondly, in-plane tensile stress and strain responses at the bottom of the base course of two pavement types - i.e. asphalt concrete (AC) and a suffer pavement such as a Portland cement concrete (PCC) base under the slick smooth solid rubber tyre - are demonstrated by analysing a three-layered system using a multi-layer linear elastic (MLLE) model with a static tyre loading. This analysis was done using actual vertical contact stresses (Szz) only, for a tyre loading range from 20 kN to an extreme loading of 100 kN. This information may be useful to pavement engineers when designing pavements for loading areas in harbours, the mining industry, factory floors and airport apron pavements where most of the loading is from slow-moving heavy vehicles with slick solid rubber tyres, such as front-end loaders, cargo passenger boarding bridges and mining equipment. Normally this type of equipment needs increased manoeuvrability, stability and safety, and solid rubber tyres eliminate the need for maintaining high tyre inflation pressures required by traditional pneumatic tyres (Kargo Press-on PBB 2020).
PROBLEM STATEMENT
One of the main limitations for design purposes in pavement engineering, including airport apron pavements, is more realistic contact stresses (or loads) applied on these pavements under commercially available slick solid rubber tyres. Virtually no information on the actual contact patch of slick solid rubber tyres is available to pavement engineers to be used in mechanistic modelling.
OBJECTIVE
The objective of this paper is to quantify tyre-pavement contact shapes and 3D distributions of contact stresses of a full-scale slick solid rubber tyre. The foregoing is proposed to be used in pavement modelling. In this study, a typical 'press-on-rim' slick solid rubber tyre was selected for this purpose.
SCOPE
The scope of the paper is to demonstrate the quantification of full-scale tyre contact patches for the solid tyre, and use the results to model two different pavement types. The approach was to use a commercial, calibrated vertical load scale (see Figure 1, and a specially developed 3D load and contact stress device, referred to as the stress-in-motion (SIM) device (SIM pad), described by De Beer and Fisher (2013) in Figure 2 The SIM pad device can measure vertical, lateral and longitudinal contact forces (or loads), which are converted to contact stresses. The surface of the SIM test area is relatively rough, comparable to a dry, coarse asphalt pavement surfacing layer. An array of 3D load cell pins is mounted across the SIM device and is capable of capturing time-based contact stresses (approximate 10 mm wide across tyre width) of a slow-moving (~5 km/hr) tyre over the SIM system. See De Beer and Fisher (2013).


RESULTS
An image of the slick solid rubber tyre used in this study, which was assembled on the heavy vehicle simulator (HVS), is shown in Figures 1, 2 and 3.

Image of solid rubber 'press-on-rim' tyre mounted on the HVS (used in this study)
In Figure 3 a close-up of the pin arrangement on the SIM device (SIM pad) is shown. Note that the test surface is not smooth, but consists of small gaps (~10 mm) between the array of calibrated steel measuring pins (or 3D load cells), and dummy steel pins for the rest of the SIM pad testbed.
Tyre deformation rate (Dtyre) by measured recoverable (elastic) tyre deformation
The slick solid rubber tyre was an available commercial tyre of size 40" x 16" x 30" (1 016 mm X 406 mm x 762 mm) with a tyre contact width of approximately 330 mm at 20 kN to 355 mm at 100 kN loading. To establish the recoverable tyre deformation (or elastic deflection) characteristics, such as the elastic deformation
rate (Dtyre), the tyre was loaded onto a rigid concrete base (and a mass load scale (Figure 1) over a range of loads between 0 and 100 kN. The total deflection of the tyre axle on the HVS was measured, both on the left and right sides (see Figure 4. The ambient temperature of the rubber tyre was approximately 20°C to 25°C during the time of testing.

Tyre hardness and temperature
The slick solid rubber tyre used in this study is considered as a medium to hard shore hardness (Totallyseals 2021). Although not part of this study, it should be noted that most materials expand when heated. Rubber does just the opposite - it contracts. During vulcanisation, crosslinks of sulphur in rubber occur. The contraction occurs because the heat causes the molecules to become tangled with each other. Rubber bands that have tangled molecules at rest become more so when heated. Remove the heat and the rubber band returns to its original shape, just as it did when the stretching stopped (Doitpoms 2021). In the context of the solid tyre investigated, temperature and hardness were not regarded as variables. Given the above, the hypothesis is that, with increased tyre rubber temperature and hardness, the contact patch may shrink at the same load, thereby increasing the associated contact stress. This, however, is to be investigated with further studies.
The test matrix for vertical tyre deformation and associated results is shown in Table 1
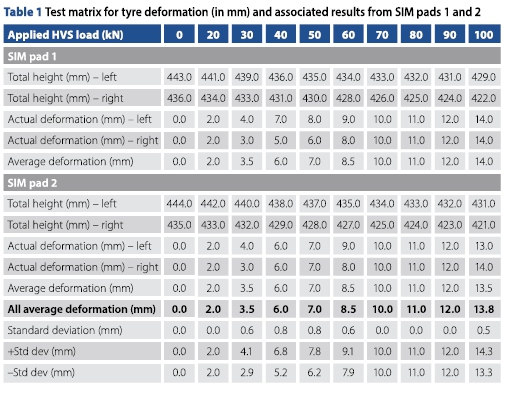
Testing matrix
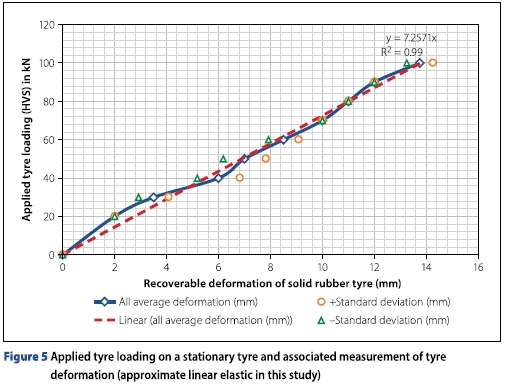
The test matrix for tyre deformation and associated results measured from rigid base to centre of axle is given in Table 1 The test data of this study is illustrated in Figure 5 An approximate linear relationship was obtained from the slick solid rubber tyre (this study).
Outcomes of tyre deformation test
Rubber is essentially an incompressible substance that deflects by changing shape rather than changing volume. It has a Poisson's ratio (v) of approximately 0.5. At relatively low strains, the ratio of the resulting stress to the applied strain is a constant rate of deformation, or Dtyre, in this case. This value is the same whether the strain is applied in tension or compression. Hooke's law is therefore valid within this proportionality limit (Schaefer 2018).
Given this, the main outcome of the tyre deformation results indicates a constant rate of deformation, or Dtyre, of the slick solid tyre, to be approximately 7.3 kN/mm (average slope of line obtained in Figure 5. The data approximated a linear relationship during test conditions of r2 = 0.99, with one approximate standard deviation on the rate of deformation measurements of the Dtyre data ranging between 7.0 kN/mm and 7.5 kN/mm. It should, however, be noted that up to the 40 kN applied loading (~6 mm deformation), the relationship is somewhat concave downward (non-linear) before it becomes more linear. This could be interpreted as rubber visco-elastic response, linked with tyre-steel rim 'settling' in at the time of increased loading from the HVS.
Tyre footprint data
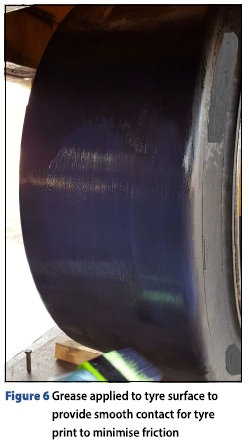
As part of the investigation, static tyre footprints were measured with paint (grease) on paper for every load condition given in Table 1(see Figures 6 and 7).

Scaled versions of the outcome of the paper prints are self-explanatory and are shown in Table 2 There was a slight increase in tyre width, but a larger increase in contact length under the range of test loads, ranging from 20 kN to 100 kN. The shape also becomes more rectangular with increased loading and an associated increase in the contact area of approximately 1.8 times. The slightly oval shape of the footprint at 20 kN results from the fact that the cross-section of the tyre was not perfectly flat, as there was a noticeable crown of a few mm (~2 mm) at the tyre centre. However, at higher loading, this becomes flatter, and the tyre wider directly because of the Poisson's ratio (v), as rubber is considered incompressible, i.e. v = 0.5. For road surface design purposes, it is the opinion that a rectangular shape is acceptable, as demonstrated in this paper.

Paper footprints of the solid tyre on a grid of 450 mm vertical and 300 mm horizontal for a vertical load range 20 kN to 100 kN are shown in Figures 8(a) to 8(i) on page 5.
3D CONTACT STRESS MEASUREMENTS
Full calibration check of the SIM pad device
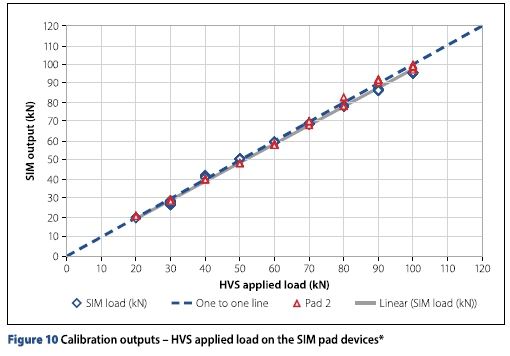
A commercially available vertical mass load scale was used in the static mode to calibrate the actual applied load by the HVS. The SIM pad device was calibrated in a factory using a special sensor load calibration device. Fairly good calibrations were achieved between these devices, which increased the level of confidence in these data sets. The load calibration data for the two cases - i.e. HVS versus mass load scale, and HVS applied load on the SIM pad devices - are given in Figures 9 and 10.

3D measurements of contact stresses using a SIM pad device
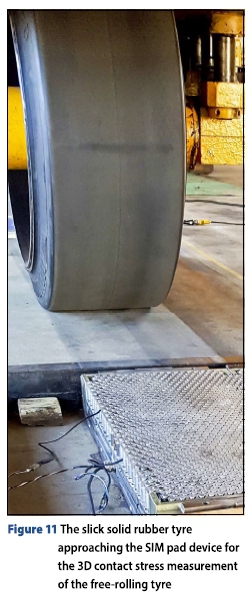
The tyre loading range for 3D testing was 20 kN to 100 kN, at ambient room temperature between 20°C to 25°C. The test speed was slow at approximately 5 km/hr in a straight line. The tyre was free rolling using the HVS as the full-scale loading device. In Figure 11 the typical approach of the full-scale slick solid rubber test tyre towards the SIM pad system is shown. The contact stresses are measured on the fly.
Normalised contact stress ratios (NCS)
For normal pneumatic tyres, it was established that normalised maximum contact stress (NCS) ratios - i.e. vertical (Z), lateral (Y) and longitudinal (X) - for a free-rolling tyre in a straight line are approximately 10:3:1 when the Szz is normalised to 10 (De Beer et al 1997). For this case of a slick solid rubber tyre, the results are summarised in Table 2 As expected, the NCSs for the free-rolling solid rubber tyre are slightly different from those of pneumatic tyres. The NCS result obtained for the slick solid rubber tyre was found to be 10:1.8:1.2 (or rounded-off 10:2:1) relative to NCS_Z. The longitudinal stresses (or loads) (X direction) within the contact patch were found to be slightly lower than those typically from free-rolling pneumatic tyres. This is probably owing to the combined effect of the Poisson's ratio and the friction forces in the direction of rolling (or rolling resistance) of the solid tyre over the relatively rough SIM pad device. It should be noted that both paper prints and the captured shape of contact stresses were of rectangular shape. Since the vertical forces (or contact stresses Z) are the highest of magnitude, such as for pneumatic tyres, the mechanistic MLLE analyses only focus on measured vertical contact stresses under a range of loading, using theory by Maina et al (2017).
Comparison of tyre prints
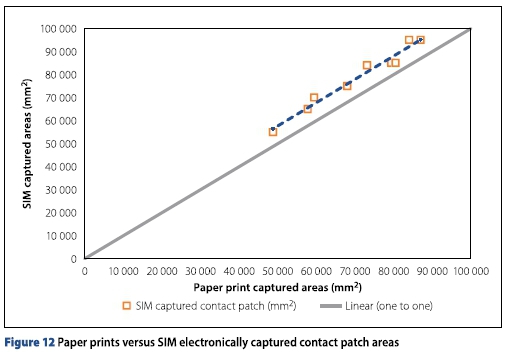
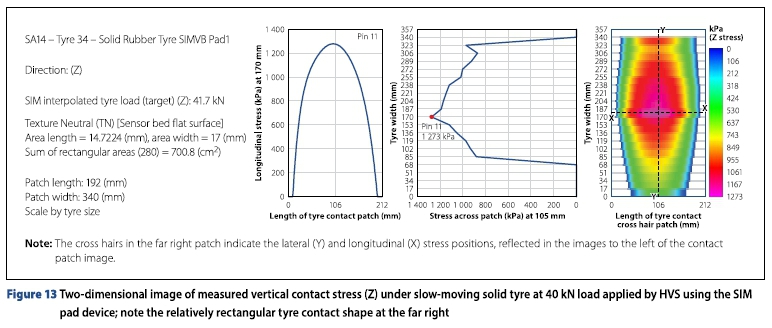
In this section, it is shown that the slick solid rubber tyre footprints from the static condition (paper prints) are approximately 10% smaller compared to those captured (or measured) by the SIM system (see Figure 12. It is postulated that there are two main reasons for this - paper prints were made in the static mode, whilst on the SIM system the electronic contact shapes (or prints) were measured under slow-moving (~5 km/hr) free-rolling tyre on a non-smooth SIM test surface, which provides a relatively longer contact patch owing to SIM contact friction, causing the rubber to stretch in the direction of movement (see Figure 13. This might need further experimentation in the future. For application in the modelling discussed in the next section, the shapes from paper prints were used, since the tyre-pavement contact patch can be represented by a rectangular shape for this paper.
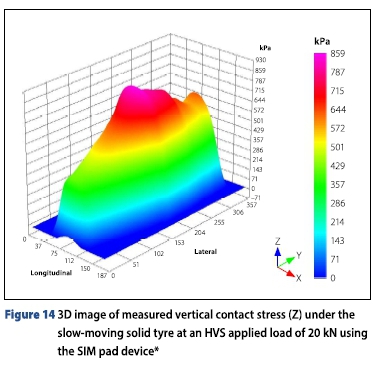
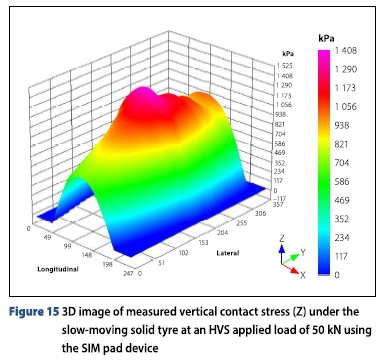
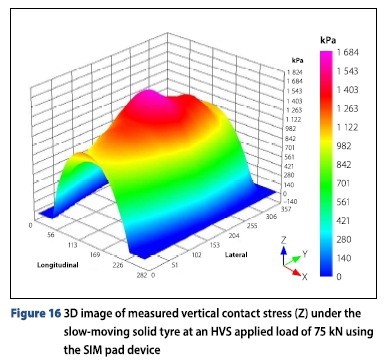
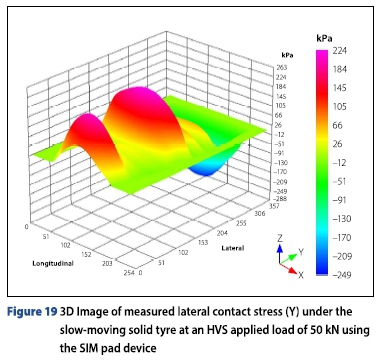
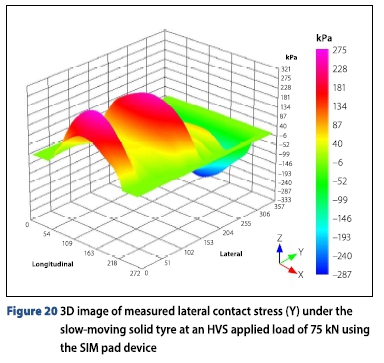
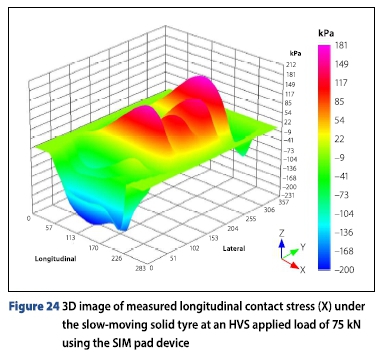
Typical selected vertical (Z) contact stresses under the solid rubber tyre at slow speed over the SIM pad are illustrated in Figures 14 to 17. For the lateral (Y) and longitudinal (X) contact stresses some examples are shown in Figures 18 to 21 and Figures 22 to 25, respectively (this study). Note that in these images both longitudinal (X) and lateral (Y) axes are in mm units. A smoothing interpolation algorithm was used for the calculation presentation of the actual measured contact stress values (De Beer et al 2012).


APPLICATION OF TEST RESULTS ON RELATIVELY STIFF PAVEMENT SURFACES
Mechanistic approach
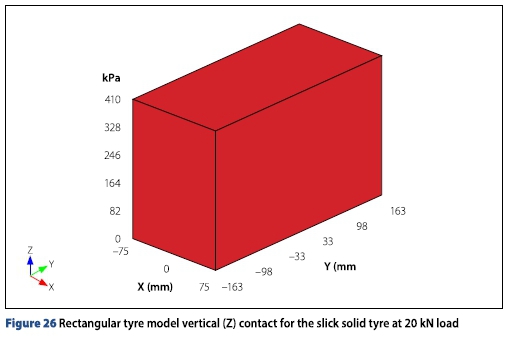
As pointed out earlier, for illustration in this paper, a relatively simple multilayer linear elastic mechanistic (MLLE) method was used to get an idea of the obtained effective tensile stress/strain characteristics at the bottom of a relatively stiff top layer (surfacing/base) of this tyre type. Only vertical load intensity (i.e. measured contact stresses in the Z direction) representing the tyre contact as rectangular (Maina et al 2017) was considered in this paper. See the simple tyre contact model in Figure 26
Analyses of tensile stresses and strains at the bottom of the surfacing layers
Tyre-pavement model
As mentioned, the tyre-pavement model used here is a three-layered MLLE system, with a rectangular tyre contact shape (Figure 26. Figure 27 shows the simplistic pavement modelling definition used in this paper. MLLE was selected in this paper owing to fast analysis (Maina et al 2017), and merely to demonstrate the theoretical stresses and strains under the given loading of the slick solid tyre. The modular ratios between asphalt (AC) base/subbase and concrete (PCC) base/subbase pavements modelled here are larger than 10, both on similar subgrade. The two relatively simple pavements, with base layer thicknesses of 150 mm, were selected for demonstration purposes only, of which relatively 'stiff' bases can also be referred to as relatively 'shallow1 pavements due to relatively flexible support. The engineering parameters are given in Figure 27 The case for flexible pavements, of typical modular ratios of say less than three is, however, not discussed in this paper.

Relatively stiff asphalt surfacing flexible pavement (three pavement layers)
Summary results of the maximum tensile stress and strain at the bottom of the asphalt layer [note the calculation was made inside (~1 mm) the bottom of the layer] may also be described as 'bottom of the top layer', to avoid interface conditions which might influence the stress and strain results (see Table 3. It should further be noted that interface conditions for the pavement analyses were assumed to be in full friction (i.e. no slip).

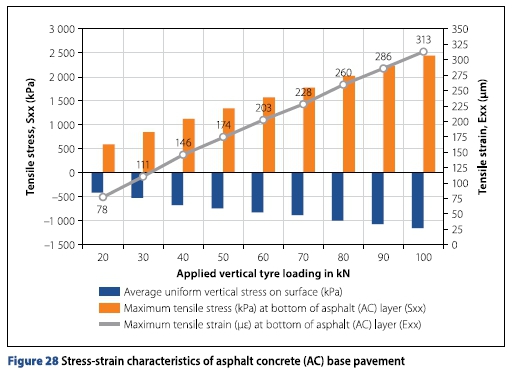
The results clearly indicate increased maximum tensile stress (Sxx), and maximum tensile strain (Exx) at increasing load levels. These response values were found to be across the contact patch of the tyre. This is indicative of potential crack initiation of a lateral crack in the AC layer, relative to tyre movement. Hypothetically, a lateral crack might develop growing towards the surface with increased loading repetitions (i.e. bottom-up cracking). The results are illustrated for trends in the associated Figure 28 As expected, linear trends, typically for MLLE type of analyses with full friction between layers for both response parameters, i.e. maximum Sxx and maximum Exx are illustrated with increased applied tyre loading. Sxx ranged between 591 kPa to 2 443 kPa, and Exx between 77 ue and 313 ue. Note that the scale of parameter Exx is on the right of Figure 28
Concrete airport (rigid) pavement and aprons (three pavement layers)
Similarly, the summary results of the maximum tensile stress and strain at the bottom of the concrete layer [note calculation was made inside (~1 mm) the bottom of the layer] may also be described as 'bottom of the top layer' to avoid interface conditions which might influence the stress and strain results (see Table 4. It should further be noted that interface conditions for the pavement analyses were assumed to be in full friction (i.e. no slip).
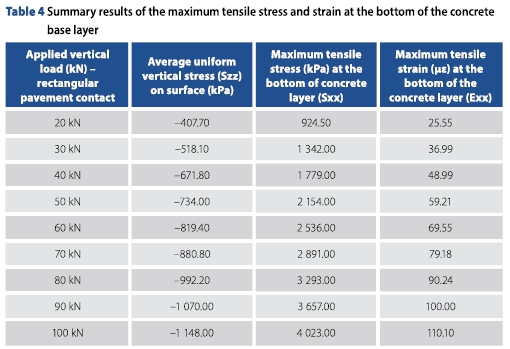
As for the AC pavement, the results indicate increased maximum tensile stress (Sxx), and maximum tensile strain (Exx) at increasing load levels, across the contact patch. These response values were found to be across the contact patch of the tyre and indicate the potential for crack initiation of a lateral crack in the PCC layer, relative to tyre movement. Hypothetically, a lateral crack might develop growing towards the surface with increased loading repetitions (i.e. bottom-up cracking). The results are illustrated for trends in the associated Figure 29 As expected, linear trends, typically for MLLE type of analyses with full friction between layers for both response parameters, i.e. maximum Sxx and maximum Exx, are illustrated with increased applied tyre loading. Sxx ranged between 925 kPa to 4 023 kPa, and Exx between 26 ue and 110 ue. Note that the scale of parameter Exx is on the right of Figure 29

DISCUSSION OF RESULTS
Quantification of the actual measured 3D contact stresses imposed by a single slow-rolling (<5 km/hr) slick smooth (no tread pattern) solid rubber tyre has been demonstrated. The tests were done on a relatively rough contact surface, such as stiff asphalt concrete (AC) and very stiff concrete (PCC) base layers. Simplistic modelling of three-layer MLLE was made on two pavement types for demonstration purposes.
3D contact stresses
As illustrated, the tyre contact of a slick solid rubber tyre could be measured with a device such as the SIM pad used in this paper. The result appears to be very illustrative in three dimensions. It also showed that, for a slow-moving free-rolling solid rubber tyre, in both the lateral (Y) and longitudinal (X) directions there were acting stresses (and strains) in the plane of non-smooth contact on the SIM pad device. Both static and slow-moving conditions of the slick solid rubber tyre showed that the tyre-contact patch is rectangular. It is therefore recommended to model the tyre-pavement contact of slick solid rubber tyres with the given rectangular shape obtained through measuring in this study.
Mechanistic modelling
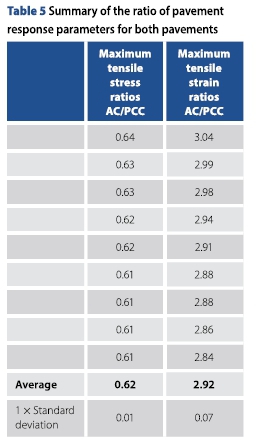
The modelling of the two pavement types was performed with MLLE theory, since both pavements were relatively stiffer in the base layers compared to typical flexible pavements. Linear trends in response parameter stresses and strains were found at the bottom of the bases for both pavement types. These responses, under increased tyre loading, could be quantified, and showed that the average maximum tensile stress ratio and maximum tensile strain: AC/PCC were 0.62 and 2.92 for the AC pavement relative to those of the PCC pavement in this study. This indicates that the stiffer the base, i.e. PCC, the higher the tensile stress at the bottom of this layer, relative to the AC base pavement (approximately five times higher), and therefore more prone to immediate fracture under loading. Acceptable standard deviations were noted (see Table 5.
Note
It should be noted that to estimate, for example, the 'fatigue cracking life' of the pavements studied here, appropriate transfer functions are needed which were not the purpose of this study and should be addressed in further studies regarding the slick solid rubber tyre used here. It is recommended that these studies should include accelerated pavement testing (APT), such as the HVS or similar available equipment, to get results in an affordable and timeous manner. For the asphalt base pavements a more suitable visco-elasto-plastic approach is highly recommended. For the concrete pavement it is also recommended to include more appropriate boundary conditions, such as joints and slab corners, if the concrete is not continually reinforced with steel and/or fibres. Finally, it is accepted and recommended that the important effect of environmental factors, e.g. layer density, pavement and tyre temperature, moisture, interlayer conditions and tyre dynamics, should also be included in future studies for a typical range of road roughness indices.
Main findings of this study
Tyre measurements
1. Under an applied static load range from 20 kN to 100 kN, a single commercial slick solid rubber tyre showed a linear deformation trend with a rate of tyre deformation (Dtyre) ranging between 7.01 kN/mm and 7.50 kN/mm, with the average value of 7.3 kN/mm.
2. The measured shapes of the tyre-pavement contact patch under a static, or slow-moving speed commercial slick solid rubber tyre were found to be rectangular, which increase in length with increased tyre loading.
3. Measured vertical (Z) contact stresses of a slow-moving commercial slick solid rubber tyre were found to range between a minimum of 858 kPa and a maximum of 1 921 kPa for a loading range of 20 kN and 100 kN.
4. Measured lateral (Y) contact stresses for a slow-moving commercial slick solid rubber tyre were found to range between a minimum of 146 kPa and a maximum of 354 kPa for a loading range of 20 kN and 100 kN.
5. Measured longitudinal (X) contact stresses for a slow-moving commercial slick solid rubber tyre were found to range between a minimum of 114 kPa and a maximum of 263 kPa for a loading range of 20 kN and 100 kN.
6. Normalised contact stresses (NCS) for a slow-moving commercial slick solid rubber tyre resulted in a nominal ratio of roughly 10:2:1.
Pavement modelling responses
1. For mechanistic modelling purposes of both the asphalt and concrete base pavements a nominal rectangular shape for tyre-pavement contact was used with applied uniform static vertical stress (Z) ranging between 408 kPa and 1148 kPa for a loading range of 20 kN to 100 kN.
2. Asphalt base pavement (AC): Calculated maximum tensile stresses (Sxx) for a slow-moving commercial slick solid rubber tyre were found to range between a minimum of 591 kPa and a maximum of 2 443 kPa for a loading range of 20 kN and 100 kN.
3. Patch under an asphalt base pavement (AC): Calculated maximum tensile strains (Exx) for a slow-moving commercial slick solid rubber tyre were found to range between a minimum of 78 ue and a maximum of 313 ue for a loading range of 20 kN and 100 kN.
4. Concrete base pavement (PCC): Calculated maximum tensile stresses (Sxx) for a slow-moving commercial slick solid rubber tyre were found to range between a minimum of 925 kPa and a maximum of 4 023 kPa for a loading range of 20 kN and 100 kN.
5. Concrete base pavement (PCC): Calculated maximum tensile strains (Exx) for a slow-moving commercial slick solid rubber tyre were found to range between a minimum of 26 ue and a maximum of 110 ue for a loading range of 20 kN and 100 kN.
6. A maximum tensile stress ratio of 0.62 and a maximum tensile strain ratio of 2.92 was found comparing the asphalt base pavement (AC) with the concrete base pavement (PCC) under an applied vertical tyre load ranging between 20 kN and 100 kN.
CONCLUSIONS
To conclude, the quantification of the three-dimensional (3D) contact stresses imposed by a single slow-moving (or rolling) slick solid rubber tyre on a relatively rough contact surface, such as stiff asphalt concrete or airport concrete surfacing layers, has been presented. The results indicate that the tyre-contact patch of a slick solid rubber tyre is rectangular for a vertical tyre loading range between 20 kN and 100 kN. The rectangular tyre contact shape was confirmed with static paper prints, as well as an electronically measured contact patch with the SIM pad device. The study included load calibration using a mass load scale, and a stress-in-motion (SIM) device. These were used with an existing full-scale accelerated pavement test device, referred to as the heavy vehicle simulator (HVS).
In addition, simplistic multi-layer linear elastic (MLLE) modelling was used to quantify the differences between the stress and strain responses of two types of two relatively 'stiff' based pavements, such as an asphalt concrete (AC) base and a Portland cement concrete (PCC) base, on similar sub-base and subgrade layers. Notable differences were obtained, which could potentially influence further detailed studies on the performance of full-scale slick solid rubber tyres on typical multi-layered pavements.
ACKNOWLEDGEMENT
The research reported in this paper was performed in 2017 by the South African Council for Scientific and Industrial Research (CSIR). The CSIR is acknowledged for their long-term support towards the establishment of the stress-in-motion (SIM) technology platform focusing on tyre-road interaction. This technology platform was initiated by the CSIR in the mid-1990s.
REFERENCES
De Beer, M, Fisher, C & Jooste, F J 1997. Determination of pneumatic tyre/pavement interface contact stresses under moving loads and some effects on pavements with thin asphalt surfacing layers. Proceedings, 8th International Conference on Asphalt Pavements, 10-14 August 1997, Seattle, Washington, Vol. 1, pp 179-227. [ Links ]
De Beer, M, Maina, J W 2011. Using tire-road contact stresses in road pavement design and analysis. Tire Technology International 2011 Annual Review, UK. http://viewer.zmags.eom/publication/54f87b66#/54f87b66/76. (Last visited: 2021-09-09). [ Links ]
De Beer, M, Maina, J W, Van Rensburg., Y & Greben, J M 2012. Toward using tire-road contact stresses in pavement design and analysis. Tire Science and Technology, 40(4): 246-271. http://tiresciencetechnology.org/doi/abs/10.2346/tire.12.400403. (Last visited: 2021-09-09) [ Links ]
De Beer, M, Fisher, C 2013. Stress-In-Motion (SIM) system for capturing tri-axial tyre-road interaction in the contact patch. Measurement, Volume 46(7): 2155-2173. https://doi.Org/10.1016/j.measurement.2013.03.012. (Last visited: 2021-09-09). [ Links ]
Doitpoms 2021. https://www.doitpoms.ac.uk/tlplib/stiffness-of-rubber/contraction2.php. (Last visited: 2021-09-09) [ Links ]
Kargo Press-on PBB 2020. https://www.trelleborg.com/en/wheels/products-and-solutions/ground-support-equipment-tires/passenger-boarding-bridge/kargo-press-on-pbb. (Last visited: 2021-09-09) [ Links ]
Maina, J W, De Beer, M & Van Rensburg, Y 2013. Modelling tyre-road contact stresses in pavement design and analysis. Proceedings, 32nd Annual Southern African Transport Conference, 8-11 July 2013, Pretoria. [ Links ]
Maina, J W, Kawana, F & Matsui, K 2017. Numerical modelling of flexible pavement incorporating cross-anisotropic material properties. Part II: Surface rectangular loading. Journal of the South African Institution of Civil Engineering, 59(1): 28-34. http://dx.doi.org/10.17159/2309-8775/2017/v59nla4. (Last visited: 2021-09-09) [ Links ]
Schaefer, R J 2018. Mechanical properties of rubber. Chapter 33. In Piersol, A G (Ed.). Harris'Shock and Vibration Handbook. 5th ed. New York: McGraw-Hill, https://www.globalspec.com/reference/64489/203279/chapter-33-mechanical-properties-of-rubber. (Last visited: 2021-09-09) [ Links ]
Totally Seals* 2021. https://www.totallyseals.com/blogs/news/what-is-shore-hardness. (Last visited: 2021-09-09) [ Links ]
 Correspondence:
M De Beer
Director
Road Pavement Forensic Engineeering (RPFE) (Pty) Ltd
926 Pierneef Street, Villieria, Pretoria 0186, South Africa
T: +27 74101 7406, E: morris@rpfe.co.za
Y Van Rensburg
Smart Mobility
Council for Scientific and Industrial Research (CSIR)
P0 Box 395, Pretoria 0001, South Africa
T: +2712 8412702, E:yvrensburg@csir.co.za
J W Maina
Department of Civil Engineering
University of Pretoria
Private Bag X20, Hatfield 0028, South Africa
T: +2712 420 6608, E: james.maina@up.ac.za

DR MORRIS DE BEER (Pr Eng, MSAICE, MSAT) is an independent researcher and specialist consultant on road pavement behaviour and materials, and is a past associated editor of tie International Journal for Road Materials and Pavement Design. He obtained his BSc (Hons), Master's and PhD degrees in civil engineering from the University of Pretoria, where he also later served as a guest lecturer. His research interests cover structural road pavement behaviour, road design and investigation, road materials, accelerated pavementtesting (APT), and vehicle-tyre-road interaction. On all of these topics he has published widely both locally and internationally.

YVETTE VAN RENSBURG (BSc Computer Sciences) is an analyst developer at the CouncilforScientificand Industrial Research (CSIR). Her main work duties cover advanced graphical user interface development including OpenGL for 3D applications, development of pavement design software, database design, data acquisition, embedded software design, and producing technical reports. Software developed include flexible pavement rehabilitation investigation software; software to estimate tyre contact pressure distributions in the longitudinal, lateral and vertical directions; and software developed for mechanistic empirical analysis of multi-layered elastic pavement systems.

PROF JAMES MAINA (PrEng.FSAICE, FSAAE, MSAT) is a pavement engineer and full-time professor of civil engineering at the University of Pretoria. He is also an adjunct professor at Chang'an University and Shandong Jianzhu University in China. He obtained his PhD in 2000 from Miyazaki University in Japan. His professional activities include the development of advanced numerical analysis (modelling) tools for pavement engineering application, characterisation ofthe behaviour of pavement materials, accelerated pavement testing (APT) and quality assurance (QA) in road projects. He lectures both under- and post-graduate classes, and also supervises students fortheir MEng and PhD qualifications atthe University of Pretoria.

