


Services on Demand
Article
 English (pdf)
 Article in xml format
 Article references
Indicators

Related links
-
 Cited by Google
 -
 Similars in Google
Share

 Permalink
Journal of the South African Institution of Civil Engineering
On-line version ISSN 2309-8775
Print version ISSN 1021-2019
J. S. Afr. Inst. Civ. Eng. vol.63 n.2 Midrand Jun. 2021
http://dx.doi.org/10.17159/2309-8775/2021/v63n2a6
TECHNICAL PAPER
Prediction of California Bearing Ratio and compaction characteristics of Transvaal soils from indicator properties
F J Haupt; F Netterberg
ABSTRACT
A preliminary statistical analysis of 914 mostly Transvaal soils of average selected subgrade quality produced useful, highly statistically significant methods for the prediction of the maximum Proctor CBR and the Proctor compaction characteristics, as well as relationships between soaked and unsoaked CBR and between Proctor and MAASHO compaction characteristics. Because of the well-known poor reproducibilty of the CBR, as well as the indicator tests used, it is believed that the accuracy of the prediction methods is better than it appears from the large scatter of results. These methods do not replace CBR testing but supplement it by possibly reducing the number of expensive tests and providing a check on gross errors.
Keywords: CBR, prediction, indicator tests, subgrade, Proctor
INTRODUCTION
The California Bearing Ratio (CBR) is a standard test used in the characterisation of roadbed and many pavement materials, and in some thickness design methods. It is a relatively lengthy, expensive and poorly reproducible test, which requires a large amount of material. This material may have to be transported over large distances in some cases. These factors limit the number of tests that can be carried out economically.
On the other hand, soil is an inherently variable material, and a relatively large number of tests are required for adequate characterisation. Indicator tests such as Atterberg limits, linear shrinkage (LS) and grading are relatively inexpensive and require little material, although they also suffer from reproducibility problems.
If it is accepted that the CBR is the better test, and a reliable way of predicting it from indicator tests can be found, then the cost of pavement design and construction control could be reduced and/or their reliability increased. It is the purpose of this paper to present methods to predict:
■ the maximum soaked CBR at Proctor compaction
■ the Proctor compaction characteristics
■ relationships between soaked and unsoaked CBR
■ Proctor and MAASHO compaction characteristics.
All the proposed relationships were developed from a database of mostly Transvaal subgrade soils.
Unless qualified, the term "soil" is used in this paper in its widest engineering sense, and the term "local soils" to mean southern African soils. The term modified "AASHO" and not "AASHTO" is used because the heavy laboratory compaction effort used in South Africa is the old modified AASHO effort of 2 413 kJ/m3 that is somewhat less than the current heavy AASHTO : T180 effort of 2 695 kJ/m3 and which results in densities that are about 0.5% lower (DoT 1970). The term "modified AASHTO" is therefore incorrect. The term "Transvaal" is used here for convenience to mean the area included by the current provinces of Gauteng, Mpumalanga, Limpopo and North West.
PREVIOUS WORK
It is not the purpose of the paper to review previous attempts to predict the CBR and compaction characteristics, as this has been done locally by Haupt (1980), Stephens (1988, 1990), Netterberg (1994) and Breytenbach et al (2010). However, some discussions of Kleyn's (1955) method for the prediction of the maximum soaked CBR at Proctor compaction from the grading modulus (GM) and plasticity index (PI) is relevant, as the same CBR method was used for the Haupt database described here. This CBR procedure is/was apparently only used in central and southern Africa, including the former Transvaal and Namibia, on centreline survey samples for the determination of the design CBR for cover requirements for new roads. For this purpose, the Transvaal Roads Department (TRD 1978) accepted either the CBR at 93% of modified AASHO (MAASHO maximum dry density (MDD), i.e. compacte at modified optimum moisture content and effort according to the usual methods (DoT 1970; NITRR 1986) or the maximum Proctor CBR. This method of determining cover requirements was apparently later supersede by a catalogue-design method (TRD 1994).
Kleyn offered his method as the "best fit" to the test results on 1 134 samples from road and airport jobs in central and southern Africa, i.e. not as a replacement for the CBR, but as a rough check on it and as a supplement to possibly reducing the number of these expensive, time- and material-consuming tests. He warned that it was only approximate unless correlated for a particular type of material.
RESULTS
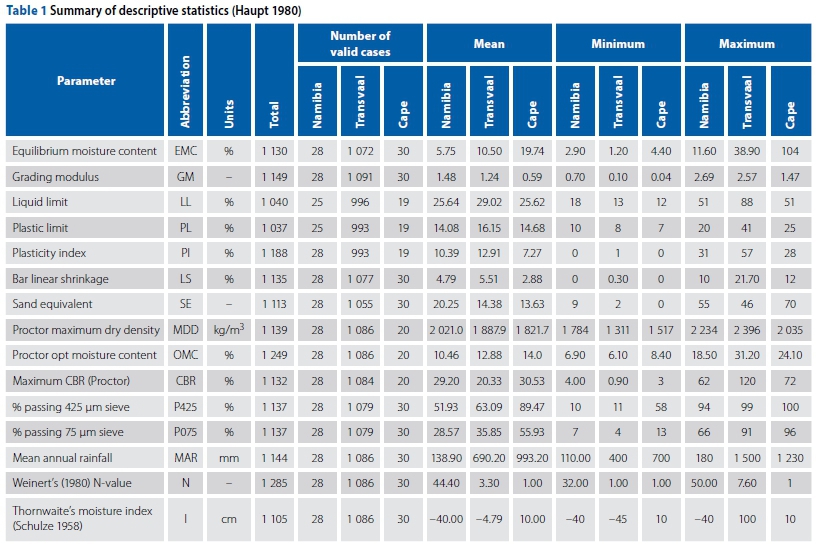
The database essentially consists of test results carried out on 1 084 soil samples from the former Transvaal Province, 28 from Namibia and 20 from the former Cape Province (Haupt 1980), details of which are summarised in Table 1.
The Transvaal soils were tested by several different laboratories, but the others were all tested at the National Institute for Transport and Road Research (NITRR).
As part of an investigation of existing roads in 1973 the former Transvaal Roads Department (TRD) dug a total of 1 102 holes in roads all over the Transvaal and tested the subgrade (Burrow 1975). The results of this survey were then combined with two much smaller but otherwise similar surveys by the authors in 1978 in a very dry area (southern Namibia) (31 sites), and a continuously wet area receiving rain all year round (George-Storms River in the Cape) (29 sites). These two smaller extensions to the Transvaal survey were carried out to test and extend the validity to very dry and very wet areas, because the main purpose of the work was to study moisture and suction in pavements and to develop methods for their prediction (Haupt 1981). This main objective was later extended by Emery (1992). However, a preliminary analysis of the results with a view to developing a method for the prediction of CBR was also carried out.
The number of valid test results used in the analysis depended upon what variables were used as predictors. The lowest number of test results used was 1 037 as shown in Table 1. The mean maximum Proctor CBR of 914 former Transvaal results, for example, was 18 with a standard deviation of 13. The mean GM was 1.24 with a standard deviation of 0.57. The "subgrade" samples tested therefore represented a wide range of materials ranging from G10 (the worst allowable roadbed or subgrade material) to G4 (potential base course) with a mean of G7 (selected subgrade) according to current practice (COLTO 1996, 1998). Of the valid test results used 97% had CBR values between 1 and 50, which means that the relationships reported in this paper should not be applied to CBR values much higher than 50. Only 20 samples had higher CBRs.
LABORATORY TEST METHODS
The test methods used were those of the Department of Transport (DoT 1970) except that, following Kleyn's (1955) approach and normal Transvaal Roads Department (TRD 1973, 1978) practice on centreline and selected subgrade samples, the specimens used for determination of the Proctor MDD and OMC were soaked for four days and the CBR at a penetration of 2.54 mm determined on each. By drawing a graph of soaked CBR against compaction moisture content the maximum CBR at Proctor compaction was determined. The CBR obtained by this method is usually slightly higher than the CBR at Proctor MDD and was said to be more representative of subgrade conditions, to require less material and work, and to be more reproducible on such materials than the usual method requiring accurate moulding at a predetermined moisture content. The soil preparation method used for the grading, Atterberg limits and linear shrinkage was the A-1(a) wet method. These methods do not differ significantly from those in more recent use (NITRR 1986). The grading modulus was defined as the sum of the cumulative percentages retained on the 2.00 mm, 425 μm and 075 μm sieves divided by 100 (Kleyn 1955) or, as actually used to compile the database:
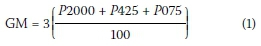
Where
P2000 = cumulative % < 2.00 mm (2000 μm)
P200 = cumulative % < 425 μm
P075 = cumulative % < 075 μm
STATISTICAL ANALYSIS
Methods
The computer program used in these analyses was the then latest (about 1975) version of the Statistical Package for the Social Sciences (SPSS). However, the significance testing was done later by hand calculator.
It is important to note that all the predictors (e.g. PI) used in this analysis suffer from poor reproducibility and thus include implicit errors of measurement. This means that classical regression theory may not strictly be applied to these predictors, because it assumes that predictors are known accurately and with a normal distribution of error. Although this assumption was therefore not always true, there was no readily available statistical theory to treat uncertainties in both the predictor and the predicted. Experience has, however, shown that if the normal regression theory is used in this case, the resultant error is not unacceptably large (personal communication with J J de Jager 1978, CSIR).
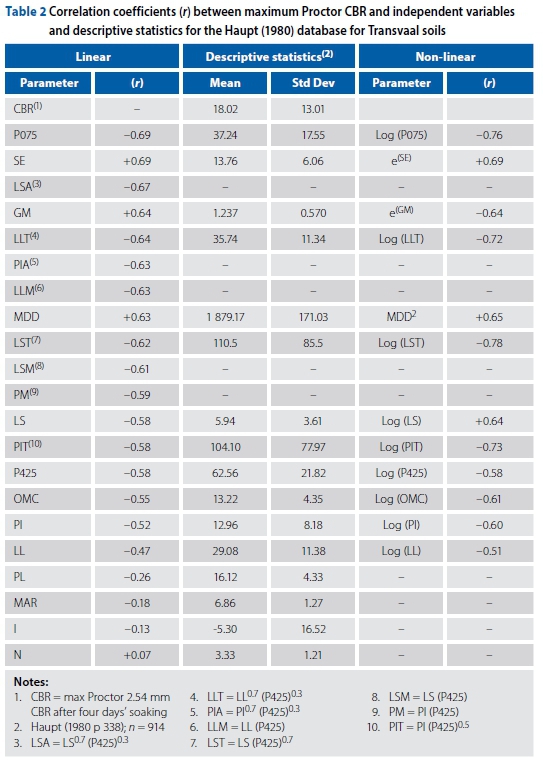
The basic contribution characteristics of each of the variables to be used in the subsequent statistical analysis was first determined. This information on the distribution and central tendencies of the variables provided the necessary information required for the selection of subsequent statistical techniques (Tables 1 and 2).
A multiple stepwise linear regression was performed next. This required the variables to be measured on the interval (distances between categories are defined in terms of fixed and equal units) or ratio (as interval level but with inherently defined zero point) level and that the relationships among the variables are linear and additive. These restrictions are not absolute, however, and nominal variables can be incorporated into the regression using various techniques. They have been incorporated in this analysis and, although they do not strictly satisfy the assumptions of regression, the technique has been successfully applied elsewhere (personal communication with J J de Jager 1978, CSIR). The structure of the data, on the other hand, made it difficult to carry out a statistical test for linearity, but the plots (Haupt 1980) clearly show that not all parameters have linear relationships with the moisture content. Various different functions were used to transform the variables and to optimise the transformations.
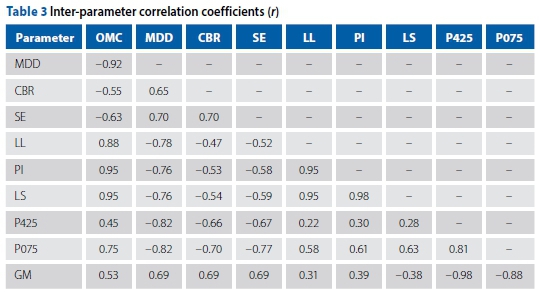
A multivariate stepwise linear regression was then carried out on the results on all 914 samples. From the correlation coefficients between the relevant variables given in Tables 2 and 3, it is apparent that many of the parameters that correlate highly (r > 0.8) with CBR also correlate highly with each other. This implies that, if one of these is used in a regression equation, little improvement in accuracy will result from adding another, since they explain the same variance.
Because the LL, PI and LS are determined on the fraction finer than 425 μm, simple products between these and the P425 and more complex adjustments were determined (Table 2). The adjustments shown are actually those found to correlate best with the equilibrium moisture content in pavements and are not necessarily those which correlate best with CBR. These still have to be found.
The results are expressed in terms of single (r) and multiple (R) correlation coefficients, standard errors of estimate (SEE) and significance level (α). The square of the correlation coefficient explains the proportion of the variance accounted for by the particular relationship. The SEE represents the standard deviation of the actual values around the prediction values and provides an estimate of the prediction accuracy of the particular regression equation.
Prediction of CBR
Table 2 shows that, when analysing the data for linear relationships, the best single parameters were the percentage passing the 075 μm sieve (P075) and the sand equivalent (SE), both with correlation coefficients of -0.69. It is therefore recommended that research on the sand equivalent be carried out with a view to substituting it for the Atterberg limits. The next best was the adjusted linear shrinkage (LSA: r = -0.67) followed by the grading modulus alone (GM: r = 0.64). Of the simple products of a soil constant and the P425 the modified LL (LLM: r = -0.63) was the best, followed by the modified LS (LSM: r = -0.61) and the modified PI (PM: r = -0.59). The LS was the best (r = -0.58) of the common, simple plasticity parameters, followed by the PI (r = -0.52), with the LL being the worst (r = -0.47). This confirms Kleyn's (1955) observation that all attempts to correlate LL with CBR failed.
Although the LL was the worst of the LL, PI and LS, it was the best of the simple products with P425. The correlation coefficient found by Haupt (1980) for the P075 of -0.69 was slightly better than that for GM (+0.64). It is recommended that Kleyn's method should be evaluated against Haupt's database, which contains the correct type of CBR results for Kleyn's method. The preliminary models developed by Haupt (1980) are summarised in Table 4.
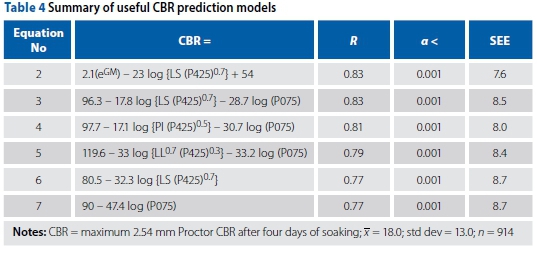
These equations show that, with only grading and LS results, the CBR can be predicted with a correlation coefficient of 0.83 and SEE of about 8 at a significance level better than 0.1%. These equations represent only a preliminary analysis of mostly subgrade materials (i.e. relatively low CBR). They significantly underestimate CBRs above 50 and should not be indiscriminately applied to better quality materials.
It is believed that the general method was sound in that a stepwise multivariate approach of likely factors was used. The transformation and adjustments of LS and P425, etc, reported here are the optima found for the prediction of equilibrium moisture content rather than for CBR. It is, however, likely that something other than a simple product of, for example, LS and P425 would also give the best correlation with CBR. In view of the better correlation coefficient for P075 of -0.69 than for P425 of -0.58 it is recommended that combinations with the former be tried.
Sufficient statistical parameters are reported to calculate characteristic values which in engineering design normally refers to the 95% confidence interval. In this case the 85% confidence interval is reported due to the variability in the predictor values. For example, in Equation 2 with GM = 2.0, LS = 4.5 and P425 = 35 the predicted CBR (PCBR) = 29.6. The min/max characteristic value would be = PCBR ±Z(SEE/ mean)*PCBR where Z = 1.04 at the 85% confidence interval, SEE = 7.6 and mean = 18. Therefore the minimum CBR at the 85% confidence level = 29.6 - 1.04(7.6/18)*29.6 = 16.6, rounded off to 17.
Haupt's six models were investigated by Stephens (1988, 1990) on Natal soils - he found "a very large scatter of results" and rather "minimal agreement with correlated data" for all of them. Comparisons were apparently carried out at 100% MAASHO density for CBR values of less than 50 and at 95% for all values. These were not the maximum CBR (at Proctor compaction) as used by Haupt but were derived graphically from specimens all compacted at MAASHO OMC at different efforts. Plots of Haupt's adjusted or transformed parameters LLT, PIT and LST against CBR were said to have given similar correlation coefficients to Haupt's for dolerites, shales and laterites only. However, as the equivalent untransformed or unadjusted parameters gave equivalent or better correlations in most cases, further work was limited to them.
According to Stephens (1990), Kleyn's method predicted the CBR of Kwazulu-Natal soils most closely at 95% MAASHO.
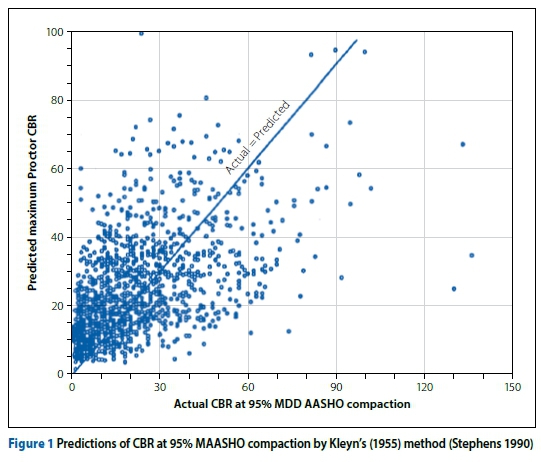
Stephens' (1988, 1990) condemnation of these and some other models appears too summary and too severe. Figure 1, for example, does show a large scatter and his equation for Kleyn's (1955) method (transformed here by the authors as Equation 8) yielded a correlation coefficient (r) of only 0.53 when attempting to predict the 95% MAASHO CBR of 1 418 Natal soils, but significance testing by the authors showed that in view of the large number of results it is highly significant at better than the 0.001 level.
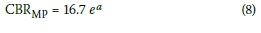
Where
CBRmp = Maximum Proctor CBR
a = (12GM - PI)/18.5
As had been pointed out by Netterberg (1994) and others, much, perhaps most, of the scatter in such predictions is probably due to the well-known poor reproducibility of both the CBR and indicator tests, as well as the different CBR method employed in this case.
Haupt did not provide scattergrams of his models, but the scatter in Figure 1 is probably approximately what would have been expected from the standard error of estimate (SEE) and accuracy given for Equation 2 in Table 4. It can therefore be concluded that Haupt's models (at least Equation 2) are little better than that of Kleyn (1955) insofar as the accuracy of estimate at 95% MAASHO is concerned. Figure 1 also shows that, on average, it is overpredicting the CBR at 95% by about 10%, and an average of 93% may be more appropriate.
It is recommended that Haupt's equations be evaluated against a database containing maximum Proctor CBRs and that various combinations of P425 and P075 with plasticity and shrinkage parameters also be tried. In particular, the use of the simple product of the P425 and the linear shrinkage seems to be the simplest and best (Stephens 1988, 1990) and has been used in local specifications for calcretes for unsealed and sealed roads (e.g. Netterberg 1978, 1982; COLTO 1998) to ensure a minimum CBR.
Models developed by Semmelink (1991) for the prediction of the unsoaked CBR immediately after compaction from the grading, LL, LS, particle shape and factors for density and moisture content (his Models A and F) yielded a r2 of 0.82 and SE of 0.22 for 1 077 "data points". However, none of the eleven regression constants required was provided.
Relationship between Proctor and MAASHO CBR
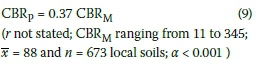
In addition to developing equations for prediction of maximum Proctor CBR, models relating CBR, MDD and OMC at Proctor compaction with those at MAASHO compaction, were also developed. The CBR relationship was:
Where
CBRP = maximum 2.54 mm Proctor soaked CBR
CBRM = maximum 2.54 mm MAASHO soaked CBR
The average ratio of maximum MAASHO CBR to maximum Proctor CBR of 2.7 calculated with Equation 9 is in reasonable agreement with the ratio of 2.5 calculated by the authors from the average factors used by VKE Engineers (A Taute 1986 personal communication in Netterberg 1994) to convert a maximum Proctor CBR (at an assumed 93% MAASHO) to an ordinary (i.e. at 100 %) MAASHO CBR and the average of 2.4 calculated by the authors for MAASHO 93% for ferricretes from Netterberg et al (2003) from work by Davel (1989). For ferricretes this ratio decreased somewhat from 2.6 at a GM of 0.5 and 1.0 to 2.3 at a GM of 2.0 and 2.5. It is therefore recommended that both methods should receive independent checking and that a general method for predicting CBR at any percentage MAASHO compaction be developed.
Relationship between soaked and unsoaked CBR
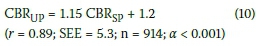
Although Savage (2006, 2012, 2013) proposed a "one-shot" method of estimating MAASHTO or Proctor MDD from a single determination of compacted density and moisture content (instead of the usual 4 or 5) and the particle bulk density and the CBR from a single unsoaked determination on the same specimen, his method cannot be checked against the Haupt database as the latter does not include particle bulk densities. Only two local studies are considered here, those of Haupt (1980) and Emery (1985, 1992). Haupt's (1980) relationship was:
Where
CBRUP = unsoaked (at OMC) maximum CBR at Proctor compaction
CBRSP = four day soaked maximum CBR at Proctor compaction
The effect of moisture content was also evaluated locally by Emery (1985, 1992). He first determined the CBR of six materials ranging in quality from G1 to G10 at moisture contents ranging from about one-quarter of optimum to soaked. MAASHO compaction was used for the G1-G5 and Proctor for the G6-G10 materials. Equations relating the soaked CBR to CBR at various ratios of moisture content to OMC were then developed, as well as one to describe the complete relationship between CBR and moisture content:
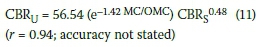
Where
CBRU = unsoaked CBR at any density, at any moisture content less than saturation compacted at MAASHO OMC
OMC = MAASHO OMC
MC = moisture content
CBRS = soaked 2.54 mm MAASHO CBR
A similar model was developed from 245 results from the Burrow (1975) study, converting the in-situ DCP results to laboratory unsoaked CBRs at the field moisture content, the Proctor OMCs to MAASHO using Equation 16 and assuming the field compaction to be equal to Proctor:
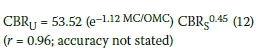
Because this equation was very similar to Equation 11, the two sets were merged and a general equation developed:
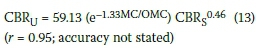
Emery (1985, 1992) then took this as the best model relating to soaked and unsoaked CBR. Whilst this model appears reasonable, in view of all the conversions and assumptions made it is recommended that it should be checked against outside data, against Black's (1962) and Haupt's (1980) model, and at various densities or compactions.
Relationship between Proctor and MAASHO compaction characteristics
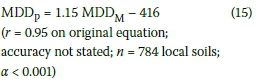
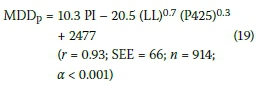
Haupt's (1980) relationship between Proctor and MAASHO MDD was:
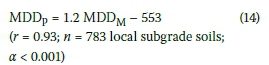
Where
MDDP = Proctor MDD
MDDM = MAASHO MDD
Although it is statistically incorrect to mathematically invert a regression equation, a similar equation to Equation 14 results if this is done to an equation developed by Emery (1985), also from the Burrow (1975) data file:
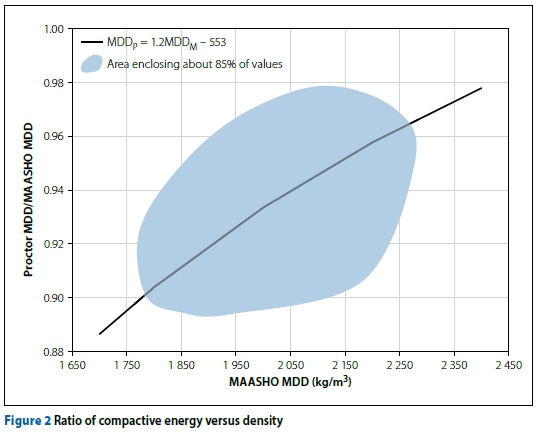
It is clear from published relationships, a scattergram of Haupt's (1980), and borne out by experience, that the ratio of Proctor MDD to MAASHO MDD is not a constant but varies with material type and with MDD. Ratios in the literature vary between 85 and 97% and a scattergram for 783 Transvaal soils shows a variation from 86 to 99%. Figure 2 shows the variation of about 85% of the samples between 90-98% with a very rough average of about 94%, and with a tendency to increase with MDD. This means that the ratio for granular material is significantly higher than for silty/clayey materials.
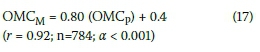
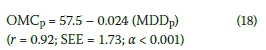
The optimum moisture contents are related as follows (Haupt 1980):
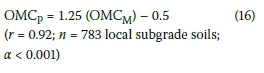
Where
OMCP = Proctor OMC
OMCM = MAASHO OMC
An equation developed by Emery (1985) was:
Haupt (1980) also found a relation between Proctor OMC and Proctor MDD:
Such relationships as these are useful when certain tests such as the wet-dry brushing test must be carried out, but only MAASHO data is available and there is a shortage of material. It is therefore recommended that they receive independent assessment. It is also recommended that they be evaluated on cement- and lime-stabilised materials.
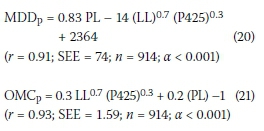
Prediction of compaction characteristics
Only the work of Haupt (1980), Semmelink (1991) and Allison and Webb (2002) will briefly be considered here as they appear to be the only local work on the subject. Haupt's (1980) best prediction equations were:
Semmelink's (1991) prediction equation (his Equation 2) utilised a grading factor (GF), P425, LL and LS:
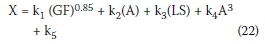
Where
X = MDD (vibratory, in % AD), or MDD (MAASHO, in % AD) or OMC (MAASHO, in %)
AD = ARD χ 1000
A = (P425/100)(LL/100)0.1
GF = (% passing sieve size / nominal sieve size in mm) / 100 for sieve sizes 75, 63, 53, 37.5, 26.5, 19, 13.2, 4.75 and 2.00 mm
Pn = nominal sieve size in mm
kn = regression constant (values not provided by Semmelink)
Although Semmelink presented plots showing close agreement between 21 predicted and measured MAASHO MDDs and OMCs with r2 of 0.90 and 0.91 respectively, he did not provide the regression constants required to use his model.
A linear regression analysis of the test results on 5 405 samples of KwaZulu-Natal soils, derived from a variety of geological formations by Allinson and Webb (2002), resulted in correlation coefficients of only -0.24 through 0.11 to 0.46 for MAASHO OMC against PI, PM, LL, LLM, plastic limit (PL), GM and Semmelink's (1991) GF, which were mostly much lower than those found by Haupt (1980), as shown in Tables 2 and 3. A multiple regression analysis using Semmelink's (1991) Equation 2 (our Equation 22) only yielded a r = 0.44, although all the relationships found were highly significant. A preliminary consideration according to the geological origin yielded little or no improvement - and in some cases was weaker. They concluded that it was not feasible to predict accurately individual OMC, MDD or CBR from indicators, but only the average OMC and MDD for estimation purposes.
Haupt (1980) also produced a convenient chart relating Proctor compaction characteristics to PL, LL and OMC from Equations 20 and 21 (Figure 3). It is recommended that these relationships be evaluated against other data sets, and that a chart also be developed to predict MAASHO compaction characteristics.
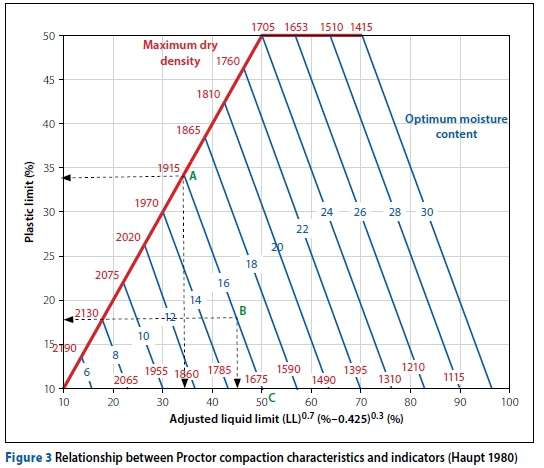
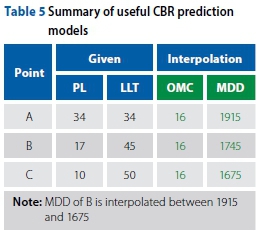
These convenient relationships between LLT, PL OMC and OMC enable one to estimate any two if the other two are available by simple interpolation. Normally the cheaper Atterberg and grading parameters would be available. Table 5 shows typical interpolation results.
Evaluation against KwaZulu-Natal soils
A later study by Stephens (1988, 1992a, 1992b) involved the analysis of the results of tests on 1 421 Kwazulu-Natal soils from the archives of the Kwazulu-Natal Roads Department (KZNRD). A wide range of geological material origins and engineering qualities was represented, ranging from soil unsuitable as roadbed to potential base course, with an average quality of G7. The average quality was therefore the same as that of Haupt (1980 Tables 1 and 2); only the GM was slightly lower (1.09 against 1.24). The soil origins in these two databases are probably also broadly similar, although the Transvaal soils most likely included some calcretes and no tillites, whilst the Berea Red soils in KwaZulu-Natal are arguably similar to many Transvaal red sandy soils. The laboratory test methods (except for the maximum Proctor CBR used in the Transvaal) were nominally the same. However, the soil preparation method may have differed, as the KZNRD changed from the DoT (1970) wet boiling method A1(a) to the A1(b) dry method in about 1970 (personal communication with R E Ashworth 2003, KZNRD).
Little correlation was found between CBR and GI, GM and PI or Haupt's (1980) transformed or adjusted plasticity and shrinkage parameters. In fact, it was stated that the simple product was as good, or better than the transformed or adjusted parameters. Similar plots to that found for shrinkage modulus (LSM) were also found for the product of LL or PI and P425 or P075. The correlation coefficient for MAASHO CBR and LSM was found to be -0.38 to -0.62 depending on the geological material. However, the shrinkage was preferred because it was usually available even when the PI was not. No improvement was obtained with the product of the LS and P075. No bivariate or multivariate effects were found in the relationships between CBR and swell, modified plasticity index PM = (Pix P0425) and plasticity product PP = (PIxP075). No improvement was obtained in plots of CBR against swell and shrinkage modulus when they were restricted to G5-G7 materials.
The best correlation coefficients found were for logarithmic functions such as log(CBR) versus log(PM) (r = +0.67 for laterites), but simpler relationships such as with GM alone, e.g. +0.67 for 79 laterites and 0.62 for 133 dolerites, and P425 alone (-0.66 for the laterites and -0.62 for the dolerites) were almost as good. By contrast, for 212 sandstones, for GM alone it was only +0.28, log(CBR) versus log(PM) only -0.45 and none was found for P425, illustrating the importance of geological material as implied by Kleyn (1955).
Unfortunately, although it was recorded and entered in the Transvaal database, the geological origin of the material was not considered in the preliminary analysis reported in this paper.
DISCUSSION
From Table 2 it is clear why most of the existing models relating CBR to other soil parameters are non-linear. Non-linear and logarithmic or exponential models explain significantly more variance than linear models. It is also interesting to note that the CBR correlates significantly better with grading parameters (especially P075) and GM and SE than with plasticity or compaction parameters, and better with the SE than the PI.
The reasons why a method developed by one worker on a particular set of results fails when tested by another on a different set probably include the well-known poor repeatability and reproducibility of both the CBR and the indicator test methods, the many laboratories inevitably used to accumulate a large database, differences in both the indicator (e.g. wet or dry and drying temperature) and CBR (e.g. crushing in all or only some oversize, scalping at 20 or 37.5 mm) preparation and grading (e.g. wet or dry) methods, whether, as pointed out by Semmelink (1991), the grading used was that before or after compaction, the type of CBR (at OMC or maximum, soaked or unsoaked, and whether at 2.5 or 5.0 mm penetration) and the problem of accurately splitting and preparing a 200 kg sample in several bags to the 50 g used for the plasticity tests. All these differences are in use in southern Africa and can significantly affect the results (Pinard & Netterberg 2012).
The test methods used on Kleyn's (1955) South African samples were probably those of the DoT (1948), some of which differ from those of NITRR (1986).
Indicator tests do not of course include factors such as the particle shape and surface roughness, and the use of the GM, P425 or P075, or even Semmelink's GF do not describe the actual grading, all of which can be expected to affect the CBR. It is also clear that, as Kleyn (1955) intended, his - or as is now clear - any other method should be calibrated on the job for the particular materials used, which would also only usually involve a single laboratory and perhaps operator. Although Stephens (1990) found a correlation coefficient of only 0.53 for his equation for Kleyn's method, it was nevertheless found by the authors to be highly significant at better than the 0.001 level.
The most recent comprehensive study using a large database of results from all over South Africa and Namibia (Breytenbach et al 2010), in which a large number of models were tried, including those of Kleyn (1955) and Haupt (1980) - although apparently not that of Semmelink (1991) - involving 28 equations for each of nearly 60 data sets, including over 130 regressions both linear and Weibull, failed to provide a single accurate model. At best some could be used only as preliminary indicators and not as substitutes for CBR tests. Grouping according to geological material origin was also not effective. The "high variability" in both the CBR and indicator results was suggested as a possible reason for the poor predictability.
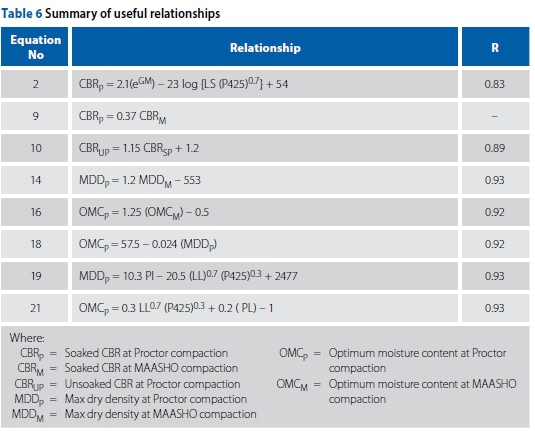
The most accurate relationships based on the Haupt study are summarised in Table 6.
CONCLUSIONS
■ Useful methods for the prediction of the maximum Proctor CBR and the Proctor compaction characteristics from the grading and indicator properties were found, as well as relationships between soaked and unsoaked CBR, and between Proctor and MAASHO compaction characteristics.
■ The high correlation coefficients are all statistically highly significant and indicate that the relationships found are real and valid, at least over the range of the database values reported.
■ The relatively large errors of prediction are due to the well-known poor repro-ducibility of both the predicted CBR and compaction characteristics, as well as the indicator tests, the several laboratories involved, and the large number and variety of soils.
■ The prediction error for a single laboratory on a single source of material should be better researched.
■ As this was only a preliminary attempt, scope probably exists for further improvements to be made.
■ Prediction methods do not replace the CBR but supplement it by permitting a reduction in the number of these relatively expensive tests, by providing a check on gross errors, and by providing a means of estimating a statistically minimum CBR. Any prediction method should be checked on site, and calibrated, if necessary, on the materials used - as originally advised by Kleyn (1955).
RECOMMENDATIONS
■ More research on the sand equivalent should be carried out with a view to substituting it for the Atterberg limits, as it correlated better with CBR than the Atterberg limits.
■ The Kleyn method should be assessed against Haupt's database to verify the low correlation coefficient between CBR and GM and PI, as reported by Stephens (1990).
■ The transformations of CBR with P075 should be developed, despite the fact that the transformations of LS and P425 reported here show higher correlations, as the latter are optima-developed for the prediction of equilibrium moisture content rather than CBR. P075 correlates better with CBR than P425, and such transformations may result in more accurate prediction.
■ Haupt's equations should be assessed against a database containing maximum Proctor CBRs, and various combinations of P425 and P075 with plasticity and shrinkage parameters should also be tried. In particular, the use of the simple product of the P425 and the linear shrinkage seems to be the best.
■ Emery's (1992) best model relating soaked and unsoaked CBR should be assessed against outside data, against Black's (1962) and Haupt's (1980) models, and at various densities or compactions.
■ The relationships between OMC at various compactive efforts reported in this paper should be assessed independently and extended to include cement- and lime-stabilised materials.
■ As the ratio of maximum MAASHO CBR to maximum Proctor CBR reported here is in reasonable agreement with that reported by Netterberg (1994), it is recommended that both methods be independently assessed and that a general method for predicting CBR at any percentage MAASHO compaction be developed.
■ Savage's (2006, 2012, 2013) "one-shot" methods deserve further evaluation.
ACKNOWLEDGEMENTS
This paper is based on an MSc (Eng) thesis submitted to the University of the Witwatersrand by author F J Haupt under the supervision of Prof G E Blight and Dr F Netterberg. Both authors of this paper were employed at the then National Institute for Transport and Road Research of the CSIR, Pretoria, whilst the work was undertaken. The permission of the Director to use the work as a thesis, and the cooperation of the Transvaal Roads Department in making their test results available, are acknowledged with thanks.
REFERENCES
Allinson, A J & Webb, D L 2002. A study of the factors influencing the relationship between index properties and optimum moisture content and the formulation of an abbreviated test method for determining maximum dry density. Proceedings, 9th Congress of the International Association of Engineering Geology and the Environment, Durban, pp 168-175. [ Links ]
Black, W P M 1962. A method of estimating the California Bearing Ratio of cohesive soils from plasticity data. Geotechnique, 12(4): 271-282. [ Links ]
Breytenbach, I J, Paige-Green, P & Van Rooy, J L 2010. The relationship between index testing and California Bearing Ratio values for natural road construction materials in South Africa. Journal of the South African Institution of Civil Engineering, 52(2): 65-69. [ Links ]
Burrow, J C 1975. Investigation of existing road pavements in the Transvaal. Report L1/75, Pretoria: Transvaal Roads Department. [ Links ]
COLTO (Committee of Land Transport Officials) 1996. Draft TRH 4: Structural Design of Flexible Pavements for Interurban and Rural Roads. Pretoria: COLTO, Department of Transport. [ Links ]
COLTO 1998. Standard Specifications for Road and Bridge Works for State Road Authorities. Yeoville: South African Institution of Civil Engineering. [ Links ]
Davel, J S 1989. 'n Statistieke analise van ferrikreet as padboumateriaal in die voorspelling van KDV-waardes uit die graderingsmodulus. BSc Hons. (Eng) Thesis. Johannesburg: Rand Afrikaans University. [ Links ]
DoT (Department of Transport) 1948. Standard Methods of Testing Materials and Specifications. Pretoria: DoT. [ Links ]
DoT 1970. Standard Methods of Testing Materials. Pretoria: DoT. [ Links ]
Emery, S J 1985. Prediction of moisture content for use in pavement design. PhD Thesis. Johannesburg: University of the Witwatersrand. [ Links ]
Emery, S J 1992. The prediction of moisture content in untreated pavement layers and an application to design in southern Africa. CSIR Research Report 644, Pretoria: CSIR. [ Links ]
Haupt, F J 1980. Moisture conditions associated with pavements in southern Africa. MSc (Eng) Thesis. Johannesburg: University of the Witwatersrand. [ Links ]
Haupt, F J 1981. Prediction of subgrade moisture conditions. Proceedings, 10th International Conference on Soil Mechanics and Foundation Engineering, Stockholm, 1, Session 1, Paper 25, pp 149-156. [ Links ]
Kleyn, S A 1955. Possible developments in pavement foundation design. Transactions of the South African Institution of Civil Engineers, 5(12): 286-292. [ Links ]
Netterberg, F 1978. Calcrete wearing courses for unpaved roads. Civil Engineer in South Africa, 20(6): 129-138. [ Links ]
Netterberg, F 1982. Behaviour of calcretes as flexible pavement materials in southern Africa. Proceedings, 11th ARRB Conference, Melbourne, Australia, 11(3): 60-69. [ Links ]
Netterberg, F 1994. Prediction of CBR from indicators: A review. Report RR90/275. Pretoria: Department of Transport. [ Links ]
Netterberg, F, Davel, J S & Kruger, D 2003. Statistical analysis of laboratory test results on South African ferricrete as roadbuilding materials. Proceedings, 13th Regional Conference for Africa on Geotechnical Engineering, Marrakech, pp 591-595. [ Links ]
NITRR (National Institute for Transport and Road Research, CSIR) 1986. TMH 1. Standard Methods of Testing Road Construction Materials, 2nd ed. Pretoria: NITRR, CSIR. [ Links ]
Pinard, M I & Netterberg, F 2012. Comparison of test methods and implications on materials selection for road construction. Proceedings , 2nd African Community Access Programme (AFCAP 2) Conference, 3-5 July 2012, Maputo. [ Links ]
Savage, P F 2006. Insights into pavement material density and strength. Proceedings, 25th Southern African Transport Convention, 10-13 July 2006, Pretoria. [ Links ]
Savage, P F 2012. Towards a better understanding of the moisture-density-strength relationship of compacted soil. Proceedings, 31st Southern African Transport Convention, 9-12 July 2012, Pretoria. [ Links ]
Savage, P F 2013. A rapid assessment of soil strength parameters. Proceedings, 32nd Southern African Transport Convention, 8-11 July 2013, Pretoria. [ Links ]
Schulze, B R 1958. The climate of South Africa according to Thornthwaite's rational classification. South African Geography Journal, 40: 31-53. [ Links ]
Semmelink, C J 1991. Factors influencing the compactability and bearing capacity of untreated roadbuilding materials. Proceedings, 10th Regional Conference for Africa on Soil Mechanics and Foundation Engineering, Maseru, pp 185-192. [ Links ]
Stephens, D J 1988. The variation of the California Bearing Ratio with standard classification parameters for a selection of Natal soils. MEng Dissertation. Durban: University of Durban-Westville. [ Links ]
Stephens, D J 1990. The Prediction of the California Bearing Ratio. Civil Engineer in South Africa, 32(12): 523-527. [ Links ]
Stephens, D J 1992a. Variation of the California Bearing Ratio in some synthetic clayey soils. Civil Engineer in South Africa, 34(11): 379-380. [ Links ]
Stephens, D J 1992b. The use of a modified liquid limit for swell prediction. Civil Engineer in South Africa, 34(12): 405-406. [ Links ]
TRD (Transvaal Roads Department) 1973. Manual L1/73. Materiaalhandleiding [in Afrikaans]. Pretoria: TRD Materials Laborator y. [ Links ]
TRD 1978. TRD Manual L1/78. Pavement and Materials Design Manual. Pretoria: TRD. [ Links ]
TRD 1994. Manual L 4/94. Materials Investigation and Pavement Design Manual. Pretoria: TRD Directorate Materials Branch. [ Links ]
Weinert, H H 1980. The Natural Road Construction Materials of Southern Africa. Cape Town: H & R Academica. [ Links ]
 Correspondence:
F J Haupt
Private Bag 7 Box 331, Hermanus 7200 South Africa
T: +27 84 500 3111 E: frnkhpt@gmail.com
F Netterberg
79 Charles Jackson Street, Weavind Park, Pretoria 0184, South Africa
T: +27 12 846 7051, E: frank.netterberg@gmail.com

FRANK J HAUPT (Pr Eng, Pr CPM, MSAICE) started his career at the CSIR (Council for Scientific and Industrial Research) in 1976 and joined the consulting engineering fraternity in 1982 as design engineer at a well-known consultancy. He co-founded a consultancy in 1984 where he worked as managing director until he sold it and retired in 2019. He managed the civil infrastructure department of the consultancy with special reference to roads and drainage. He obtained an MSc in Civil Engineering from the University of the Witwatersrand in 1980.

DR FRANK NETTERBERG (PrSciNat, C Eng, FSAICE, FICE, FSAIEG, HMAEG), who has a BSc Hons and PhD in Engineering Geology, is an independent researcher and specialist consultant on pavement materials and geotechnics and has over 50 years' experience. His interests include marginal materials such as pedocretes, weathered rocks, mining wastes and Kalahari sands, soluble salt damage to pavements and the use of saline materials and waters, soil stabilisation, long-term road experiments, active clay and collapsing sand roadbeds, and the problems of the dry macroclimate in general.

