


Services on Demand
Article
 English (pdf)
 Article in xml format
 Article references
Indicators

Related links
-
 Cited by Google
 -
 Similars in Google
Share

 Permalink
Journal of the South African Institution of Civil Engineering
On-line version ISSN 2309-8775
Print version ISSN 1021-2019
J. S. Afr. Inst. Civ. Eng. vol.63 n.2 Midrand Jun. 2021
http://dx.doi.org/10.17159/2309-8775/2021/v63n2a4
TECHNICAL PAPER
A critical review of the Water Sorptivity Index (WSI) parameter for potential durability assessment: Can WSI be considered in isolation of porosity?
A J Moore; A T Bakera; M G Alexander
ABSTRACT
The Durability Index (DI) approach used in South Africa is linked to transport-related properties of the cover layer of concrete. This performance-based approach utilises three different durability-related parameters, namely Water Sorptivity Index (WSI), Oxygen Permeability Index (OPI) and Chloride Conductivity Index (CCI). In the water sorptivity test, both the sorptivity and the water-penetrable porosity of the concrete are measured. Until now, porosity has not been considered directly as a separate durability-related parameter. This paper analyses these implications and suggests that porosity should be adopted as a further index. The paper concludes that sorptivity cannot be interpreted without also reflecting the porosity value since these two parameters are inter-related.
Keywords: concrete durability, durability index, water sorptivity, porosity, absorption
INTRODUCTION AND BACKGROUND
After water, concrete is the most used material on earth, with over 25 billion tons being produced worldwide annually (World Business Council for Sustainable Development 2009). However, the premature deterioration of concrete structures is of increasing concern around the world. In developing countries such as South Africa, the excessive cost of repairing and rehabilitating concrete infrastructure is detrimental to the needs of other sectors of the economy. Resources that could be directed towards urgently needed new construction are diverted to the cost of repairing existing infrastructure. These resources could also be better spent on education and developing additional infrastructure. Therefore, it is essential that ways be found to ensure that concrete structures are constructed in the most durable way possible. To respond to this challenge, researchers are developing new approaches and tools to address durability problems. A powerful new set of tools involves "durability indicators", or "durability indexes (DIs)" which are linked with the preferred performance-based approach to durability design and specification. These DIs are discussed later (Alexander et al 2008).
It seems self-evident that measurement of suitable parameters is essential to the achievement of durability, but the difficulty has been the lack of appropriate durability-related tests and parameters that can be applied, especially on as-built structures. DIs help to fulfil this requirement. Two other critical aspects in the selection of suitable durability index parameters are the purpose for which the durability parameters are measured, and the ease and speed of measurement so that they can be used as rapid indicators of quality in quality control schemes. It is this combination of purpose and ease and speed of measurement that dictates whether a parameter can be used as a durability indicator.
Importance of durability design and assessment
Durability design is integral to structural design. However, durability design needs to be emphasised during the design process to ensure that concrete structures are designed for longevity. Durability is defined as the ability of a material or structure to withstand the service conditions for which it was designed, without undue deterioration (Alexander & Beushausen 2019). As indicated, many concrete structures are showing inadequate durability, implying that the objectives of "durability design" have not been particularly successful. To help remedy the premature deterioration problem, "potential durability" of the concrete needs to be assessed and specified. Potential durability is taken here to mean the ability of the concrete delivered to, or mixed on, the job site to be durable in the structure for which it is intended, under the given exposure conditions.
Many of the deterioration processes that render reinforced concrete structures vulnerable are concerned with the quality and depth of the concrete cover to the reinforcing steel. Potential durability relates to the quality of the cover layer (which is a complex product of the concrete constituents and proportions) and site construction processes, including protection and curing immediately post-construction. These all have a direct influence on the rate of ingress of deleterious substances into the concrete. Cover quality, with a direct impact on potential durability, can be accomplished by ensuring that appropriate materials are selected for the given environment at the design phase, and that construction processes such as compaction and curing are correctly carried out.
Prescriptive versus performance approach to durability design and specification
Traditionally, durability design and specification were achieved by applying prescriptive approaches, in which construction materials and other constraints (e.g. water/binder ratio, concrete cover, and grade of concrete) were adjusted to suit the environmental exposure class. However, this approach is now much criticised as it does not consider (a) the ability to measure actual potential durability "resistance", and (b) the effects of the construction processes which affect durability, mainly curing and compaction. Further, modern concrete-making materials, specifically binders and admixtures, can no longer be regarded as "simplistic" and need a more sophisticated approach to characterise and use them properly. Therefore, performance-based approaches, which must require the quality of the as-built structure to be assessed to be truly performance-based, are crucial in achieving durable structures. The cover zone of the as-built structure needs to be tested to reflect the penetrability and thus potential durability of the concrete. While the composition of the constituent materials and mix proportions are important, ultimately, it is equally important to quantify in situ performance (Alexander & Beushausen 2019).
Quantification of durability
From the above, it follows that the best durability strategies for reinforced concrete structures will be those that seek to improve the quality of the cover concrete. This quality must be appropriately measured, during construction, as well as the actual cover depth achieved, thus quantifying potential durability. Potential durability, as defined above, is readily quantified by means of durability indexes. This concept can be taken further by linking it to service-life models (Mackechnie & Alexander 2002) which can then be used to predict deterioration of a structure. Durability should be quantified by considering indexes that represent the transport properties of concrete, while also considering the aggressiveness of the exposure environment. This latter point is very important, since it was observed by Moore (2014) that reinforced concrete structures in the marine environment, of the same quality concrete, had higher rates of corrosion in the splash zone, when compared with the tidal zone.
DURABILITY INDEX APPROACH
The durability index approach has been developed in South Africa (SA) over recent decades (Alexander et al 2018, 2008, 1999; Mackechnie & Alexander 2002). The SA durability indexes are measurable durability parameters and serve as "indexes" of the potential durability of the material or structure. They characterise the key material properties that govern the durability issues of concern. Although being measured in the short-term (typically 28 days), research has shown that they can be used as indicators of the likely durability performance of the structure in the long-term (Alexander & Beushausen 2019).
As discussed, the indexes reflect the potential durability of the concrete. This can be affected if concrete is cast and cured under laboratory conditions, in which case the indexes generally (but not always) represent concrete quality that is superior to both as-delivered quality, and as-built quality, with the latter reflecting the influence of construction practices. Thus, it is possible to assess whether the concrete can be expected to be durable under "ideal" conditions, as well as actual concrete under site conditions. Since site conditions are never "ideal", allowance must be made in design for exposure conditions and construction effects.
Brief description of Durability Index tests
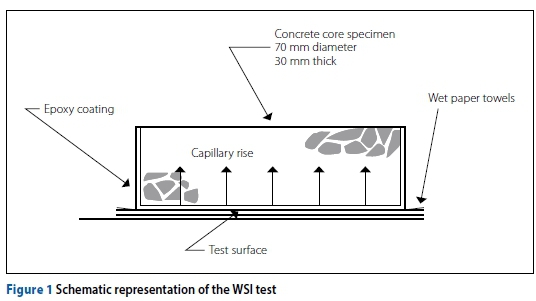
The South African DI tests consist of three tests, namely, Oxygen Permeability Index (OPI), Chloride Conductivity Index (CCI) and Water Sorptivity Index (WSI) tests. These tests have been discussed in literature and are briefly described here (Alexander et al 2018, 2008, 1999; Mackechnie & Alexander 2002). All the tests are conducted on "standard" 70 mm diameter, 30 mm thick specimens. The specimens are pre-conditioned by oven-drying and, for the CCI test, also by pre-saturation with chloride solution.
The OPI test measures the pressure decay of oxygen passed through a standard specimen in a falling head permeameter, the index being defined as the negative log of the coefficient of permeability. Common OPI values range from 8.5 to 10.5 (on a log scale), a higher value indicating a higher impermeability and thus a concrete of potentially higher quality. Using this approach, carbonation depths may be predicted for different environments (Salvoldi et al 2015).
The CCI test measures the instantaneous electrical current due to the flux of chloride ions through a standard specimen, pre-saturated in 5 M sodium chloride (NaCl) solution, in a two-cell conduction rig in which both sides of the specimen are exposed to the NaCl solution. The chloride conductivity index (CCI) is related to the chloride diffusion properties of the concrete.
Finally, the WSI test measures the rate of movement of a wetting front through concrete under capillary suction. A schematic presentation of the test setup is given in Figure 1 - the lower the WSI value, the better the potential durability of the concrete. This index is particularly sensitive to the near-surface properties of concrete and is, thus, a good indication of the type and effectiveness of curing. As the final step in the test, the water-penetrable porosity is measured under vacuum. The WSI parameter is in effect the rate of mass change from water uptake by absorption, divided (or "normalised") by the water-penetrable porosity of the specimen. This has implications for the resulting sorptivity values, which will be explored later.
These tests are useful since they are rapid and can be conducted typically at 28 days after construction, allowing an early age evaluation of potential durability (Alexander et al 2008). Since the original implementation of the tests, they have been improved and updated (Mukadam et al 2016; Otieno & Alexander 2015).
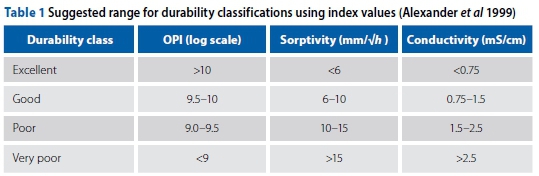
Matrix of DI values
The durability indexes have been placed in a matrix of values which can be used to evaluate the potential durability of concrete structures at an early age (see Table 1). The table is qualitative and therefore has limitations in its applications since the level of acceptable "performance" must be considered in relation to the exposure conditions and service environment of the structure. Table 1 can be viewed as overly simplistic because it does not directly consider the latter two factors; for this reason more sophisticated specifications have been developed by the South African National Roads Agency Limited (SANRAL) that take these into account explicitly (but beyond the scope of this paper) (SANRAL 2009).
Durability studies must also address the relation of indexes to fundamental concrete properties and microstructure. The work presented in this paper attempts such by considering the specific durability properties of sorptivity and porosity, and how these are related in terms of potential durability.
SORPTIVITY VERSUS POROSITY
In the WSI test, both the sorptivity and the water-penetrable porosity of the concrete are measured. The sorptivity value is effectively the rate of mass gain (g/Vh) "normalised" by the porosity of the concrete. The index is expressed as a rate of penetration depth of a wetting front into the concrete, typically in mm/Vh, and not purely as the rate of mass uptake. For deterioration mechanisms such as reinforcement corrosion, the rate at which fluids approach embedded reinforcing bars is critical in evaluating the expected service life. Generally, concrete sorptivity is governed by a square root of time law, with the relevant expressions given in Equations 1 and 2:
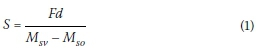
where S (mm/Vh) is sorptivity; F (g/Vh is defined in Equation 2; Msv(g) is the saturated mass of the specimen; Mso(g) is the dry mass of the specimen; and d (mm) is the thickness of the specimen.
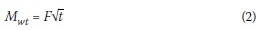
where Mwt(grams) is the mass of the sample, and F is the slope of the best fit line from plotting Mwtagainst the square root of time t; t being the time (typically in hours) after a specimen is first exposed to water on its wetting face.
The denominator term (Msv - Mso) in Equation 1 is a proxy for porosity (Nilsson 2003) and thus Equation 1 normalises the measured rate of mass gain "F" by a porosity-related term, to give the sorptivity S. Porosity n (in percentage) is defined in Equation 3:
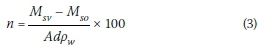
where Msv, Msoand d are defined above, A is the cross-sectional area of the specimen, and pwis the density of water. [Note that the term (Msv - Mso) appears in the numerator in Equation 3, and in the denominator in Equation 1; it is in this sense that the sorptivity can be thought of as the rate of mass gain "normalised" by the porosity.]
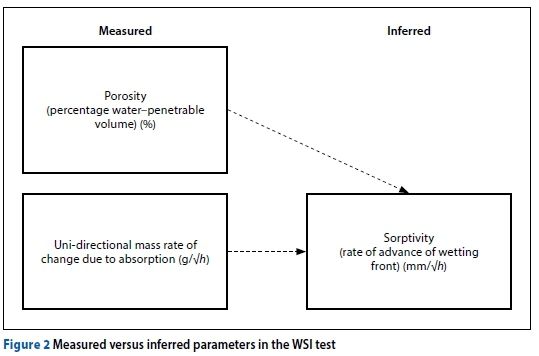
In fact, water-penetrable porosity is the fundamental material parameter that is measured in the WSI test, not sorptivity. Porosity is a complex parameter that encompasses pore volume, pore interconnectivity, pore tortuosity, and pore path length. In the test it is assumed that all pore volumes that are penetrable by water are filled, giving a mass change that can be converted into a percentage volume of the specimen. This, together with the measured rate of mass change due to water absorption, gives the sorptivity. This is illustrated schematically in Figure 2, where the measured values are distinguished from the inferred value of sorptivity.
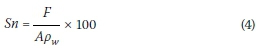
Combining Equations 1 and 3 results in Equation 4, which indicates that sorptivity and porosity are related, showing that two specimens with the same measured rate of mass gain can have different sorptivity values if their porosities differ, and vice versa.
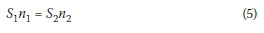
For two different concretes (subscript 1 and 2) with the same rate of mass change, the term- 100 is constant, indicating that the products of their sorptivity and porosity values are equal (see Equation 5).
It is the inter-relation between these two durability index parameters that is of interest here, with the question of whether both parameters should be considered in durability assessments, and if so, what relative importance should be given to each.
Porosity as a separate durability indicator
Other sorption-type tests, e.g. ASTM C1585-13 (ASTM 2013), are based on absorption only (amount of water absorbed over the surface area), which might be considered of limited value. For example, for concrete with high porosity, high absorption may relate to low penetration depth and potentially acceptable penetrability properties (i.e. low depth of ingress during a wetting cycle). However, such a measure does not account for the possibility that a lot of fluid might be absorbed into the surface of the concrete, and, if contaminated (e.g. by chlorides), may result in high contaminant concentrations at the surface, resulting in low durability (e.g. from diffusion of chlorides). Thus, a measure of porosity, representing the volume of accessible pores in the cover zone of concrete, is needed as well.
Until now, porosity has not been considered directly as a separate durability parameter amid the suite of DI parameters. However, sorptivity and porosity are inversely related (Equation 4), and in laboratory measurements it has been noticed that there can be high or low values of sorptivity associated with high or low values of porosity, and vice versa. This brings into question whether porosity should be considered in conjunction with sorptivity as a durability parameter, and therefore also the issue of what the acceptable values of these two parameters in combination should be. This issue needs to be addressed, so that durability tests are fully understood, and to improve predictions of concrete performance.
This paper analyses the implications of the above and suggests that porosity should be adopted as an index; importantly, the paper recommends that sorptivity cannot be interpreted in the absence of porosity since these two parameters are related and their interpretation regarding deterioration mechanisms needs to consider both parameters.
OBJECTIVE OF THIS PAPER
The objective of this paper is, therefore, to explore differing values of porosity for the same sorptivity, based on extensive previous experimental results, and what implications this might have for the potential durability of concrete. However, at this stage, potential durability has not been quantified by way of any service-life model, since porosity is also important in service-life predictions, implying that a matrix of suitable values would have to be determined and provided.
METHODOLOGY
For examining the sorptivity-porosity relationship, data was utilised from our available laboratory database, in which sorptivity and porosity values for various specimens had been evaluated over an extended period. A total of 601 data points, obtained from different specimens from 2009 to 2015, tested as per Alexander et al (2018), were collated and analysed. Each data point consisted of sorptivity and porosity for a given specimen. A limiting factor of this data was that, sometimes, details of the concrete mixes were missing. Information such as the compressive strength, w/c ratio and binder type would have been useful in making other inferences.
As shown in Equations 1 and 2, in the absence of data on the rate of mass change, it is possible to obtain this parameter from the sorptivity, knowing the porosity (in effect the term (Msv - Mso)). As some information sources that were analysed did not have the rate of change of mass recorded, the values were determined indirectly as indicated.
It was important to establish the rate of change of mass F of the different data points so that a comparison could be made between sorptivity and porosity for the same rate of mass change. The rate of mass change is also useful in establishing concrete durability. It stands to reason that a concrete with a higher rate of mass change should have a lower durability potential, because a higher rate means that more water (and therefore potentially harmful substances) may enter the concrete. This increases the probability of corrosion or other deterioration occurring.
RESULTS AND ANALYSIS
Inter-relationship of sorptivity and porosity
The sorptivity and porosity values from 601 data points recorded in previous research were plotted on a scatter plot (Figure 3).
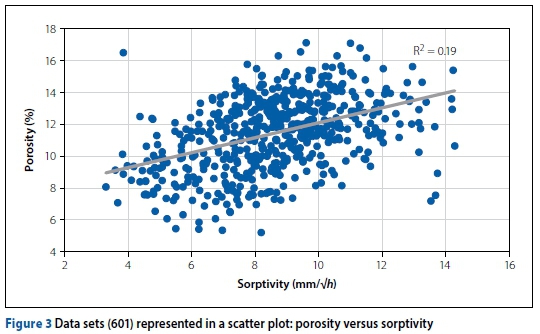
Once the outliers were removed from the data, the correlation coefficient (R2) between sorptivity and porosity was evaluated as 0.19. As the data set is large and consists of specimens of different mix designs and constituent materials, this is to be expected. However, a general trend is observed: higher sorptivity values tend to have higher porosity values. This might be somewhat surprising, considering the earlier argument on the expected inverse relationship between these two parameters. However, it is also possible to have high sorptivity and corresponding high porosity values if the pores are highly interconnected and small in size. This is largely a consequence of taking diverse data and combining them into a single data set. As will be shown, in general, sorptivity and porosity tend to be inversely related.
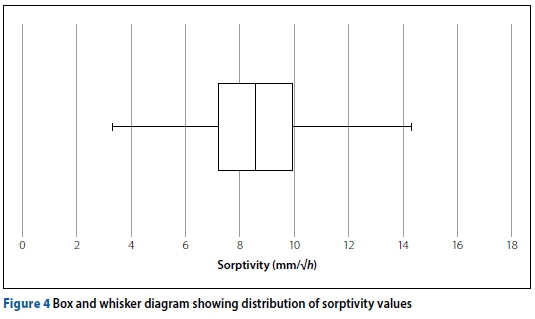
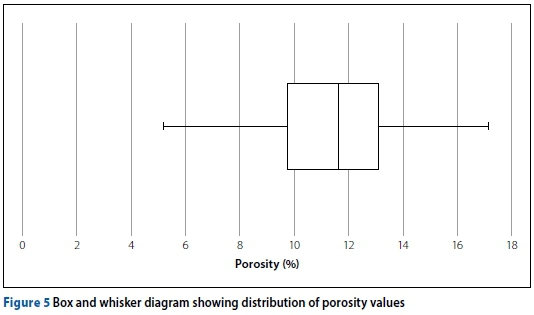
Box and whisker diagrams of all the sorptivity and porosity values in the data set were produced, in Figures 4 and 5 respectively, showing a symmetrical distribution of the data. The average sorptivity value of the data set is 8.5 mm/Vh, while the range of sorptivity is 3-14 mm/Vh. The porosity values are also found to be symmetrical, with the average porosity being 11.9%, and the range of porosity values being 5-17%.
Analysis of data
Data categorised according to rate of mass change, incorporating strength grade
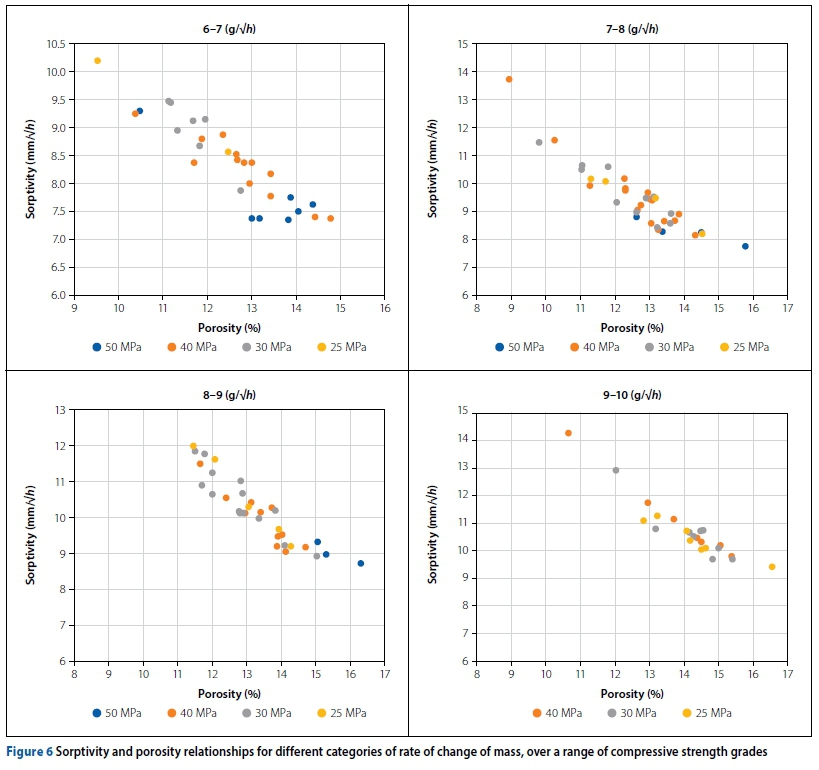
Data points that had information pertaining to the stated grade of the concrete (not measured grade), of which there were 151, were extracted and categorised. The data represented concrete grades of 50, 40, 30 and 25 MPa. Following this, data points with similar rates of change of mass (parameter F in Equation 2) were grouped together, and the corresponding sorptivity and porosity values were plotted against each other. The categories of the groups of rates of mass change were taken as 6-7, 7-8, 8-9, and 9-10 g/Vh.
Figure 6 shows scatter plots of the sorptivity and porosity values plotted for different mass rates of change. The same pattern can be observed across all four scatter plots, with the sorptivity and porosity values being closely inversely related for the same category of rate of change of mass. The plots show that, for any given absorption rate, the relationship between sorptivity and porosity is essentially the same regardless of concrete grade. This is an important observation since it indicates that the same sorptivity value is possible for different grades of concrete, governed largely by the different rates of change of mass. The data also illustrates that for a given concrete or closely related set of concretes, low sorptivity values can result from high porosity values and vice versa.
Further observation of the four plots in Figure 6 shows that, as the rate of mass change increases, the scatter bands move up and to the right in relation to the axes, implying that both sorptivity and porosity increase with increase in rate of mass change, i.e. complementing Equation 4. This is expected for sorptivity, since it relates directly to rate of mass change; however, the fact that porosity also increases implies that the rate of mass change increases faster than the increase in pore volume. This is most likely linked to greater pore interconnectivity at greater rates of mass change. Both these aspects - greater sorptivity and greater porosity at greater rate of mass change - are undesirable for producing a durable concrete. This also intimates that both parameters need to be considered when assessing the potential durability of a concrete mix.
The scatter band plots in Figure 6 represent concrete strength grades over a wide range of 25-50 MPa. While there is some clustering of points for a given strength grade, the picture emerges that the two durability-related parameters are not meaningfully linked to strength. This is also an important conclusion since many engineers still relate durability to strength. These results show that it is possible to obtain a given sorptivity or porosity over a wide range of concrete strengths.
Relationship between sorptivity and rate of change of mass for a constant porosity
In general, an increase in the rate of water absorption will result in a decrease in potential durability. Regarding Figure 6, it is possible to obtain the same sorptivity over a range of values of rate of change of mass, moderated again by the porosity. For example, a sorptivity of 10 mm/Vh is associated with a range of porosities, depending on the rate of change of mass, given in Table 2.
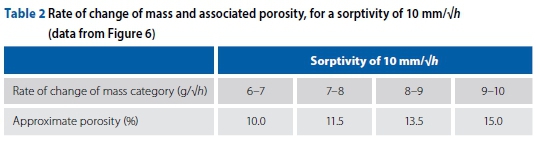
It can be argued that concrete with a sorptivity of 10 mm/Vh will have a greater potential durability at a porosity of 10% than at a porosity of 15%, particularly since, as indicated above, the higher porosities may represent more interconnected pores. Thus, sorptivity cannot be considered in isolation of porosity since both can influence potential durability.
It is also important to consider the types of degradation that might occur because of different environmental exposure conditions, as well as the function of the structure, as these play a role in whether sorptivity or porosity is more important. For freeze-thaw degradation, the porosity and critical pore size are probably more crucial than the sorptivity, due to the mechanism of freezing which involves the expansion of water in the pores. The larger the pore size, the larger the total amount of liquid in the pore available to expand. The amount of space and the pore spacing factor are therefore critical in determining the amount of damage. For other types of degradation, such as corrosion of reinforcement, sorptivity is more crucial. If the sorptivity is higher, concrete exposed to a fluid will experience deeper wetting in a shorter period, with the fluid reaching the reinforcing bar and influencing corrosion. This might be critical in, say, zones of wetting and drying such as the inter-tidal zone in marine structures.
Semi-quantitative matrix of sorptivity and porosity values
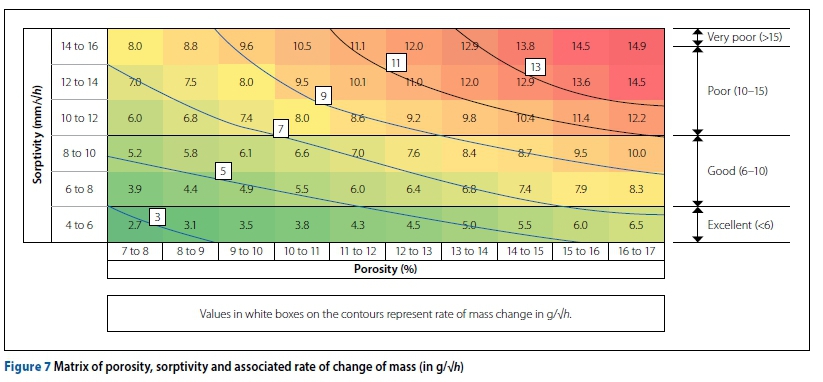
The main objective of this work was to determine whether sorptivity should be considered in conjunction with porosity when assessing the potential durability of concrete. The question that arises is: what porosity values in combination with sorptivity values might be considered "acceptable" or not? To assist with making this assessment, a semi-quantitative matrix of values of sorptivity and porosity in combination was produced. The ranges of sorptivity and porosity were selected as 4-16 mm/Vh and 7-15% respectively. A gradation of 2 units was used for the sorptivity axis, and a gradation of 1 unit for the porosity axis. The matrix is shown in Figure 7.
Values of the average rate of mass increase for possible combinations of sorptivity and porosity were inserted on Figure 7, associated with "contours" (see white boxes). A colour scale was used to show high (red) and low (green) rates of change of mass. It is reasonable to assume that the higher the water absorption rate, the more vulnerable the concrete will be in terms of durability.
From Figure 7, for a given sorptivity value, there exists a wide range of rate of change of mass values. This shows again how concretes with the same sorptivity value can have varying potential durability depending on the porosity. Concretes with higher porosity might be more penetrable to greater depth over the long term than concretes with lower porosity. The contours attempt to show that concretes with any combination of sorptivity and porosity values that fall on the same contour line, or within a set of contours, may have similar potential durability (given the same environmental conditions). For example, in this scheme a concrete with a sorptivity of 6 mm/Vh and a porosity of about 12% may be considered to have similar potential durability as a concrete with a sorptivity of 8 mm/Vh and a porosity of about 8%.
Figure 7 also gives a qualitative and semi-quantitative classification of durability in the sorptivity categories on the right-hand side of the diagram, which derive from Table 1. Conventionally, these categories are extended leftwards by following the relevant horizontal category lines from their starting positions on the right-hand side axis. This is the more conservative approach. However, an alternative scheme that bears further investigation is to extend the sorptivity categories leftwards by following the relevant contour lines. For example, any concrete falling under the mass rate of gain contour of, say, 7 g/Vh might be considered "excellent", together with other concretes within the contour limits with different porosities and sorptivity. It must be stressed that these potential durability classifications are tentative and can only be taken in a general sense. They are presented here to stimulate debate on how these parameters might better be used in durability design.
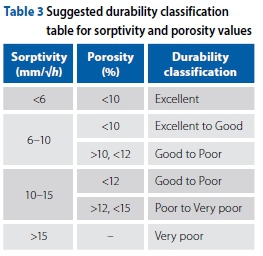
To make the matrix more "user-friendly", the results were simplified into Table 3 that gives the potential durability for a combination of different sorptivity and porosity values. These critical values for porosity were determined by using the contour lines of Figure 7 as a guide, but also considering the data in Figure 3. Importantly, however, judgement was used to impose limits on the values, such that both sorptivity and porosity values of greater than 15% were considered undesirable in a structural concrete. The desired durability classifications should also take into consideration the environmental exposure class of the structure. A "poor" concrete might be quite acceptable in an environment where the structure is not exposed to aggressive substances, such as internal concrete in a normal building. Thus, engineers and specifiers should exercise caution in using Table 3, so as not to over-specify a given concrete.
CONCLUSIONS
Effect of strength grade on the relationship between sorptivity and porosity
For any given absorption rate (i.e. rate of mass change), the relationship between sorptivity and porosity is essentially the same regardless of the nominal grade of the concrete (50, 40, 30 and 25 MPa). This demonstrates that the same sorptivity value is possible for different grades of concrete, and highlights the importance of considering a parameter such as porosity to fully describe the durability potential.
Also, both sorptivity and porosity increase with increase in rate of mass change. While this direct relationship between sorptivity and rate of change of mass is to be expected, it is not intuitively expected for porosity, but implies that the rate of change of mass increases faster than the pore volume increases. This leads to the conclusion that higher rate of mass change is linked to greater pore interconnectivity (and not necessarily pore volume). An increase in both or either of these parameters, sorptivity and porosity, will result in a decrease in the potential durability of the concrete. For this reason, both sorptivity and porosity values should be considered when assessing the potential durability of concrete.
The results also show that a given concrete strength could have varying combinations of porosity and sorptivity. This confirms the notion that strength is not indicative of durability, in contrast to what is commonly thought by engineers.
Porosity considered in conjunction with sorptivity
As mentioned above, concretes with the same sorptivity may have varying porosity values (an increase in porosity is associated with an increase in the rate of mass change). It can thus be argued that concrete with a given sorptivity rate and "lower" porosity, will have a greater potential durability than a concrete with a "higher" porosity, since higher porosities represent greater connectivity of pores. Thus, sorptivity cannot be considered in isolation to porosity, as both parameters influence the potential durability.
To attempt to quantify this, a table of suggested "acceptable" combinations of sorptivity and porosity values was developed (Table 3). Judgement was used to impose limits on very high porosity and/ or sorptivity values. Sorptivity and porosity values greater than 15% were considered undesirable. While this table is useful in a general sense, the environmental exposure conditions of the structure need to be considered when assessing the potential durability. For example, a "poor" sorptivity classification may be acceptable for a concrete that forms part of the interior of a normal building, where deterioration is extremely unlikely. Further research is needed to refine the table of "acceptable" porosity and sorptivity values and explore the implications for concrete potential durability. Also, further work is needed to assess the effect of measured porosity values and pore size distributions on the durability parameters considered.
ACKNOWLEDGEMENTS
The authors gratefully acknowledge the financial support of the Concrete Materials and Structural Integrity Research Unit (CoMSIRU) at the University of Cape Town, and the industrial sponsors of CoMSIRU, i.e. PPC Cement (Pty) Ltd, AfriSam, Lafarge, SIKA, Haw & Inglis, and AVENG. Other sponsors of CoMSIRU are the Water Research Commission of South Africa (WRC), the South African Department of Water and Sanitation, and Transnet.
REFERENCES
Alexander, M, Ballim, Y & Mackechnie, J 2018. Durability Index Testing Procedure Manual. Version. 4.5.1. CoMSIRU. University of Cape Town & University of the Witwatersrand. http://www.comsiru.uct.ac.za. [ Links ]
Alexander, M G, Ballim, A Y, Stanish, K & Ballim, Y 2008. A framework for the use of durability indexes in performance-based design and specifications for reinforced concrete structures. Materials and Structures, 41(5): 921-936. [ Links ]
Alexander, M G & Beushausen, H 2019. Durability, service life prediction, and modelling for reinforced concrete structures: Review and critique. Cement and Concrete Research, 122: 17-29. [ Links ]
Alexander, M G, Mackechnie, J R & Ballim, Y 1999. Guide to the use of durability indexes for achieving durability in concrete structures. Resesearch Monograph No. 2. University of Cape Town & University of the Witwatersrand. [ Links ]
ASTM 2013. ASTM C1585-13 2013. Standard Test Method for Measurement of Rate of Absorption of Water by Hydraulic Cement Concretes. West Conshohocken, PA: ASTM International. [ Links ]
Mackechnie, J R & Alexander, M G 2002. Durability predictions using early-age durability index testing. Proceedings, 9th Durability and Building Materials Conference, 17-21 April 2002, Brisbane, Australia, p 11. [ Links ]
Moore, A 2014. Effect of oxygen availability on the corrosion rate of reinforced concrete in marine exposure zones: Inference from site and lab studies. MSc dissertation. University of Cape Town. [ Links ]
Mukadam, Z, Alexander, M G & Beushausen, H D 2016. The effect of drying preconditioning on the South African durability index tests. Cement and Concrete Composites, 69: 1-8. [ Links ]
Nilsson, L O 2003. Durability concept: pore structure and transport processes. In Newman, J & Choo, B S (Eds). Advanced Concrete Technology. Cambridge, UK: Woodhead Publishing. [ Links ]
Otieno, M & Alexander, M 2015. Chloride conductivity testing of concrete. Past and recent developments. Journal of the South African Institution of Civil Engineering, 57: 55-64. [ Links ]
Salvoldi, B G, Beushausen, H & Alexander, M G 2015. Oxygen permeability of concrete and its relation to carbonation. Construction and Building Materials, 85: 30-37. [ Links ]
SANRAL (South African National Roads Agency Limited) 2009. Spreadsheet: Table 6000/1: Concrete Durability Specification Targets (Civil Engineering Structures only). Pretoria: SANRAL. [ Links ]
World Business Council for Sustainable Development 2009. The Cement Sustainability Initiative (CSI). Recycling of Concrete. http://www.wbcsdcement.org. [ Links ]
 Correspondence:
A J Moore
CoMSIRU, Department of Civil Engineering University of Cape Town
Private Bag X3, Rondebosch 7701, Cape Town, South Africa
T: +27 21 650 4012, E: amymoore.ct@gmail.com
A T Bakera
CoMSIRU, Department of Civil Engineering University of Cape Town
Private Bag X3, Rondebosch 7701, Cape Town, South Africa
T: +27 21 650 4012 E: bkrali003@myuct.ac.za
M G Alexander
CoMSIRU, Department of Civil Engineering University of Cape Town
Private Bag X3, Rondebosch 7701, Cape Town, South Africa
T: +27 21 650 4012, E: mark.alexander@uct.ac.za

AMY MOORE completed her BSc (Eng) and MSc (Eng) degrees in the Department of Civil Engineering at the University of Cape Town. Her Master's research focused on the corrosion of reinforced concrete in marine environments. Since having completed her studies, Amy has been pursuing a career in education and publishing.

ALICE TITUS BAKERA is a PhD student in the Department of Civil Engineering at the University of Cape Town (UCT). Her current research focuses on the biogenic acid attack of concrete subjected to the sewer environment. She is a member of the Concrete Materials and Structural Integrity Research Unit (CoMSIRU) at UCTand a member of the Concrete Society of Southern Africa, Western Cape Branch.

PROF MARK ALEXANDER is an Emeritus Professor and a Senior Research Scholar at the University of Cape Town (UCT). He has a PhD from the University of the Witwatersrand and is a Fellow of the University of Cape Town and of RILEM (International Union of Laboratories and Experts in Construction Materials, Systems and Structures). He co-authored Aggregates in Concrete (2005), Alkali-Aggregate Reaction and Structural Damage to Concrete (2011) and Durability of concrete - design and construction (2017) (CRC Press), and was Editor of Marine concrete structures. Design, durability and performance (2016) (Woodhead Publishers). He is involved in the Concrete Materials and Structural Integrity Research Unit (CoMSIRU) at UCT, which focuses on infrastructure performance and renewal research.

