


Services on Demand
Article
 English (pdf)
 Article in xml format
 Article references
Indicators

Related links
-
 Cited by Google
 -
 Similars in Google
Share

 Permalink
Journal of the South African Institution of Civil Engineering
On-line version ISSN 2309-8775
Print version ISSN 1021-2019
J. S. Afr. Inst. Civ. Eng. vol.63 n.2 Midrand Jun. 2021
http://dx.doi.org/10.17159/2309-8775/2021/v63n2a3
TECHNICAL PAPER
Static pile capacity from the rapid test via the unloading-point method
I Luker
ABSTRACT
Laboratory measurements were done of the end-bearing and side-shear stresses on small piles subjected to "static" and rapid load tests. Interpretation, by the unloading-point method, of the results of rapid tests were done to estimate what the behaviour under a static test would have been if it had been done instead. Comparisons were made of the estimated static test behaviour to the actual static test behaviour to determine empirical values of a factor to adjust estimates closer to actual static test results. The dependence of the empirical factor on soil type, the liquid limit of plastic soils and water content is shown.
Keywords: piles, load test, clays, dynamics, empiricism
INTRODUCTION
The four basic types of pile load test are commonly called: (i) maintained load (or static), (ii) constant rate of penetration (CRP), (iii) rapid, and (iv) dynamic. However, in the maintained load test, increments of load are added when the rate of penetration has reduced to (typically) 0.25 mm/hour. Therefore, like the CRP, it is also a test in which the rate of penetration is specified, although extremely slow. The rapid and dynamic tests are both done quickly, and up to twelve pile tests per day have been reported. The fundamental difference between the rapid and dynamic types is the length of time over which the testing force is applied. For the rapid test it lies in the approximate range of 0.02 to 0.2 sec, (depending on pile length and material), and for the dynamic test it is approximately 0.005 sec. In the dynamic test a force pulse of short wavelength travels down the pile shaft (in compression) and back up (in tension). In the rapid test, the force pulse has a wavelength that is sufficiently long for the whole pile to be in compression simultaneously and no reflected tension wave effects are seen.
Further information about the four types of test can be found in Fleming et al (1994) and Byrne et al (2019). More specific information about the rapid test is given by Middendorp et al (1992), Middendorp and Bielefeld (1995), and Hölscher et al (2012).
Standards defining the method of execution of the rapid test are ISO22477-10:2016 (ISO 2016), ASTM D7383-08 (ASTM 2008) and JGS 1815-2002 (JGS 2002).
The measurements of force and settlement in all four basic types of pile test need to be interpreted to predict how the pile will behave under its working load. Because of the wave effects in the dynamic test its interpretation is difficult, requiring complex computer software, knowledge of empirical correlations and an experienced interpreter. In comparison, the unloading-point method of interpretation of the rapid test is simpler. It can be concisely described as follows:
Figure 1 shows, for a rapid test, a typical graph of total force measured at the head of a pile versus displacement, where:
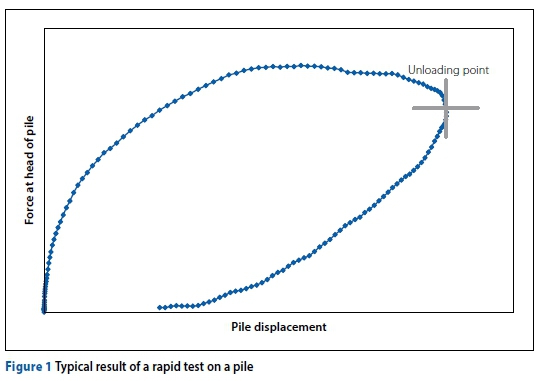
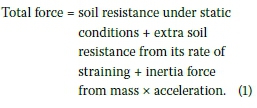
At the unloading point the velocity is zero, so the second term of the soil resistance in Equation 1 is zero. The acceleration is measured throughout the test and the mass can be estimated, so the third term can be calculated. Subtraction of the third term from the measured total force gives the soil resistance under static conditions, at the point of maximum settlement in the test.
A formal statement of this procedure is given in Hölscher et al (2012) and ISO 22477-10:2016 (ISO 2016).
Values of static resistance calculated using this procedure, when compared to those from the maintained load (static) test, have been found to be accurate for coarse, non-cohesive soil, but to overestimate the resistance of cohesive soils (Hölscher et al 2012; Weaver & Rollins 2010). Adjustment of this overestimate is done by an empirical factor μ, defined as follows:
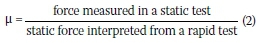
In a review of comparisons between rapid and static tests by Hölscher et al (2012) a value of μ = 0.66 is given "for all clay", with a coefficient of variation of 49%. These values are repeated in ISO 22477-10:2016 (ISO 2016). Brown and Powell (2013) stated that more information about the variation of μ with soil type was needed. They chose liquid limit (LL) to represent the potential for rate effects in cohesive soils, and from published results of six sources of tests where the LL was known they suggested:
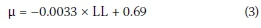
which has a Pearson R2 correlation coefficient of 0.6.
These coefficients (49% and 0.6) seemed to the present author to be too high and too low, respectively, for satisfactory application in practice, so the work described in this paper was done to try to improve the accuracy with which μ for the unloading-point method (UPM) can be estimated.
It is noted that two other methods of interpretation of the rapid test have been proposed and have been reviewed by Brown and Powell (2013). They applied all three methods to maintained load and rapid field tests on two clay sites. Perhaps because of limited data they did not give broad recommendations for which method is preferable. It is suggested by the present author that the UPM has the benefit of simplicity. It is also noted that it is the only method recommended by ISO 22477-10:2016 (ISO 2016).
CHOICE OF METHOD OF INVESTIGATION OF μ
The first choice made was between full-scale site tests where rapid tests are compared to maintained load tests, or smaller-scale laboratory tests. To be of practical use, values of μ for a wide range of soil types are needed. Site tests are very expensive and the types of soil around a pile can vary greatly along its length, therefore laboratory testing on a small diameter pile was chosen.
The second choice presented, if a whole pile were to be tested, was the value of the ratio of length to base diameter of the pile, λ. Influencing this choice were: (i) the soil mechanics of side shear are different from end bearing, (ii) the magnitude of the influence of loading rate on μ for side shear has been reported to be greater than that on μ for end bearing (Brown 2004), and (iii) a wide range of λ occurs in piling practice, and a sufficient number of tests in the present investigation could not be done to represent that range. After considering these influences it was decided to do separate tests for side shear and end bearing.
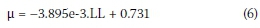
The third choice presented was that of the parameters to be measured of the soils in the beds in which the pile was tested, for possible use in empirical relationships to predict μ. Influencing this choice were: (i) the soil parameters should be easily obtained, such as those that are usually measured in a site investigation, (ii) the parameters likely to have a significant influence on the value of μ must be included, and (iii) Brown and Powell (2013) had used liquid limit to characterise a cohesive soil in their empirical equation for μ. (The soil parameters chosen to be measured in this study are given in Table 2 on page 24.)
APPARATUS AND PROCEDURE FOR END-BEARING TESTS
Figure 2 gives details of the apparatus. The closed end of the inner tube bears onto the compacted soil below it. The outer tube allows the top of the compacted soil to be above the bearing level. Friction between the tubes was reduced to a negligible amount by soft grease. Bearing force on the inner tube was measured by the same load-cell in both very slow penetration tests (so-called "static" tests) and rapid tests. Displacement of the inner tube relative to the soil container was measured by two linear potentiometers. Two accelerometers were fixed diametrically opposite on the inner tube to measure acceleration in the direction of the bearing force.
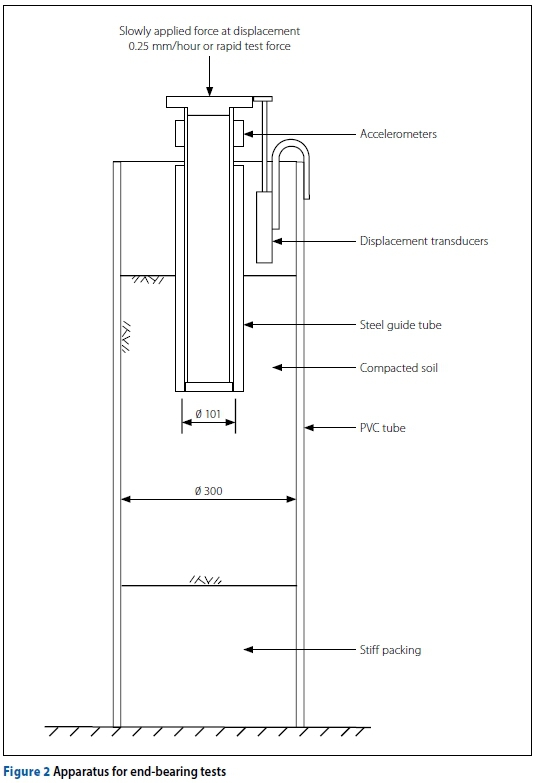
Soil was compacted by hand into the PVC tube container by a rammer of 75 mm diameter and mass 4.5 kg. The water content of each soil was adjusted to the estimated optimum for compaction, resulting in all soil test beds being partially saturated and at water content at or below their plastic limit.
The boundary of the soil below the bearing level of the pile was at five times its diameter, so that the mechanics of the soil were not significantly influenced by this boundary. However, the diameter of the container was only three times the pile diameter, therefore this boundary did have an influence on the soil bed's behaviour. This influence was considered acceptable because the purpose of the testing was comparison of behaviour in two types of test, and both types would have the same boundary conditions.
The slowly applied bearing force was produced by advancing the base of the pile at a rate close to 0.25 mm/hour, using an electric motor and a custom-built series of gears ending in a slowly turning nut on a threaded shaft. The rate of 0.25 mm/hr was chosen because it is close to the rate of settlement at which load increments are added in standard maintained load (static) tests, e.g. ASTM D7383-08 (ASTM 2008) and SANS 1200F (SANS 1983).
The rapid test force was produced by dropping a 100 kg mass of steel onto a spring at the head of the pile. Because the stiffness and strength of the different soil beds varied, the height of drop of the mass needed to deliver the desired force also varied. This variation in drop height caused variation in the velocity of the pile base, which is discussed further on in this paper.
The time period over which a force should be applied for a test on a pile to be a rapid test has been defined (Middendorp & Bielefeld 1995) as required to be at least 10 times the time needed for a stress wave to travel the length of the pile. So, the question arises: are the time periods over which force was applied in the end-bearing tests sufficiently close to those that would occur in rapid tests on whole piles? The range of the time periods in the end-bearing tests was 0.02 to 0.025 sec. Considering piles made of good quality concrete with a wave velocity of 4 000 m/s, the minimum pile length to exactly comply with the rapid test definition is then given by:
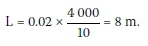
This length is realistic for a concrete pile, therefore the time periods over which end-bearing stress was applied to the soil in these tests can be considered realistic for a rapid test.
Sequence of test types
Ideally one would test the pile in a bed of a particular soil using one test method, remove the pile and re-establish it in an identical bed of soil, then test it using the other test method. However, it was found to be impossible to get sufficiently identical conditions of soil compaction in successive tests.
The solution adopted is illustrated in Figure 3 (page 21), showing measurements from one of the tests. The pile was first loaded slowly (0.25 mm/hr as in a static test) to a displacement of 5.6 mm, unloaded, then slowly reloaded again to a total displacement of 12.7 mm and unloaded. A rapid reload test was then done (for clarity, not shown in Figure 3). A second slow reload test was then done. As can be seen in Figure 3, the soil conditions encountered by each reload test are different, because of the action on the soil of the preceding test. To compare the behaviour in the rapid test to that in the slow test, the graph of slow test behaviour at displacements starting from point A on Figure 3 is assumed would rise up to the green line, in a similar manner to the slow reload tests on either side, then follow that green line.
The force versus displacement behaviour of the rapid test that was actually done, starting from point A on Figure 3, is shown in Figure 4. Note that the force values on the ordinate axis have been corrected for the contribution to the force measured at the load-cell from acceleration and inertia of the inner tube and impact plate on top of it. Displacement in both types of test was measured by transducers, but in the rapid test was also calculated from integration of the measured acceleration. Values were very similar but offset by a small time difference when plotted on a graph of force versus time. Because the values from integration of acceleration give a smoother line than those from the displacement transducers, they are used for all the rapid tests reported in this paper.
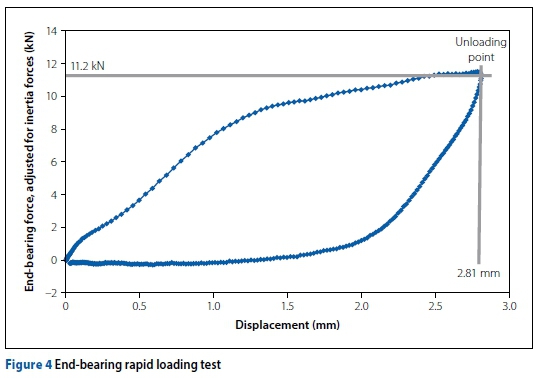
Consider further this example: at the unloading point the displacement on Figure 4 is 2.81 mm and the force value (confirmed on a graph of force versus velocity, at velocity = 0) is 11.2 kN. On Figure 3 the slow test force from the interpolated green line at a displacement of 2.81 mm from point A is 10.4 kN. Therefore, the value in this example of μ (from Equation 2) is 10.4/11.2 = 0.93.
RESULTS OF END-BEARING TESTS
Twelve different soils were used for tests of side-shear and end-bearing behaviours (characteristics of which are given in Table 2 on page 24). Soil Numbers 1, 2 and 7 were used for end-bearing tests, chosen because 2 and 7 are at the extremes of fineness and coarseness of the twelve, and Soil No 1 is approximately midway. The results are given in Table 1.
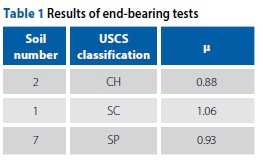
The range of variation of μ is small compared to that reported by Brown and Powell (2013) for whole piles, and the mean is close to 1. This indicates: (i) the unloading-point method is accurate for end bearing, and (ii) variation in soil type has little effect on the accuracy.
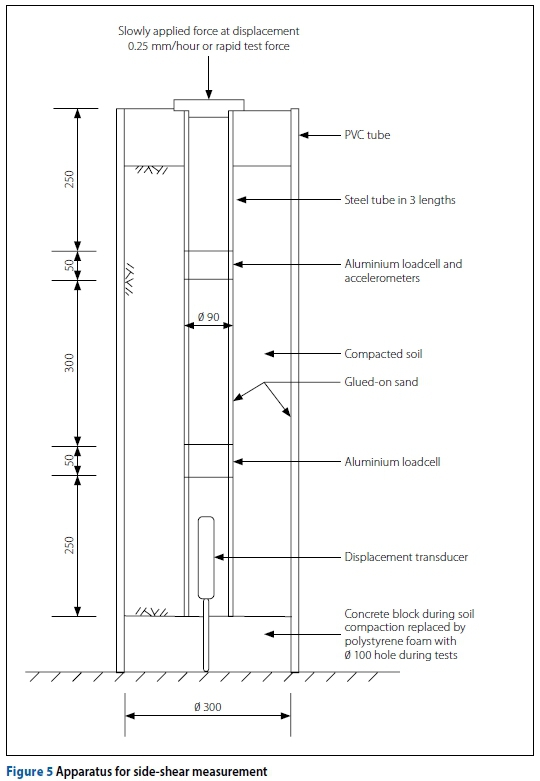
APPARATUS AND PROCEDURE FOR SIDE-SHEAR TESTS
Figure 5 gives details of the apparatus. The pile was made from three lengths of steel tube, between which were two pieces of aluminium tube. The five tubes were strongly glued together. Both aluminium tubes had strain gauges on their internal faces so that they functioned as load-cells to measure longitudinal force, and the upper aluminium tube also had two accelerometers for the longitudinal direction. Soil was compacted round the pile inside the same 300 mm diameter tube used for the end-bearing tests, against the reaction of a concrete block at the bottom of the tube. Both pile and container tube had rough surfaces of glued-on sand to prevent slip and ensure shear was within the soil. Before beginning testing of the pile, the concrete block at the base of the tube was replaced by a block of expanded polystyrene foam with a central hole 3 mm bigger in diameter than the bottom steel tube of the pile. During all tests on the pile, its downward displacement was freely into the hole in the polystyrene foam whose purpose was to prevent spalling of the bottom face of the soil annulus. Although the shear stiffness of the foam was different from the soil, because the shear behaviour of the middle third of the length of the pile was being examined, 300 mm away from the foam, the effect of the foam on that shear behaviour was assumed to be negligible.
The procedure adopted is similar to that used for the end-bearing tests and is illustrated in Figure 6. The pile was first loaded slowly (0.25 mm/hr as in a static test) to its maximum capacity, unloaded, then slowly reloaded again to its maximum capacity, and unloaded. A rapid reload test was then done (for clarity not shown in Figure 6). A second slow reload test was then done. As can be seen in Figure 6, the shapes of the graphs of the initial loading and the two slow reload tests are different. Consider the graphs of the initial slow loading and the first slow reload tests. They are different because the soil conditions that the reload test encounters have been altered by the action of the initial loading. For the same reason, the graphs of the two slow reload tests are different from each other. However, they are sufficiently similar for the assumption to be made that the mean of them represents the slow test behaviour of the soil that would have been seen if a slow test had been done instead of the rapid test that was actually done.
In these tests, for one pile embedment in a soil, four slow reload tests were done, with three rapid tests between them. From comparison of the behaviours in the two types of test, three values of μ for that soil were obtained. The mean of the three has been taken as representative of the soil and its condition in those tests.
RESULTS OF SIDE-SHEAR TESTS
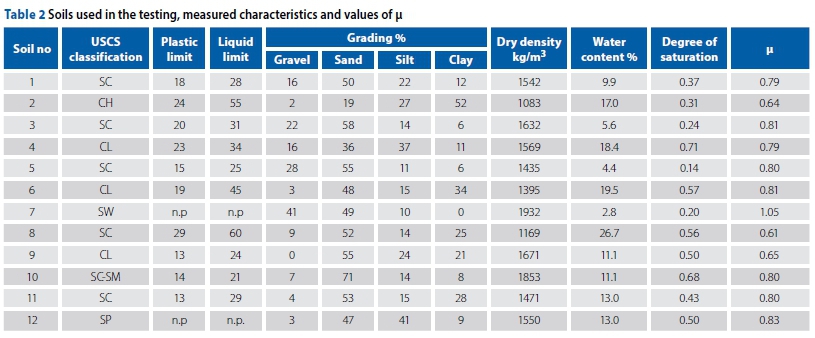
Figure 7 shows a typical graph of force versus displacement for the side-shear resistance on the middle length of the pile in the rapid test done between the first and second reload tests shown in Figure 6. The force has been adjusted to remove inertia effects. Its shape is similar to Figure 4 for an end-bearing test, except that it is more flat-topped, as can be expected from the flat-topped shape of the slow tests results shown in Figure 6.
Tests to compare side-shear behaviours in the slow and rapid tests were performed in twelve different soils. Measured properties of the soils and their density and moisture content conditions during the tests are shown in Table 2, together with the values of μ.
The values of μ for the non-plastic soils numbers 7 and 12 are close to 1, as expected. However, the range of μ in the ten plastic soils is from 0.61 to 0.81. Clearly some means of choosing the appropriate value of μ for a site of a rapid pile test is required. In the absence of mathematical theory representing the variation in soil conditions, empirical correlation is invoked.
EMPIRICAL CORRELATION BETWEEN μ FOR SIDE-SHEAR AND SOIL PROPERTIES
Following the example of Brown and Powell (2013) μ from these side-shear tests was first plotted against liquid limit, as shown in Figure 8, which also incorporates their values for whole piles plotted as grey diamond-shaped points. The red points are present results of tests done at water content close to the optimums for compaction of the soils.
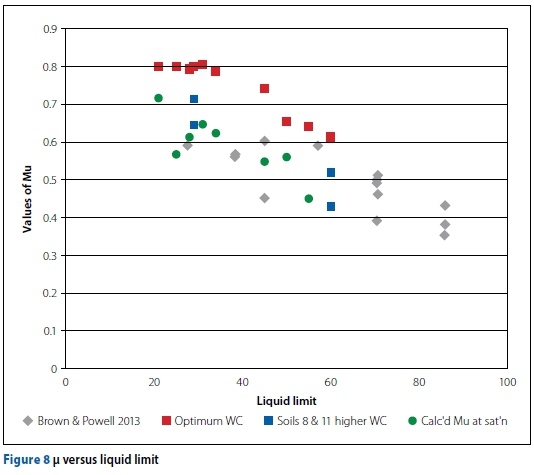
It is clear that the trend of values of μ in the red points is higher than those of Brown and Powell (2013). It was thought that this may have been caused by different amounts of water in the soils, because the field tests reported by them were done on sites with high water tables, so it may be assumed that the majority of the soil affected by the piles was saturated.
To test this hypothesis, tests on soils numbers 8 and 11 (whose liquid limits are 60 and 29 respectively), were done at three different degrees of saturation. In Figure 8 the blue points at liquid limit = 60 and 29 show the resulting decrease in μ towards the region of the tests done (it is assumed) in saturated soil.
It is therefore concluded that in an empirical evaluation of μ for a soil, its water content must be one of the parameters included.
In the present study the linear correlation of μ with a variety of parameters of soil characteristics was investigated using least squares regression analysis. Table 3 gives the values of R2 seen for the measured soil properties for the tests shown by the red points in Figure 8, for all parameters except water content (WC) and degree of saturation (S). The tests shown by the blue points were included with the red points for the correlations with WC and S. The correlation of μ with the rate of shearing was also investigated, using the parameter of the maximum pile velocity in each test.
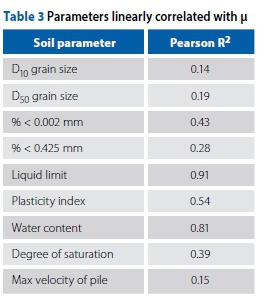
Clearly μ is best correlated with the plasticity parameters, with liquid limit (LL) being the better one. It is similarly correlated with WC. Correlation with aspects of the grading curve are not good, and degree of saturation is, surprisingly, poorly correlated with μ. Also surprising is the small correlation of μ with the velocity of the pile during the test, in this case represented by the maximum velocity value.
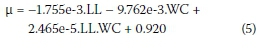
To get the most accurate empirical equation for μ from the measured results, various combinations of parameters were investigated, but including more than LL and WC produced negligible improvement. Therefore a function of the form (Equation 4) was chosen:

When the m1 to m4 factors were determined from the data of the red and blue points on Figure 8, the R2 value was 0.88. This seems relatively good, but comparing the calculated values of μ to the actual values of μ showed that the function overestimates μ at high WC. This is because only two soils (numbers 8 and 11, LLs 60 and 29 - blue points on Figure 8) have test data at high WC.
To obtain a function for μ with broad application in practice, the green points in Figure 8 were generated for the soils at their saturation WC, using the linear correlation between WC and μ whose R2 value was 0.81 in Table 3. The factors of Equation 4 were then found using the data of all points from the present side-shear tests on Figure 8, (i.e. all except Brown and Powell's data, the grey points), giving Equation 5.
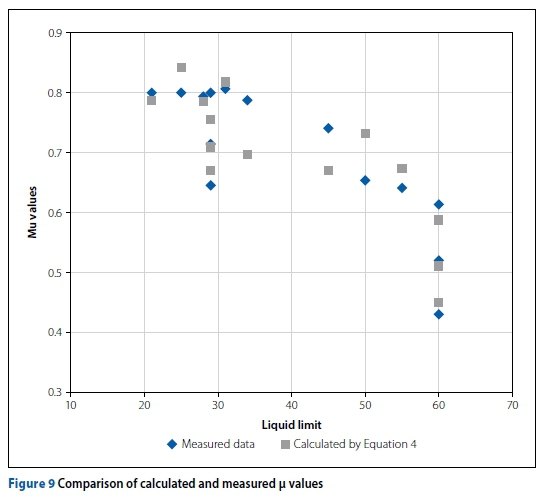
One would normally show the line of an empirical equation superimposed on a graph of the data points from which it was derived, but this is impractical in the present case where the equation has two independent variables, LL and WC. Instead, the ability of Equation 5 to reproduce the measured values of μ is shown in Figure 9, which plots both actual and calculated values of μ against LL.
DISCUSSION
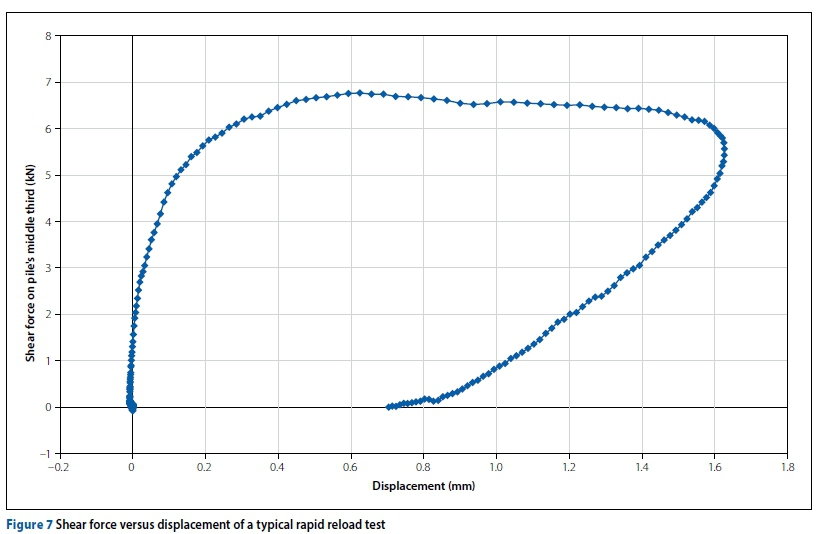
Because the grey points on Figure 8 are for whole piles, but the other points (from the present tests) are for side shear only, it is strictly not correct to combine them into a single empirical relationship for μ. However, if it is accepted that μ values for end bearing are close to unity for all soil types, then the variation of the grey points with LL is mainly caused by the effect of the variation of LL on side shear. Then, for saturated soils, the grey points can be combined with the green points and the two of the blue points that were for saturated conditions, to give the best fit linear Equation 6 for μ for side shear in saturated soil. It has R2 = 0.73.
It is noted that if a μ value from Equation 6 is used to interpret a rapid test on a whole pile (including its end-bearing resistance where μ is close to unity) then a conservatively low estimate of the static load resistance will be obtained.
CONCLUSIONS
■ Improvement in the scatter of values of μ previously published has been obtained by doing "static" and rapid tests on the same pile, but repeating the static test after the rapid test to get a more accurate assessment of static behaviour to which to compare the rapid behaviour.
■ Based on three tests, having a wide range of soil types, the factor μ (refer to Equation 2) for end-bearing loads on a pile is close to 1 and independent of soil type.
■ The factor μ for side shear in coarse soils is confirmed to be close to 1.
■ Based on multiple tests on 12 soils, μ for side shear on a pile varies with: (i) soil type (coarse or cohesive), and (ii) for a cohesive soil, its liquid limit and its water content.
■ Values of μ for side shear for use in practice may be determined from the liquid limit and water content of a soil using the empirical Equation 5 in this paper, for the range of liquid limit up to 60.
■ In saturated soils, Equation 6 is applicable to give μ for side shear, for liquid limit up to 90.
■ Conservative values of maximum "static" capacity for a whole pile may be obtained by applying values of μ from Equations 5 and 6 to the unloading-point method of interpretation of a rapid test on a whole pile.
ACKNOWLEDGEMENTS
The author wishes to thank Civilab (Pty) Ltd for their generosity to the general public, via the geotechnical engineering profession, for doing all the material characterisation tests reported in this paper without charge.
The assistance of N Mangisana and L Madlala in obtaining the end-bearing test results during their BSc final-year investi-gational project is gratefully acknowledged.
REFERENCES
ASTM 2008. ASTM D7383-08. Standard Test Methods for Axial Compressive Force Pulse (Rapid) Testing of Deep Foundations. [Superseded by ASTM D7383 -19.] West Conshohocken, PA: ASTM International. [ Links ]
Brown, M J 2004. The rapid load testing of piles in fine grained soils. Sheffield, UK: PhD thesis. University of Sheffield. [ Links ]
Brown, M J & Powell, J J M 2013. Comparison of rapid load test analysis techniques in clay soils. Journal of Geotechnical and Geoenvironmental Engineering, ASCE, 139(1): 152-161. [ Links ]
Byrne, G, Chang, N & Raju, V 2019. A Guide to Practical Engineering in Africa, 5th ed. Johannesburg: Franki Inc. [ Links ]
Fleming, W G K, Weltman, A J, Randolph, M F & Elson, W K 1994 Piling Engineering. Glasgow: Blackie & Son. [ Links ]
Hölscher, P, Brassinga, H, Brown, M J et al 2012. Rapid Load Testing on Piles: Interpretation Guidelines. London: CRC Press. [ Links ]
ISO (International Standardisation Organisation) 2016. ISO 22477-10:2016. Geotechnical Investigation and Testing: Testing of Geotechnical Structures. Part 10: Testing of Piles: Rapid Load Testing. Geneva: ISO. [ Links ]
JGS (Japanese Geotechnical Society) 2002. JGS18152002. Method for Rapid Load Test of Single Piles. Tokyo, Japan: JGS. [ Links ]
Middendorp, P, Bermingham, P & Kuiper, B 1992. Statnamic load testing of foundation piles. In: Barends, F B J (Ed.). Application of Stress Wave Theory to Piles. Rotterdam, The Netherlands: A A Balkema, 581-588. [ Links ]
Middendorp, P & Bielefeld, M W 1995. Statnamic load testing and the influence of stress wave phenomena. Proceedings, 1st International Statnamic Seminar, 25-27 September 1995, Vancouver, Canada, pp 1-15. [ Links ]
SANS (South African National Standard) 1983. SANS 1200F 1983 Standardised Specification for Civil Engineering Construction. Section F: Piling. Pretoria: SABS Standards Division. [ Links ]
Weaver, T J & Rollins, K M 2010. Reduction factor for the unloading point method at clay soil sites. Journal of Geotechnical and Geoenvironmental Engineering, ASCE, 136(4): 643-646. [ Links ]
 Correspondence:
I Luker
School of Civil and Environmental Engineering University of the Witwatersrand
PO Wits, 2050, South Africa
T: +27 11 717 7114, E: i rvin.luker@wits.ac.za

DR IRVIN LUKER (Pr Eng, MSAICE), who is a Senior Lecturer at the University of the Witwatersrand in Johannesburg, joined the university's academic staff after having spent nine years in consulting and contracting, and then in 1986 graduated with a PhD. Over the years he has lectured and published on a variety of subjects, but mainly on geotechnical engineering. Since 2016 he has been working full-time on research topics in the university's civil engineering laboratory and is currently developing techniques and equipment to enable the rapid testing of foundation piles to be done inexpensively in South Africa.

