


Services on Demand
Article
 English (pdf)
 Article in xml format
 Article references
Indicators

Related links
-
 Cited by Google
 -
 Similars in Google
Share

 Permalink
Journal of the South African Institution of Civil Engineering
On-line version ISSN 2309-8775
Print version ISSN 1021-2019
J. S. Afr. Inst. Civ. Eng. vol.63 n.1 Midrand Mar. 2021
http://dx.doi.org/10.17159/2309-8775/2021/v63n1a4
TECHNICAL PAPER
The variability in commercial laboratory aggregate testing for road construction in South Africa
I J Breytenbach; H G Fourie
ABSTRACT
Simple data comparisons were undertaken using project data to illustrate the need for duplicate test analyses in road construction material investigations for hard rock aggregate sources.
Test data was sourced from projects commissioned by the South African National Roads Agency SOC Limited (SANRAL). All test results except the polished stone value were reported by commercial geotechnical laboratories that are accredited with the South African National Accreditation System (SANAS). Only samples subjected to duplicate test analyses were used, as this method allows direct comparisons. The tests used for comparison included the polished stone value, wet and dry versions of the Aggregate Crushing Value test, wet and dry versions of the 10% Fines Aggregate Crushing Value test, the ethylene glycol-soaked version of the 10% Fines Aggregate Crushing Value test, and the water absorption test of both the fine (-5.00 mm) and coarse (+5.00 mm) material fractions.
The results show that duplicate testing is firmly justified, as test results reported were often highly variable, despite all participating laboratories being SANAS-accredited and using standardised methods. Further consideration was then given to the additional cost of duplicate testing at project stage investigations compared to the cost implications of having erroneously reported materials failing in service or having good-quality materials rejected.
Keywords: hard rock aggregate, aggregate crushing value, 10% fines aggregate crushing value, polished stone value
INTRODUCTION
Intrusive material investigations are frequently undertaken in South Africa with the intention of procuring construction gravel or aggregate materials for road construction. However, due to challenging economic conditions globally and locally, project funds for comprehensive material investigations are often constrained or allocated to other aspects of a road construction project. This is unfortunate, as the materials used for road construction literally form the foundation of such construction projects. With the limited funds, it is even more difficult to motivate that material investigation laboratory tests should be performed in duplicate and verified at an additional cost.
The South African National Standard (SANS 17025 2018) - which specifies general requirements for competence of testing and calibration for laboratories -recognises that many factors may influence the correctness and reliability of tests performed. Hence, the specification addresses each of the following factors separately:
■ Human influencing factors
■ Accommodation and environmental factors
■ Test or calibration methods and method validation
■ Equipment
■ Measurement traceability
■ Sampling
■ Handling of test and calibration items Variability of test results increases with inter-laboratory testing due to all the possible variables listed above. For this reason, laboratories are required to participate in inter-laboratory testing or proficiency testing schemes. SANAS (2016a; 2016b) requires that accredited laboratories should participate in proficiency testing schemes covering the scope of accreditation over a period not exceeding five years.
The issue of duplicate testing has become hotly contested, with many arguing that laboratory test results should be accepted as issued, because SANAS accreditation for the commercial laboratories performing the test analyses is mandatory (as specified on project tender requirements). Those in favour of duplicate testing counter that unverified test results come with inherent risk, and that the cost of duplicate testing is negligible compared to the cost implications of a problematic aggregate material which prematurely fails in service.
Properties of soil - and in this case aggregate - materials are affected by a number of aspects, including the inherent nature of the material itself, sampling disturbances, a measurement error and statistical uncertainty associated with the number of tests performed (Juang et al 2019). Jacobsz and Day (2008) highlighted the variability in the results of Atterberg Limits reported on the same sample by different commercial geo-technical laboratories in South Africa and the implications of using erroneous results in geotechnical design. A similar exercise was undertaken by Theron et al (2015) who considered the results of hydrometer tests performed by multiple laboratories on the same sample materials - the outcome of the comparison was described as troublesome. Another example is given by Takács and Mahler (2011) who compared results produced by 63 laboratories in Hungary, testing more than 500 samples on eight separate sample groups.
However, while literature on the reliability or reproducibility of soil materials is fairly readily available, similar discussions on aggregate material tests were found to be extremely limited, especially in the South African environment, and more specifically for South African aggregate tests. Moreover, literature related to aggregate tests mainly focus on concrete production - for example Grieve (2002) -and not on road construction aggregate, despite some overlapping tests between the two applications. Dumas (2000) compiled a proposed appendix to the Technical Methods for Highways (TMH1) series widely used in South Africa. The document comprehensively considers the reliability of test results and, amongst other aspects, takes into account the statistical significance of test results and their variability.
The TMH1 series of tests was replaced by SANS 3001, which includes a series on the determination of uncertainty of measurement, repeatability, reproducibility and bias, i.e. SANS 3001-PR1 (SANS 2010), as well as an assessment of repeat, check or duplicate tests, i.e. SANS 3001-PR2 (SANS 2011). The latter standard provides guidelines to assess duplicate tests by calculating the permissible range between the primary and duplicate test results.
The approach followed in this comparison differs from that followed by Jacobsz and Day (2008) and Theron et al (2015) in that where these authors submitted the same sample to multiple laboratories for comparison, this study considers multiple samples tested in duplicate only, and as such a detailed statistical analysis on variance between different laboratories' results is not possible due to limited data. Instead, the discussion intends to highlight the high degree of variation in test results on individual samples tested in duplicate, despite participating laboratories being SANAS-accredited for the tests performed, with the exception of the polished stone value (PSV) for which none of the laboratories had SANAS accreditation.
METHODOLOGY
Data was captured from existing projects commissioned by SANRAL tasked with identifying and proving sources of suitable hard rock aggregate materials to be quarried for various purposes (e.g. base course, surfacing stone, etc). During the course of the projects, duplicate tests were performed on selected samples, and only certain critical tests or samples were duplicated. Samples were produced from drill core retrieved during intrusive drilling, which was grouped into batched samples and crushed using a laboratory crusher. Test duplication was to be done by splitting the nominated sample after sample preparation. One half of the sample was tested by the primary laboratory (i.e. primary tests) while the second half was sent to a second, independent laboratory (i.e. duplicate tests) to perform the same test, using the same standardised test method. The reasoning behind this approach was that by splitting the sample, the test material should be practically identical and therefore comparing test results directly should be possible.
Preference for duplicate testing was given to tests which have lower or upper limit specifications in COLTO (1998) and/ or SANRAL (2013). After reviewing the available project data, which included duplicate test values, the following tests were selected for comparison:
■ Polished Stone Value (SANS 5848)
■ Aggregate Crushing Value (SANS 3001: AG10) - dry test
■ Aggregate Crushing Value (SANS 3001: AG10) - wet test
■ 10% Fines Aggregate Crushing Value (SANS 3001: AG10) - dry test
■ 10% Fines Aggregate Crushing Value (SANS 3001: AG10) - wet test
■ 10% Fines Aggregate Crushing Value (SANS 3001: AG15) - ethylene glycol-soaked test (basic crystalline materials only)
■ Water Absorption of the +5.00 mm sample fraction (SANS 3001: AG20)
■ Water Absorption of the -5.00 mm sample fraction (SANS 3001: AG21)
Material Sample Selection
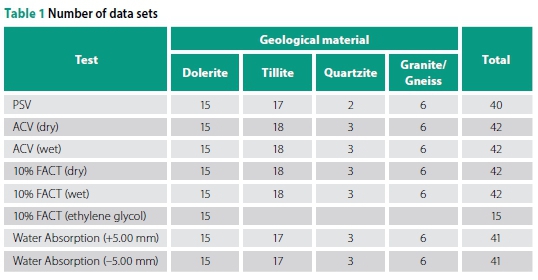
Following the identification of preferred test methods, suitable project result data had to be selected. The selected test data was sourced from fourteen project sites on various geological bedrock types. The tests were performed by a total of seven different commercial laboratories, all of which are SANAS-accredited for the tests under consideration, except the PSV test. The geological composition of the data set is summarised in Table 1.
Statistical Analyses
Data sets were entered into a spreadsheet and each material test was used for a separate analysis. The test result data for each test method was used to perform a general statistical analysis (i.e. descriptive statistics) which was supplemented by a simple correlation analysis between the primary and duplicate test results in order to determine the correlation coefficient. The results of the statistical analyses will not be discussed in depth, but relevant aspects will be highlighted in the following sections.
Direct Simple Comparison
In order to directly compare results of primary and duplicate tests, it was decided that the simplest and most direct method would be to illustrate the results graphically. Scatter plots were prepared for each type of test used, plotting the sample number on the x-axis and the two test results (i.e. primary and duplicate) on the y-axis. In this manner the primary and duplicate test results can be compared easily. The scatter plots were further refined to distinguish between the seven participating laboratories that supplied results. Results were then further assessed according to SANS 3001 PR2 (SANS 2011) in order to assess the variability in the results.
RESULTS
Polished Stone Value (PSV)
The comparative plot of results for the PSV tests is illustrated in Figure 1. From the graph it is clear that the correlation between the primary and duplicate test results is extremely poor. This is reflected by a correlation coefficient of -0.19. Lab 4, in particular, reported highly variable results that were generally strongly contradicted by duplicate testing. Sample 9, for example, returned primary and duplicate test results of 51 and 79, respectively. Results from remaining laboratories were somewhat less variable, but when considering the sensitivity of the PSV test, the results are still considered questionable. Perhaps the best correlation of results in this data set is reflected by Lab 2 and Lab 5. However, in the entire data set the primary and duplicate test results matched only on two instances (i.e. sample 29 and sample 31).
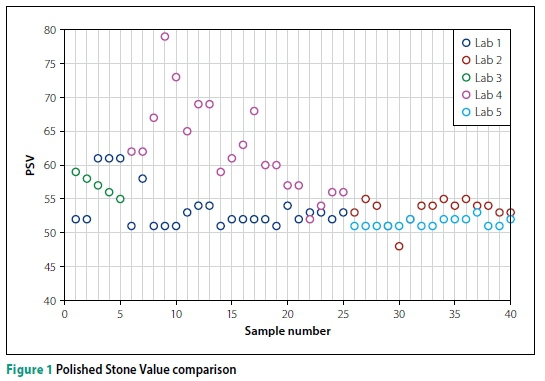
Apart from the poor correlation between test results, the case of sample 30 needs further consideration. For the projects from which data was sourced, a minimum PSV of 50 was required. In the case of sample 30, the primary test reported a PSV of 51; however, the duplicate test result reported a PSV of 48. This difference could be pivotal in deciding whether a potential aggregate source will be used for the production of surfacing stone or not, as one result satisfies material specifications and one does not. The conundrum is then which of the two results should be regarded as accurate and how many additional verification tests should be undertaken to comprehensively prove the true result with confidence.
Aggregate Crushing Value (ACV)
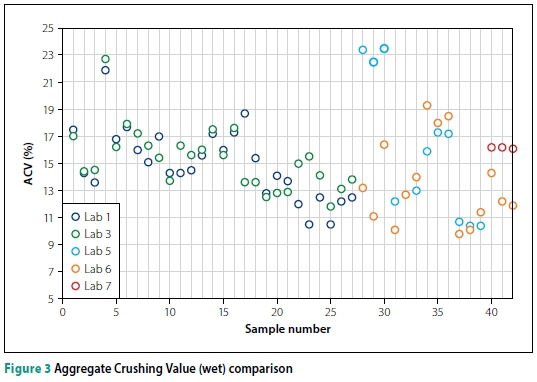
The comparative scatter plots for the dry and wet ACV tests are shown in Figures 2 and 3, respectively.
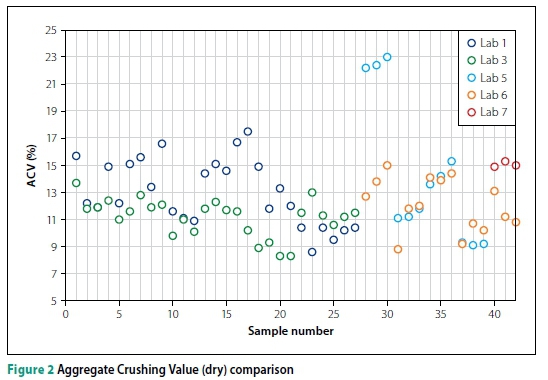
The results of the dry ACV test had a correlation coefficient of 0.50, which is a notable improvement compared to the PSV results, but still indicate unreliable results. Of the entire data set only sample 3 had a perfectly matching result (i.e. 11.9%) and samples 31 through 36 tested by Lab 5 and Lab 6 showed reasonably good correlation. However, the same two laboratories also reported the largest discrepancies (i.e. samples 28 to 30) with the maximum difference being encountered in sample 28. The primary test reported an ACV result of 12.7%, which easily satisfies the COLTO (1998) maximum (i.e. 21%) for surfacing aggregate, while the duplicate test result reported 22.2 %, which fails the same specification. The duplicate test result is therefore almost double that of the primary test result for the same material sample. Throughout the remainder of the data trends can arguably be seen, but data is simply too erratic to make sensible inferences. Applying the principles of SANS 3001 PR2 (SANS 2011), 13 of the 42 test results (i.e. 31%) exceeded the permissible range, rendering those results "unacceptable".
Results of the wet ACV tests were unsurprisingly similar to that of the dry test, though the correlation coefficient between the primary and duplicate test results was fractionally lower (i.e. 0.47). The results of Lab 1 and Lab 3 showed marked improvement for samples 1 through 16, compared to the corresponding dry test results. In contrast to this, the conflicting results of samples 28 to 30 persisted, with sample 29 showing a difference of 11.4% in reported results. This discrepancy - for both the dry and wet test - was ultimately traced back to an error made by the testing technician. Applying the principles of SANS 3001 PR2 (SANS 2011), 7 of 42 test results (i.e. 17%) exceeded the permissible range, rendering those results "unacceptable".
10% Fines Aggregate Crushing Value (10% FACT)
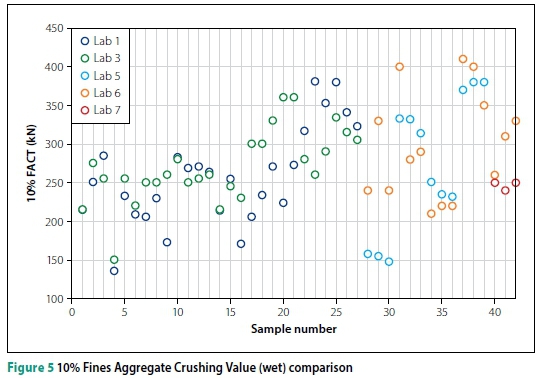
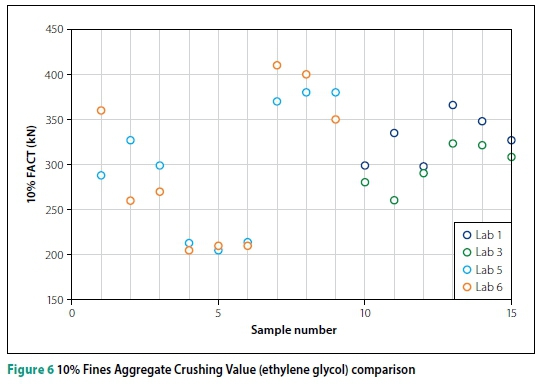
The comparative results of the 10% FACT dry and wet tests are shown in Figures 4 and 5, respectively, and the two figures have corresponding sample test numbers plotted on the x-axis. Figure 6 shows a comparison of the ethylene glycol-soaked version of the test, albeit with far fewer data sets, as only basic crystalline materials were subjected to this test and hence sample numbers for Figure 6 do not correspond to those of Figures 4 and 5.
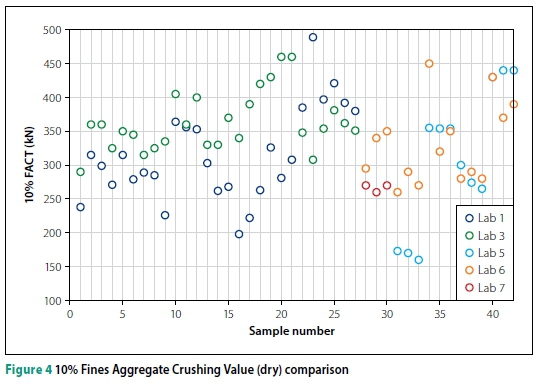
The data for the dry tests shows very poor correlation, with discrepancies between the primary and duplicate test results of up to 181 kN (i.e. sample 23). Sample 23 consisted of dolerite material and hence the minimum specification limit for crushed stone base course of the 10% FACT (dry) test is 110 kN (COLTO 1998). While both the primary result (308 kN) and the duplicate test result (489 kN) for this sample easily satisfy the specified limit, the fact that the variation between the two results is larger than the actual minimum specification value is disconcerting. Only one sample (i.e. sample 40) had an exact match between the primary and duplicate test results, and overall the correlation between the remaining data sets is considered poor at best, with a correlation coefficient of 0.40. Of interest, only one result (sample 23) exceeded the permissible range for 10% FACT when tested in accordance with SANS 3001 PR2 (SANS 2011).
However, it was concluded that the method of assessment becomes less sensitive at higher values, resulting in the results being considered acceptable despite the poor correlation. The materials assessed here are of a high quality, with 10% FACT results well above the required specification, but should results be notably lower (e.g. at or below specification values), the analysis would be notably more sensitive.
Results of the wet 10% FACT tests exhibited similar properties to those of the dry tests, though variations were marginally less severe and the correlation coefficient improved slightly to 0.58. Applying the principles of SANS 3001 PR2 (SANS 2011), 4 of the 42 test results (i.e. 10%) exceeded the permissible range, rendering those results "unacceptable".
In contrast to the dry and wet versions of the 10% FACT test, the ethylene glycolsoaked tests had a correlation coefficient of 0.82 between the primary and duplicate test sets. This is a substantial improvement over the dry and wet versions of the test, but the results should be interpreted with caution, as only 15 test sets were available for the ethylene glycol-soaked version of the test (compared to 42 test sets for the dry and wet tests). SANS 3001 AG15 does not include evaluation formulae for the calculation of uncertainty and hence SANS 3001 PR2 (SANS 2011) could not be applied.
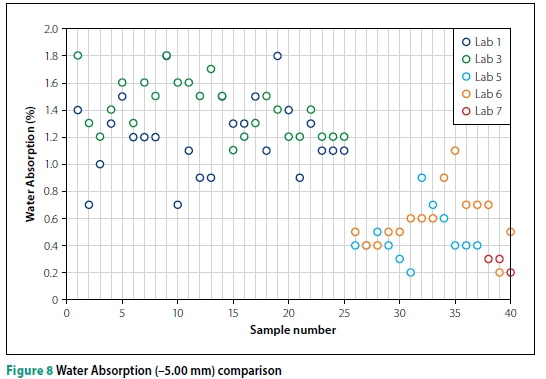
Water Absorption
The final comparison is between the water absorption reported for the coarse fraction (Figure 7) and the fine fraction (Figure 8) of the test samples.
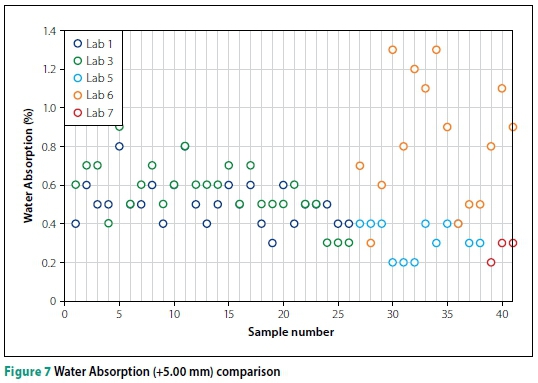
The correlation coefficient of the coarse fraction was recorded as -0.26; however, the data is overall skewed by the very poor correlation of results for samples 26 through 40. Lab 6, in particular, produced highly erratic results compared to the remaining results which in general showed differences of between 0.1% and 0.2%. The principles of SANS 3001 PR2 (SANS 2011) indicate that 19 of 41 test results (i.e. 46%) exceeded the permissible range, rendering those results "unacceptable". It should be noted that the uncertainty of measurement for water absorption tests is based on the bulk density and apparent density of the material, and not on the actual water absorption. The acceptable range in this case was based on the apparent density for aggregate.
Critically, the erratic results reported by Lab 6 exceeded the COLTO (1998) limit for coarse aggregate for asphalt (i.e. 1.0%) significantly on a number of occasions (i.e. samples 30, 32, 33, 34 and 40), while the duplicate test results for the same samples were all below 0.4% and well within the maximum specification. This clearly illustrates a serious problem. Primary and duplicate test sets reported identical results on seven occasions and, considering the fairly simple nature of the test, it would be expected that this would have happened more frequently. The origin of the large discrepancy resulting from results issued by Lab 6 was ultimately identified to be a devia tion from the test method by an inexperienced technician. This in itself highlights the importance of technician training and certification to perform specific tests.
Despite the much-improved correlation coefficient of the water absorption for the fine fraction data (i.e. 0.79), results still compare relatively poorly. Primary and duplicate test results were identical on only three occasions, while the largest single difference in results was reported as 0.9% (i.e. sample 10). Applying the principles of SANS 3001 PR2 (SANS 2011) once more, 30 of 41 test results (i.e. 73%) exceeded the permissible range, rendering those results "unacceptable".
In this data set seven samples conflicte with regard to passing or failing the maximum water absorption of 1.5% allowed by the COLTO (1998) specification, while one sample was confirmed to fail by both primary and duplicate tests. As before, the degree of variation for such a relatively sim ple test is a serious concern. For example, sample 10 reported a primary result of 1.6% water absorption while the duplicate result reported only 0.7%. Though this is an extreme example, it illustrates the problem well in that one result is less than half of the other.
DISCUSSION
In order to further illustrate the difference between primary and duplicate test results concisely, Figure 9 shows direct comparisons between the test results. From the regression coefficients (R2) it is clear that there are large shortcomings in reliability. The significance of the poor relationship between the primary and duplicate test results is not only of theoretical significance. One should consider the practical and financial implications of using only a single set of unverified and possibly erroneous test results. To illustrate the point, the following two scenarios can be considered:
■ Scenario 1: A site is investigated as potential hard rock quarry; however, unverified test results inaccurately report lower than true values which happen to fall below the minimum material specification. The site is disqualified from use, and the funds and time utilised investigating the site are wasted. Even worse, additional funds and time are required to investigate and prove a new site, while the original site was in fact suitable, and the project is delayed with contractual and cost implications.
■ Scenario 2: A site is investigated as potential hard rock quarry. The unverified laboratory analyses inaccurately overestimate test results and report them to be within specification when, in fact, they fall below specification. The source is subsequently approved for material production and is used in construction, but ultimately the aggregate material fails prematurely in service because of its inferior quality. Costs are incurred to identify a new suitable source of aggregate and the road must be repaired, or worse, rebuilt at great expense.
The scenarios above hold substantial practical and financial risk for virtually all parties involved; however, the second scenario clearly holds the largest risk as the implication of premature pavement failure is dire. Regardless of the scenario, duplicate testing could be used to identify inaccuracies or problems with test results which could be addressed timeously and without incurring potentially severe financial repercussions and project delays. Coincidentally, duplicate testing identified at least three serious discrepancies in project data used for the analyses reported here and allowed the source of the discrepancies to be identified and addressed timeously. The cost of duplicate testing amounts to only a fraction of the cost of repairing or rebuilding a failed road section or repeating the investigations for an alternative material source.
The cost of periodic maintenance (e.g. resealing) for a single carriageway road with an assumed width of ten metres typically ranges from R2.0 million to R3.0 million per kilometre, as summarised by SANRAL's Annual Integrated Report for 2019 (SANRAL 2019) and indicated in Table 2. Similarly, the cost of rehabilitation or partial reconstruction would be at least ten times the cost of resurfacing. The total cost of all duplicate tests considered in this research comparison amounted to less than R1.0 million, which is negligible compared to the high cost of road construction and maintenance. Therefore, insisting on duplicate tests to ensure reliable test results, will recoup the costs of the duplicate tests within the first kilometre of a typical reseal project if scenarios 1 or 2, as mentioned earlier, can be avoided.
In cases where large variations occur between primary and duplicate test results, additional tests can be performed to determine - with confidence - which set of test results is reliable and reproducible. In this manner, a laboratory can also make sure that equipment and reporting techniques are as they should be. This, however, has practical problems, too, as funds have finite limits and verification testing cannot be conducted on an indefinite number of samples until satisfactory (i.e. statistically acceptable) results are produced. It is further time-consuming and project timelines do not make provision for additional testing.
CONCLUSION AND RECOMMENDATIONS
Actual project data was presented as proof that confirmation test analyses are required in order to verify material test results. While minor discrepancies are inevitable and test results are practically unlikely to match precisely under real-world conditions, variations were often not acceptable. In this case, data from fourteen high-quality hard rock quarry projects was used where duplicate tests were performed. A simple comparison between specification test results clearly illustrated that the relationship between primary and duplicate test results is often inconsistent and that the test results are therefore treated with scepticism, despite all participating laboratories being SANAS-accredited and using standardised test methods. In this case study, material sources were of a high quality and hence the majority of test results fall well within material specification, despite frequent large variations. However, the implications of unreliable test results will become more severe where materials are within closer bounds (i.e. borderline cases) to material specification limits.
It is also disconcerting that technical signatories of the commercial laboratories involved with the projects used in this comparison issued material test results -which reflected both the primary and duplicate test sets on one document -without revisiting results that were clearly highly variable or questionable.
Based on the findings of this comparison it is recommended that material test schedules for hard rock quarry material investigations also make provision for (at least limited) duplicate testing as a measure of quality control. The principles of SANS 3001 PR1 (SANS 2010) and SANS PR2 (SANS 2011) must be applied to determine if the range between primary and duplicate test results are within acceptable limits for the respective test. Large discrepancies in test results must be identified, and where necessary additional tests of the same sample material must be undertaken to identify which test result set is in fact correct, and also to back-trace the origin of the erroneous results to establish the root cause. As specified in SANS 17025 (SANS 17025 2018), the responsibility rests with the laboratory to undertake a root cause analysis.
Estimation of uncertainty of measurement for soils and gravels is better defined, probably due to the high frequency and volume of testing concerned with these materials. However, in the case of aggregate testing, further research is required to determine the maximum systematic error to enable laboratories to identify erroneous test results. This is not possible without verification testing. Uncertainty of measurement is often underestimated or even ignored by design engineers, technologists and technicians when assessing material test results.
Compared to the cost of repairing or rebuilding a road section due to premature failure ascribed to the use of inferior aggregate material, the additional cost of duplicate tests is negligible. Seen in a bigger context, the additional cost of duplicate test analyses can massively reduce the financial and practical risk to any road construction project.
ACKNOWLEDGEMENT
The authors acknowledge the South African Roads Agency SOC Limited for permission to use selective project data.
DISCLAIMER
The views expressed by authors are in their personal capacity and do not reflect SANRAL's viewpoint or policy.
REFERENCES
COLTO (Committee of Land Transport Officials) 1998. Standard Specifications for Road and Bridge Works for State Road Authorities. Halfway House: South African Institution of Civil Engineering (SAICE). [ Links ]
Dumas, B (Provincial Administration, Western Cape) 2000. General technical information: Proposed document as an appendix to the TMH series. Unpublished document. [ Links ]
Grieve, G R H 2002. Inter-laboratory proficiency evaluations between several Gauteng-based concrete and aggregate testing laboratories. Journal of the South African Institution of Civil Engineering, 44(1): 31-34. [ Links ]
Jacobsz, S W & Day, P 2008. Are we getting what we pay for from geotechnical laboratories? Civil Engineering, 16(4): 8-11. [ Links ]
Juang, C H, Zhang, J, Shen, M & Hu, J 2019. Probabilistic methods for unified treatment of geotechnical and geological uncertainties in a geotechnical analysis. Engineering Geology, 249: 148-161. [ Links ]
SANAS (South African National Accreditation System) 2016a. Regulatory document R-48-04: Proficiency Testing and other Comparison Programme Requirements for Calibration Laboratories. Pretoria: SANAS. [ Links ]
SANAS (South African National Accreditation System) 2016b. Regulatory document R-80-03: Proficiency Testing and other Comparison Programme Requirements for Testing and Medical Laboratories and Blood Transfusion Services. Pretoria: SANAS. [ Links ]
SANRAL (South African National Roads Agency Limited) 2013. SAPEM 2013. South African Pavement Engineering Manual. Chapter 4: Standards. Pretoria: SANRAL. [ Links ]
SANRAL (South African National Roads Agency Limited) 2019. SANRAL Integrated Report 2018/2019. Volume 1. Pretoria: SANRAL. [ Links ]
SANS (South African National Standard) 2010. SANS 3001 - PR1 (2010). Part PR1: Determination of Uncertainty of Measurement, Repeatability, Reproducibility and Bias. Pretoria: SABS Standards Division. [ Links ]
SANS (South African National Standard) 2011. SANS 3001 - PR2 (2011). Part PR2: Use and Assessment of Repeat, Check or Duplicate Tests. Pretoria: SABS. [ Links ]
SANS (South African National Standard) 2018. SANS 17025:2018. General Requirements for the Competence of Testing and Calibration Laboratories. Pretoria: SABS Standards Division. [ Links ]
Takács, A & Mahler, A 2011. Statistical evaluation of geotechnical laboratory round robin tests in Hungary. Proceedings, 15th European Conference on Soil Mechanics and Geotechnical Engineering, Athens, Greece, Vol 1, pp 293-297. [ Links ]
Theron, E, Badenhorst, W & Stott, P 2015. Duplicate testing conducted on the input parameters for the estimation of potential expansiveness of clay. Proceedings, 16th African Regional Conference on Soil Mechanics and Geotechnical Engineering, 27 April 2015, Hammamet, Tunisia. [ Links ]
 Correspondence:
Izak Breytenbach
PO Box 73478 Lynnwood Ridge
Pretoria 0040, South Africa
T: +27 12 991 0426; E: izak@soilkraft.co.za
Gerhard Fourie
Private Bag X19, Bellville 7535 South Africa
T: +27 21 957 4600 E: fourieg@nra.co.za

DR IZAK BREYTENBACH (Pr Sci Nat) obtained his PhD in engineering geology at the University of Pretoria in 2016 and is a registered professional natural scientist. He works as an engineering geological and geotechnical consultant in multiple fields. He has ex tensive experience in identifying and investigating potential new hard rock aggregate sources, or investigating existing material sources, specifically for the supply of road construction aggregate.

GERHARD FOURIE (Pr Tech Eng) has 24 years' experience in road pavements and materials. As Project Manager: Materials and Pavement Engineering at SANRAL (South African National Roads Agency Limited) since 2010, his core function is to provide specialist input on designs for asphalt, chip seals and pavements, including geotechnical projects, drilling and materials investigations. Other experience includes materials specifications, construction and quality control. He serves on several industry working groups in developing and promoting the latest design standards, specifications and best practice. He obtained his BTech degree in Civil Engineering at the Tshwane University of Technology in 1999 and is registered as a Professional Engineering Technologist at the Engineering Council of South Africa.

