


Services on Demand
Article
 English (pdf)
 Article in xml format
 Article references
Indicators

Related links
-
 Cited by Google
 -
 Similars in Google
Share

 Permalink
Journal of the South African Institution of Civil Engineering
On-line version ISSN 2309-8775
Print version ISSN 1021-2019
J. S. Afr. Inst. Civ. Eng. vol.63 n.1 Midrand Mar. 2021
http://dx.doi.org/10.17159/2309-8775/2021/v63n1a3
TECHNICAL PAPER
Reliability performance of bridges designed according to TMH7 NA load model
R Lenner; S E Basson; M Sýkora; P F Van der Spuy
ABSTRACT
The current code of practice for the design of highway bridges in South Africa is called Technical Methods for Highways 7 (TMH7). It was first published in 1981 and is largely based on the loading provisions of the BS5400. The purpose of this study is to carry out an investigation into the reliability performance of new highway bridges designed according to TMH7. Past studies have identified deficiencies in the traffic load model. A case study considering isolated traffic load effects and sagging moment on a simply supported bridge indicates that NA loading generally performs well for spans ranging from 15 to 50 metres. However, a poor reliability performance is seen for short-span narrow bridges, especially for 5 m and 10 m spans where the number of traffic lanes is equal to the number of notional lanes for NA loading. To study the reliability performance of a critical element, flexural behaviour of a 20 m twin-spine simply supported deck is then investigated. The results agree with the first case study. It is, however, recommended to verify the presented findings by investigation based on data from other heavy-freight routes and to account for continuous structures and shear load effects.
Keywords: bridge loading, structural reliability, WIM data, TMH7, traffic loads
INTRODUCTION
The structural performance of bridges is essential in ensuring a sound road transport network. The current code of practice for the design of highway bridges in South Africa is called Technical Methods for Highways 7 (TMH7) (CSRA 1998). It was first published in 1981 and is largely based on the loading provisions of the British Code BS5400, which has since been updated and superseded by the Eurocodes. Since TMH7's last revision in 1988, the road freight industry has expanded significantly, encouraged by an economic deregulation of road transportation in 1988, and further exacerbated by changes to the traffic regulations in South Africa. As a result, concern is raised as to whether TMH7-based design delivers adequately safe bridges for the current traffic demand.
The purpose of this study is to carry out an investigation into the reliability performance of new highway bridges designed according to the NA load model of TMH7 (Basson & Lenner 2019). Past studies have identified deficiencies in TMH7's traffic load model for normal traffic conditions, known as NA loading (Oosthuizen et al 1991; Anderson 2006; Van der Spuy & Lenner 2018). In response, this study focuses on the reliability performance of TMH7 for normal traffic conditions. The performance of a bridge at the ultimate limit state (ULS) is also investigated, with the traffic load effect taken as static bending moment at midspan of a simply supported bridge (excluding dynamic effects arising from the complex vehicle-structure interaction). Furthermore, this study investigates only the free-flow traffic, which is typically assumed to govern extreme traffic load effects for short- to medium-span bridges ranging from 5 to 50 metres (Bruls et al 1996).
In achieving the study's purpose, reliability analyses are performed for two case studies based on actual traffic load effects derived from site-specific weigh-in-motion (WIM) data. For each analysis, a reliability index is obtained which is indicative of the safety level of the structure. The results are compared to target reliability indices from existing standards to draw inferences regarding the reliability performance of TMH7 for normal traffic conditions.
The two case studies are based on WIM data obtained from stations of two different national routes. The first case study is based on WIM data from Roosboom Station on National Route 3 (N3) between Durban and Johannesburg - this was selected as Roosboom had served as a reference station in previous studies (Lenner et al 2017; Van der Spuy & Lenner 2018; Pérez & Lenner 2019). The second case study is based on WIM data from National Route 1 (N1) near Kilner Park, as used in the study of multiple-lane presence factors (Van der Spuy et al 2019b).
The scope of each case study is dictated by the number of traffic lanes measured at the WIM site. For Roosboom only the slow (outer) lane data is available, which is a limitation for a full probabilistic reliability analysis. This is why the focus is only on the modelling of traffic load extremes. Using the semi-probabilistic approach, EN 1990 (EN 2002) and ISO 2394 (ISO 2015), the traffic load effects are assigned with a fixed sensitivity factor α and the design value is derived from the data as an appropriate fractile of a fitted probability distribution. A second case study based on the data from Kilner Park then provides a fully probabilistic reliability analysis. Two lanes per direction are measured at this site and it is therefore possible to develop a meaningful loading due to collected WIM data on a typical bridge deck. A 20 m two-lane, single-span bridge is selected as a representative example. A critical element reliability analysis is carried out including the resistance, permanent and traffic load effect variables. A sensitivity analysis follows to determine the relative significance of the basic variables on the obtained reliability indices.
This study is based on the derived load effects from previous work by Van der Spuy & Lenner (2019a), who used cleaned and calibrated WIM data in a moving load analysis to derive the traffic load effects for various span lengths and structural systems. Utilisation of already derived load effects is somewhat limiting, as it is difficult to investigate subsets of the data and to identify the critical loading events such as two vehicles in the same lane at a critical gap. Van der Spuy & Lenner (2019a) also found it difficult to distinguish in WIM data between illegally overloaded standard trucks and permit trucks. Since overloading is a growing concern in South Africa (DOT 2013; Lenner et al 2017) and the NA loading in TMH7 should provide the provision for overloading of legal vehicles (Anderson 2006), the whole data set of traffic load effects is considered in this study.
Uncertainty in WIM is neglected in the presented analysis. Two previous studies by Jacob and Feypell-de La Beaumelle (2010), and Morales-Nápoles and Steenbergen (2014) classified WIM systems into low-speed (5-15 km/h) and high-speed (normal speeds of the traffic flow). The latter - of interest here - are expected to have an accuracy of 10-25% for 95% of vehicles, while the accuracy of the former is much higher (estimated to be 3-5%). The accuracy depends on the calibration of a WIM system; the key issue is to remove possible biases, particularly for high vehicle weights. When the bias is correctly removed (as is assumed in this study), uncertainty in WIM measurements is deemed to have a small influence on predicted traffic load effect extremes.
De Wet (2010) shows that WIM errors in South Africa are generally less than 10%. The accuracies mentioned here fall within the B(10) accuracy class of COST 323 which are suitable for the development of bridge live load studies (Jacob et al 2002). O'Connor and O'Brien (2005) show that an accuracy as low as C(15) does not have an appreciable effect on predicted extreme values. Yet, this is to be investigated in detail in further research.
OVERVIEW OF NA LOADING
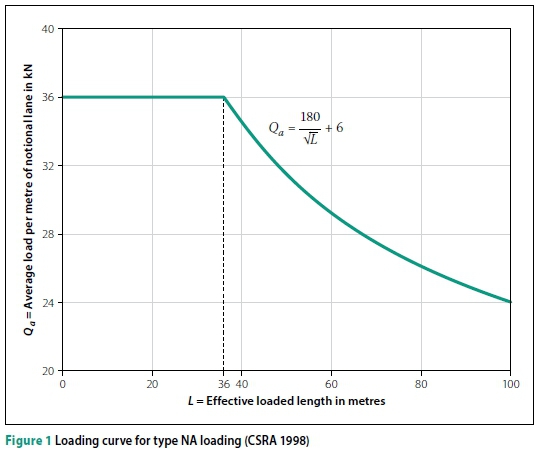
TMH7's traffic load model is provided in Section 2.6 of Part 2 of TMH7 (CSRA 1998), where three types of live loading are defined: normal loading (NA), abnormal loading (NB) and super loading (NC). Typical requirement by the authorities for all highway bridges is at least an envelope of load effects due to NA loading and a 36-unit of NB loading (CSRA 1998). The NA load model utilises a floating notional lane width, where the number of notional lanes depends on the carriageway width (refer to Section 2.6.2. in TMH7). The notional lanes do not represent actual traffic lanes, but are used for the application NA and NB loading which is characterised by a uniformly distributed load applied to any continuous part of a notional lane, together with a single axle load applied to each notional lane. The uniqueness of the uniform loading is that its intensity depends on the effective loaded length defined as the aggregate length of all the loaded parts on a single or combination of notional lanes. Here "parts" refer to sections of the notional lanes that are loaded to obtain the most adverse load effects at a specific location on a bridge. The loading curve describing the application of the uniformly distributed load Qa, in accordance with the effective loaded length L, is illustrated in Figure 1. The axle load per each notional lane is given by the expression 144/Vn, where n is the sequence number of the notional lane under consideration (CSRA 1998).
In order to obtain ultimate limit state values for the design, partial factors of YfL = 1.5 and γf3 = 1.1 as provided in Section 5 of TMH7 are used. As the NA loading intrinsically accounts for dynamic effects of moving traffic by means of a "Swiss Formula" (see Section 2.6.1.3. in TMH7), this amplification is removed from the NA load model specifically for this study to enable a comparison with the load effects derived on the basis of static WIM data.
The investigation of uncertainty in dynamic effects of heavy traffic at the ultimate limit states is beyond the scope of this contribution; for further discussion see for instance work by Lenner & Sýkora (2016) and Ivankovic et al (2019).
ROOSBOOM CASE STUDY (RCS)
The first case study consists of a reliability analysis considering only the traffic load effect based on seven years of WIM data for a single lane. It is first necessary to obtain the distribution function describing the load effect and then formulate the limit state function. This enables the calculation of the reliability index by means of the First Order Reliability Method (FORM).
Overview of traffic load effect calculation
The work presented in this study is based on the load effects obtained previously by means of moving-load analysis which accounts for single-truck events and multiple-truck events (Van der Spuy & Lenner 2018). Only the sagging bending moment in increments of 5 m for 5-50 m span lengths is presented in this work to limit the scope.
Probabilistic modelling of traffic load effects
Consideration of single-loading events leads to a distribution of the load effects which need to be described by a probability distribution. There are different approaches that vary from utilising basic fitting of a normal distribution to the population or to the tail (Nowak 1993; Nowak & Rakoczy 2013; Soriano et al 2016), to the more common extreme value theory and tail fitting (Coles 2001; Caprani et al 2008; Enright 2010; O'Brien et al 2015).
A block maxima approach is adopted in this study as it is a proven and effective technique in studying extreme traffic events (Crespo-Minguillón & Casas 1997; Caprani et al 2003; Getachew & O'Brien 2007; Hajializadeh et al 2012). It essentially isolates a maximum event in each block. To utilise the technique, the underlying assumption is that the data must be independent and identically distributed (iid) (Coles 2001). The minimum size of a block is one day (Caprani 2012; Van der
Spuy 2020). However, larger blocks tend to remove variations in observations and yield data that better adheres to the iid requirement. Considering seven years of available recordings, monthly maxima of the bending moment are further used in this study. The block is large enough to reduce the variations, and there are enough blocks for the statistical description. Detailed analysis of statistical inference methods and probabilistic modelling of load effect maxima are offered by O'Brien et al (2015).
A simplified approach exploring a wide range of extreme value distribution as developed by Holický (2013) is adopted here. It is particularly useful in finding applicable models by plotting the skew-ness and the coefficient of variation of the data set against plotted distributions. Considering the monthly blocks, the sample skewness and coefficient of variation, denoted by α and V respectively, are used to plot data points on the developed diagram for each span length.
Figure 2 clearly indicates the fit of the data to various distributions including the GEV family, i.e. the Gumbel, Fréchet and Weibull distribution. The V ranges between 0.08 and 0.10, which indicates a relatively narrow distribution shape in comparison to the characteristics of daily and weekly maxima where V ranges 0.12 to 1.16, and 0.10 to 0.14 respectively. All span lengths have a positive skewness (right tail) equal to or less than 0.8, except for a 15 m span that has a small negative skewness (left tail). Furthermore, the skewness for the 10 m and 15 m spans can be observed as close to zero, which indicates a distribution that approaches a normal distribution (refer to Basson 2020 for full details).
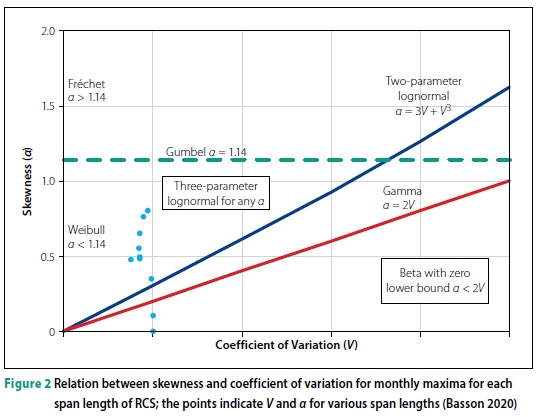
Most of the points in Figure 2 are located above the two parameter lognormal line, which suggests that the three parameter lognormal (LN3) distribution or Weibull distribution (for maxima) is appropriate for modelling the monthly maxima. The GEV distribution can be used conveniently, as it approaches the Weibull distribution when the skewness is less than 1.14. Both the LN3 and GEV distribution are asymmetrical and have three model parameters. Both models are flexible in allowing for both positive and negative skewness and can thus cater for different sample characteristics obtained from the different span lengths. As a result, the LN3 and GEV distributions are further investigated with an aim to decide on an appropriate model.
Assessment of selected probabilistic distributions
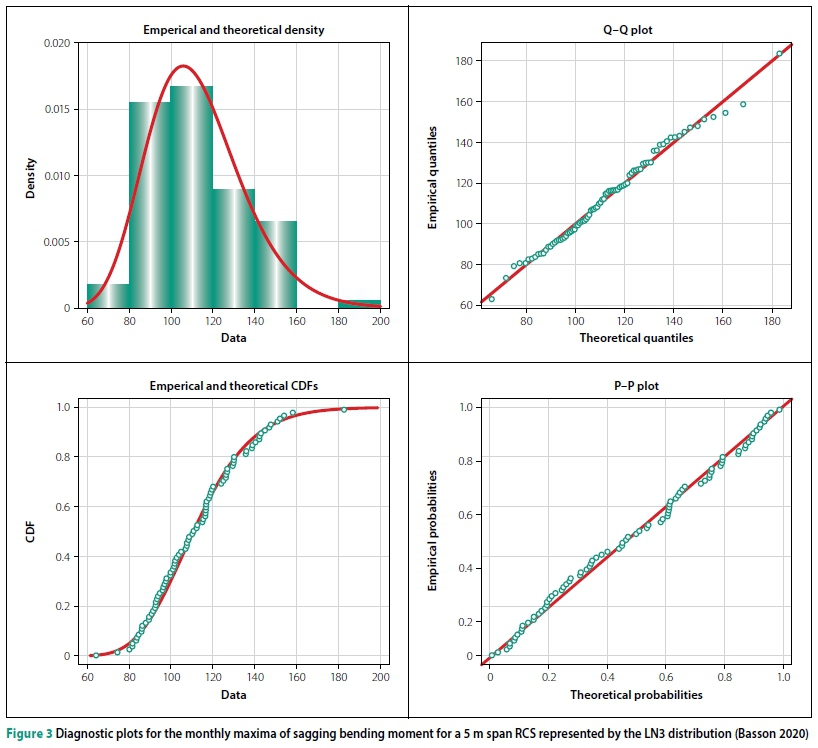
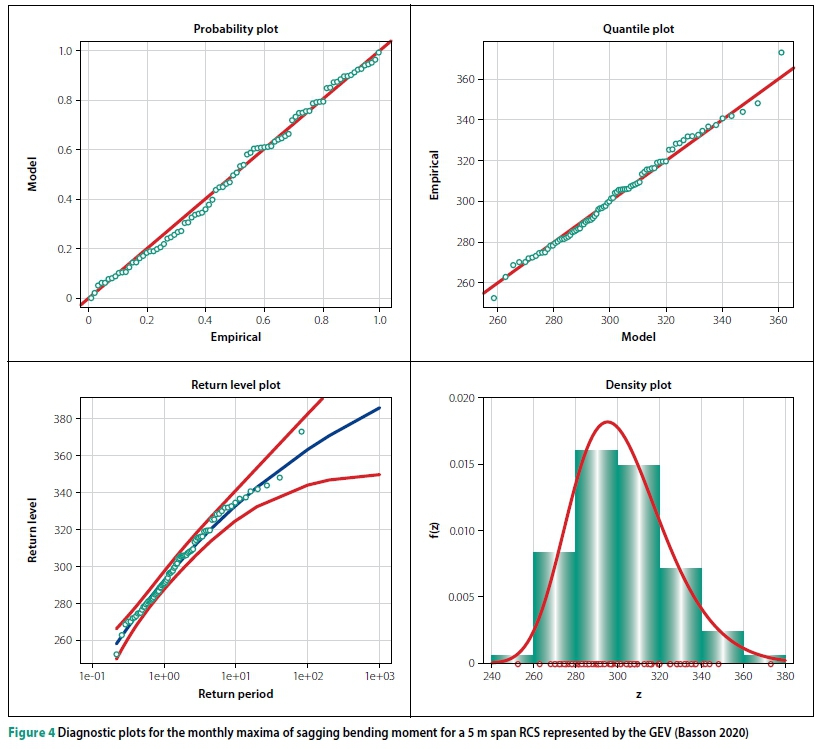
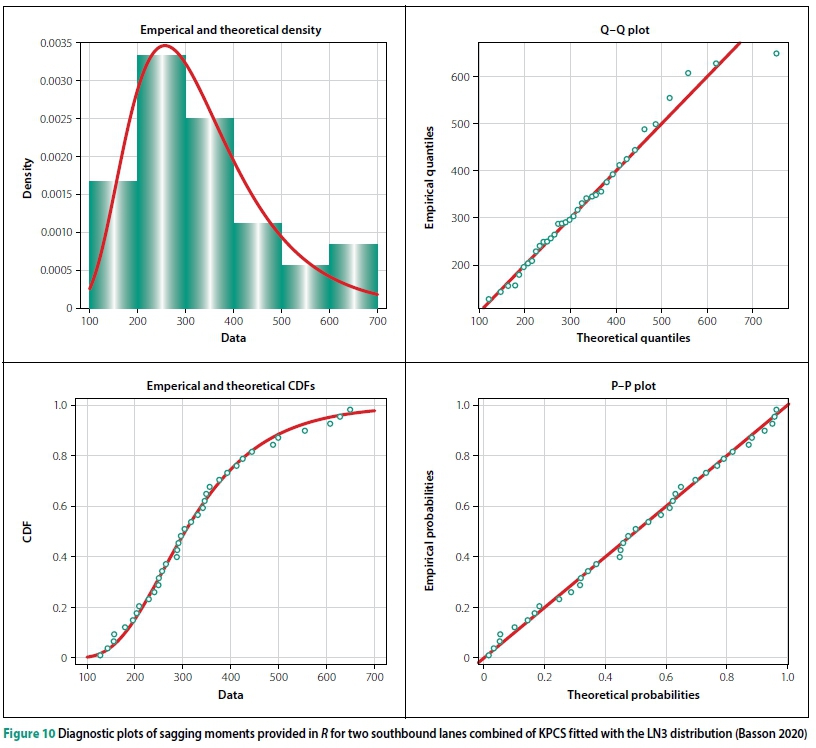
Goodness-of-fit tests performed in R (R Core Team 2018) assess the suitability of both the LN3 and GEV distribution in representing the monthly maxima. The tests consist of diagnostic plots and the modified Anderson-Darling (AD) (Ang & Tang 2006) hypothesis testing. For each considered distribution, the model parameters are inferred by the maximum likelihood estimation (MLE).
Visual inspection of the diagnostic plots for all span lengths shows that both models fit the data well. The points on the probability plots adhere to a straight line and a good fit is seen for the density plots. For illustrative purposes, the Q-Q plots obtained for a 5 m span are shown in Figure 3 for LN3 and in Figure 4 for GEV. In the figures, the following plots are included (clockwise from top left):
1. Histogram with a fitted probability density function
2. Plot with empirical and theoretical quantiles - probability paper of a theoretical distribution
3. Empirical and theoretical cumulative distribution function
4. Plot with probabilities corresponding to empirical and theoretical quantiles, providing a similar insight as the second plot.
In the second and fourth plots a straight line would indicate a perfect fit of the data by the theoretical distribution.
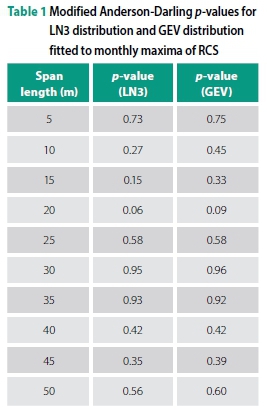
The AD test is further used as a numerical measure to substantiate the results obtained from the diagnostic plots. When the _p-value obtained from the AD test exceeds the significance level, the data can be represented by the selected model. A significance level of 0.05 is typically accepted (Fisher 2006). The LN3 distribution is converted to a normal distribution (Holický 2013). The AD test applied to the transformed data obtains p-values as provided in Table 1. The p-values exceed 0.05, which indicates that the monthly maxima can be represented by an LN3 distribution. Similar p-values were obtained for the GEV distribution, although higher values are seen for 10-20 m spans (see Table 1). The results agree with the diagnostic plots that both the LN3 distribution and the GEV distribution can be used to adequately represent the monthly maxima.
The Q-Q plots in Figures 3 and 4 suggest that upper tail behaviour is described approximately only. Detailed analysis that might improve the model for traffic load extremes will be the scope of further research.
Design load effect
The overall reliability level, described by the reliability index β, can be split into the resistance part R and load effect part E (EN 2002; ISO 2015). For this case study, the load effect part is of interest, where the reliability level is expressed with the load effect index ßEequal to αEβ. The variable cíe is a sensitivity factor of traffic load effects obtained from FORM. This describes the relative importance of the load effects in obtaining β and is accepted in this work as -0.7 for dominant action as recommended by EN 1990 (EN 2002) and ISO 2394 (ISO 2015). This aE-value is deemed appropriate for shorter spans, while it may be reduced for longer spans with the dominant dead load.
When only traffic load effects are analysed, a reliability criterion can be defined as the instance when the actual traffic load effects exceed the design load effect. A reference period of 50 years is chosen in order to provide for comparison with the target reliability commonly listed in codes such as EN 1990 (EN 2002) or SANS 10160-1 (SANS 2019). Therefore, the actual load effects derived from the WIM data should correspond to a 50-year maximum. The design load effect can then be described as a fractile of the 50-year maximum load effect distribution F50(x). The probability of failure pf is then approximated by the probability that the design load effect ed is exceeded by the traffic load effects E, as shown in Equation 1. Equation 2 is used to
estimate the overall β, where the probability distribution function of a standardised normal distribution Fu(x) relates β to pf.
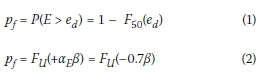
where Fu(·) denotes the cumulative distribution function of the standardised normal variable and F50(·) is the 50-year maximum load effect distribution.
50-Year maximum load effect distribution
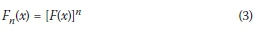
To obtain the maximum load effect distribution for a 50-year period, the monthly maxima distribution is statistically projected by raising the probability distribution function F(x) to an appropriate power n (per Equation 3). In Equation 3, n is the number of monthly maxima in a reference period, i.e. n = 600, and Fn(x) denotes the probability distribution function of the 50-year maxima, F50in Equation 1.
For each span length, the 50-year maximum load effect distribution was obtained from both the LN3 distribution and the GEV distribution of monthly maxima. Depending on the selected model, the characteristics of the projected maximum load effect distribution will differ. According to Castillo et al (2005), a lognormal distribution fitted to maximum values converges to a Gumbel distribution as the power n tends to infinity.
The Weibull distribution for maxima, represented by the GEV distribution, has a finite upper bound and its maximum domain of attraction remains a Weibull distribution (Castillo 1988). The concern with using the maximum Weibull distribution is that the upper bound remains unchanged irrespective of the reference period projected to. This means that the 50-year maximum load effect distribution has the same upper bound as the monthly maxima distribution. This could potentially be problematic, as the design load effects may exceed the bound determined by the distribution function parameters.
The physical argument that might justify the upper bound could be formulated on the basis of legal limits for axle and vehicle loads. However, the concern about frequent overloading of trucks makes this argument doubtful. Further, the LN3 distribution shows a similar fit to the monthly maxima as the GEV distribution (Figures 3 and 4), and its unbounded right tail (for positive skewness) allows for the thorough investigation of the design load effects. As a result, an LN3 distribution is adopted here for the monthly maxima.
Reliability analysis for traffic load effects
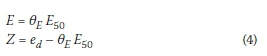
Formulation of limit state function
The limit state function Z defines the desired failure mode for the investigation as per Equation 4. Model uncertainty Θεis introduced in this contribution according to a lognormal distribution with a mean of 1.0, and a COV of 0.1 is commonly used in literature (JCSS 2001; fib Bulletin 80 2016; Von Scholten 2004). The design load effect edis a deterministic value provided by TMH7 for NA loading, while E50is described by the 50-year maximum load effect distribution with an LN3 distribution.
FORM is implemented to estimate failure probability for each span length from Equation 4; the overall reliability index β is then derived from Equation 2.
Overview of reliability analysis for different design scenarios
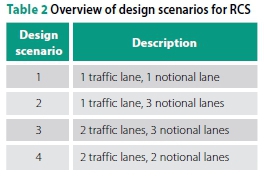
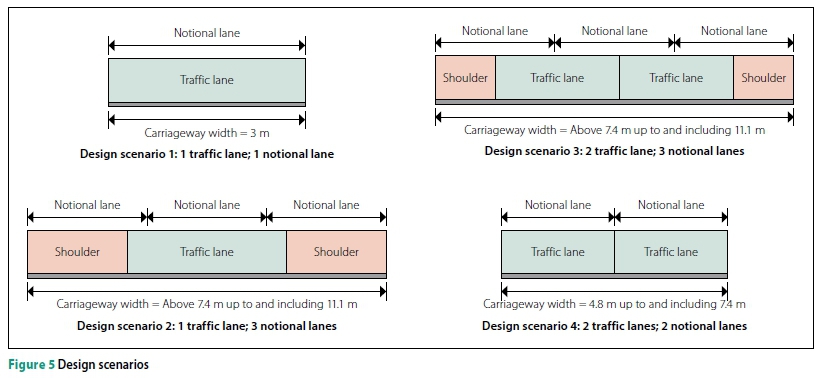
The actual traffic load effects are derived from the WIM data for a single traffic lane. To make a meaningful comparison with TMH7 it is necessary to investigate different scenarios. The concept of a notional lane as defined in TMH7 is different to the actual traffic lane, meaning that a notional lane is often narrower than a traffic lane. As a result, a number of notional lanes can be fitted to a bridge deck which in reality only carries a single traffic lane (bridges are built to accommodate not only a traffic lane, but also shoulders). Four design scenarios are defined where initially an assumption of one traffic lane corresponding to one notional lane is investigated, followed by the opposite notion of one traffic lane occupying a deck which is in reality designed for three notional lanes. The same is carried out for two possible traffic lanes and three and two notional lanes respectively. A summary of the scenarios under consideration is depicted in Figure 5 and provided in Table 2.
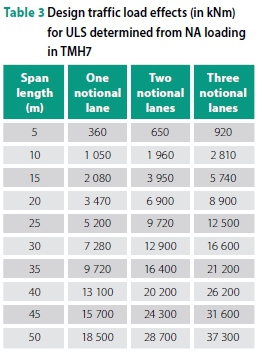
The design values of traffic load effects, ed, for each scenario given in Table 3 represent the rounded maximum obtained bending moments according to TMH7 NA loading for the midspan of a beam when designing for one, two and three notional lanes. It is important to note that dynamic effects are excluded from the NA load model based on the Swiss formula, and the ULS partial factor Yf= 1.65 is obtained as a product of YfL= 1.5 and yf3= 1.1. The calculated reliability indices β for each span length are given in Table 4.
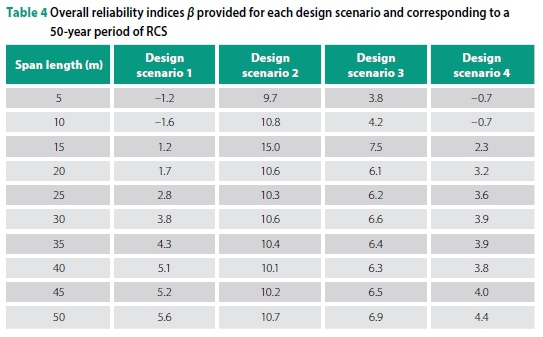
In order to make a meaningful comparison of the obtained results for a 50-year reference period, EN 1990 (EN 2002) recommends ßt= 3.8 while the South African National Standard, SANS 10160-1 (SANS 2019), uses a ßtof 3.0 for the same reference period. It is readily observed that the way each scenario is defined is fundamental to the obtained reliability index. The extreme case of one notional lane to one traffic lane shows very low ß (therefore high probability of failure) for short spans, while for spans > 25 m the performance is deemed satisfactory. The poor performance in this scenario can be contributed to the way a notional lane is defined, and that it is physically impossible to have one notional lane equal to one traffic lane. It is neglecting the mandatory shoulders on the roads - meaning the deck width is always wider than a traffic lane and therefore necessitates more notional lanes during the design.
On the other hand, the case of wide shoulders results in a scenario where three notional lanes are compared to a single traffic lane. In this case the obtained values show high reliability, mostly in excess of β = 10, leading to very low probability of failure. Care must be exercised in this case, as this is pointing only to the global action effects and it might not necessarily be true to a critical element of a bridge, for instance a single girder. Yet, it does provide an insight into the performance of NA loading and the inherent conservatism in the definition of notional lane width. Design scenarios 3 and 4 exhibit similar results, where two traffic lanes are considered and again, when the number of notional lanes is matched with the number of reflected traffic lanes, a poor reliability performance is observed. At the same time, for all considered scenarios, the longer span lengths prove to show satisfactory performance when a target ß of 3.0 or even 3.8 is considered.
KILNER PARK CASE STUDY (KPCS)
The second case study utilises three consecutive years of WIM data for the two outer traffic lanes in both directions (Van der Spuy et al 2019c). A 20 m reinforced concrete bridge with a twin spine deck is considered as a representative example for bridges in South Africa. The effect of lane loading and load distribution between two main girders is investigated.
Bridge deck analysis and design
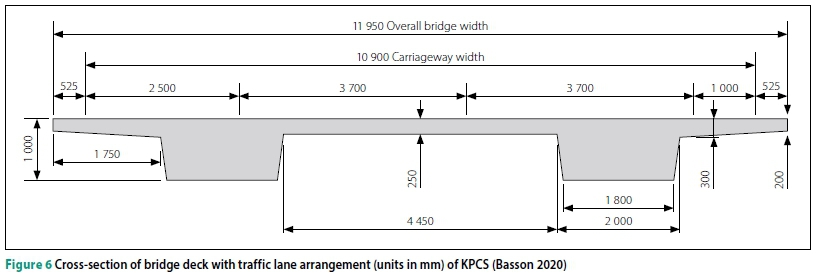
The cross-sectional properties of the designed bridge deck, together with the traffic lane arrangement, are illustrated in Figure 6. Two actual traffic lanes of 3.7 m width each are considered with necessary surfaced shoulders on both sides. The deterministic analysis reveals that the spine beam is the critical member. Note that this bridge is not skew. As the maximum of design load effects to load effects per measured vehicles is considered in this investigation, it is expected the results of the analysis would be similar for skew bridges.
The permanent loads for the design include the dead load of the bridge deck, typical F-shape Type A parapets (SANRAL 2012) and asphalt road surfacing with a thickness of 40 mm (SANRAL 2010). NA loading (excluding dynamic effects) is applied to the grillage model using three notional lanes that correspond to the considered deck width as per TMH7 requirements. The ULS mid-span moment for the considered beam according to the analysis equals to 11 600 kNm, which results in 29 Y40 (450 MPa yield strength) steel bars required for flexural resistance. The thickness of the deck here is the main factor influencing the amount of moment distribution per spine. The next section explains lateral load distribution factors used in this case.
Influence of traffic load effects on critical spine beam
The transverse stiffness of the considered superstructure is a key factor for resulting load effects due to WIM-based loading on the spine beam. By using the transverse influence line for the critical element (Figures 7 and 8) it is possible to capture the load sharing effect and determine how much of the total load is resisted by the spine. The lateral load distribution factor (LLDF) numerically describes the contribution of each WIM lane to the bending moment in the investigated girder and is located at the centre of the traffic lane. Uncertainty in the lateral load distribution is accounted in the probabilistic analysis by load effect model uncertainty, 6E, similarly to Equation 4.
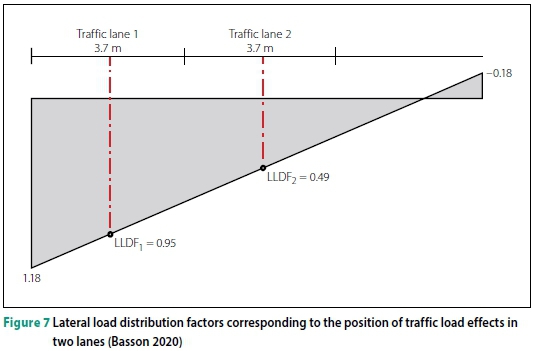
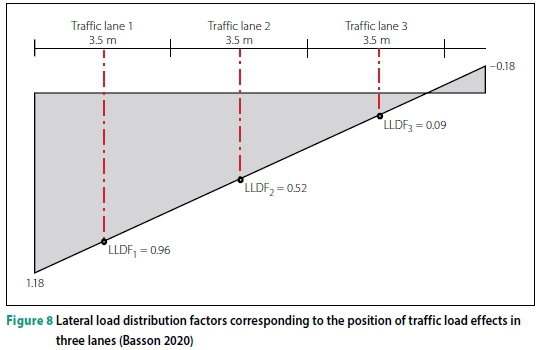
Apart from the scenario depicted in Figure 6, a further loading arrangement is investigated for the case of a bridge utilised as a three-lane deck providing a reduced lane width. The critical arrangement of WIM traffic lanes, along with the transverse influence line in this case corresponds to Figure 6. This loading scenario is provided in order to capture the possibility that a bridge initially designed for two traffic lanes with three notional lanes may actually be, under special circumstances, utilised as a three-lane bridge with reduced shoulders. It is possible to have a different thickness of the deck which would result in different LLDF factors. Due to the adopted linear shape of transverse distribution depicted in Figures 7 and 8, the change in deck thickness will result in accordingly scaled distribution factors and scaled results.
Probabilistic modelling of traffic load effects
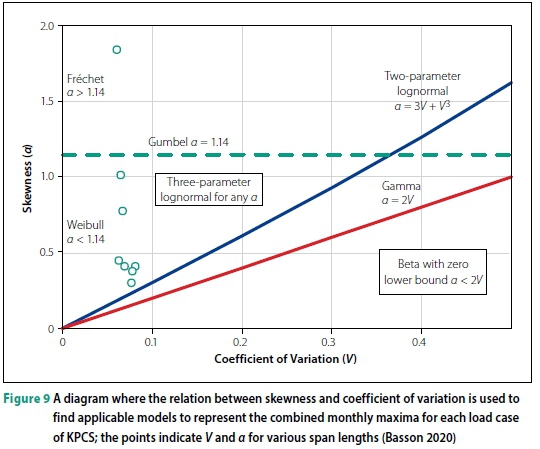
The monthly maxima combined for two opposite travel directions, representing the extreme traffic load effects for the critical spine beam, are modelled and assessed similarly to the RCS. Figure 9 illustrates the characteristics of each load case and relates the sample skewness to the coefficient of variation. It is observed that the sample skewness varies considerably, which can be conveniently captured by the LN3 distribution. Consistently with the RCS, the use of the Weibull distribution is avoided, as the fixed upper bound is deemed to be unjustified. As only extracted load effects were available for this project, it is impossible to determine the cause of the high skewness for the single-load effect situated in the Frechet domain.
The moment parameters for the LN3 distribution are estimated using MLE. Visual inspection of the diagnostic plots shows that the LN3 distribution fits the combined monthly maxima well. For illustrative purposes, Figure 10 shows the diagnostic plots for the load case when the two traffic lanes in the southbound direction (Load Case 2 per Table 5) are considered. As in the first case study, the adopted probabilistic model provides only an approximation of the upper tail behaviour, and detailed analysis might improve predictions of traffic load extremes.
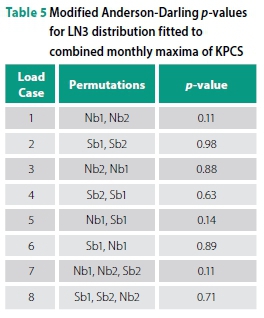
The modified AD test results are summarised in Table 5. Nb1 and Nb2 respectively refer to the slow lane and fast lane in the northbound direction. The same reference is made for Sb1 and Sb2 in the southbound direction. The traffic lane combinations for each load case are described in Table 5, where the traffic lanes are ordered from left to right in accordance to the closest and furthest traffic lane from the critical spine beam. It shows the recorded traffic used in each of the considered lanes. The _p-value for each load case exceeds a significance level of 0.05, which confirms that the LN3 distribution can be used to represent the combined monthly maxima.
The results show relatively high p-values for all the load cases, except for Load Cases 1, 5 and 7 that have much lower p-values. This observation concurs with the diagnostic plots. A shared characteristic between these load cases is that the concurrent traffic load effects in the northbound slow lane (Nb1) have the largest contribution to the combined monthly maxima. The results for these load cases suggest that the combined monthly maxima imposed on the critical spine beam may originate from a mixture of loading events. For example, the combined monthly maxima may include side-by-side truck events together with single or following truck events. The 50-year maximum load effect distribution can again be obtained by Equation 3, where F(x) is the probability distribution function of the LN3 distribution describing the combined monthly maxima.
Formulation of limit state function for the critical element reliability analysis
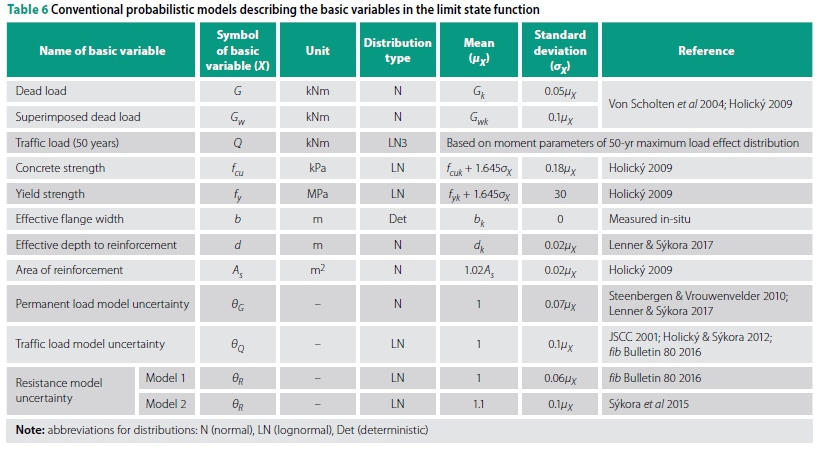
The limit state function in Equation 5 is used to determine the reliability performance of the bending moment capacity of the critical spine beam at ULS. The function consists of independent basic variables that describe the resistance, permanent load, traffic load effects and model uncertainties relevant to the critical spine beam.
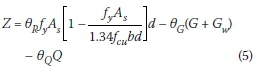
Table 6 defines the basic variables presented in Equation 5 with respective probabilistic models. Due to ambiguities in model uncertainty models presented by various researchers, two different models of uncertainty for the resistance are further investigated in order to assess the sensitivity of their parameters.
Reliability analysis results and discussion
Reliability analysis of the critical element is again performed using FORM. Overall reliability indices ß obtained for each load case depend on the selected model of the resistance model uncertainty 0R. The resulting values for ß for each load case are presented in Table 7. For Model 1, the obtained ß-values range between 6.2 and 7.8, whereas for Model 2, the values range between 6.2 and 7.0. The lowest β is obtained for Load Case 8, when three traffic lanes are positioned on the bridge and the slow lane in the southbound direction has the largest loading contribution on the critical spine beam. It is seen that the addition of another traffic lane is not as influential as in the RCS due to its reduced influence according to the transverse stiffness.
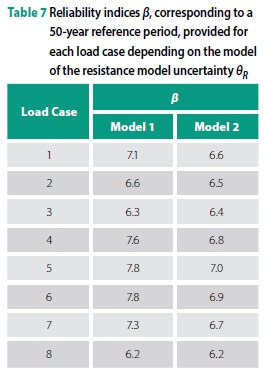
The range of ß-values is caused by considerably varying statistical moments for Q amongst the load cases under consideration. The higher the mean, coefficient of variation and skewness of the traffic load effects, the lower the obtained ß-values are. Depending on whether the traffic moves in the north-bound or southbound direction and whether a slow lane or a fast lane is located above the critical spine beam, the moment parameters describing the traffic load effects vary. The results show the importance of investigating different load cases to find the governing load case for the critical member under consideration. For future studies, it is recommended to identify and separate different loading event types. By fitting distributions to the individual loading event types, the accuracy of the probabilistic models should improve. This will also lend further support to the assumption of independent identically distributed extremes of traffic load effects. The results also show that the coefficient of variation of 0Rinfluences β, which agrees with literature (Allaix 2007; Holický et al 2010).
When comparing the results to target reliability indices ßtof 3.8 and 3.0, the obtained β-values are significantly higher. This observation shows that TMH7 NA load model exhibits satisfactory reliability performance for the considered bending capacity of the critical elements of a 20 m twin spine deck but might be deemed uneconomic. It is, however, important to consider shear forces as well. Yet, according to Tabsh and Nowak (1991), and Matos et al (2019), uneconomically high ß-values (larger than 5-6) could be expected for structures in a good condition. The high β-levels are also in agreement with the results of a previous study by Teichgräber et al (2019) who found many sources of "hidden safety" in the traffic-load model LM1 in EN 1991-2, leading to ~25% over-design. Future research should investigate other bridge deck types for a 20 m span to determine whether the reliability results concur with the results of the twin spine deck. In addition, it is also recommended to investigate shear as a failure mode (see the Discussion further down).
Sensitivity analysis results and discussion
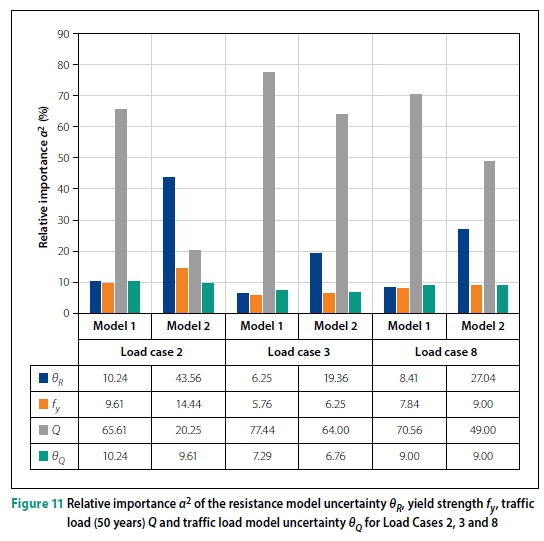
The FORM analysis also provides the sensitivity factors α for all basic variables. The factor indicates the influence of a variable on the obtained β. As |α| numerically increases, so does the significance of the basic variable. Note that Σα2 = 1, when all the basic variables in the limit state function are considered in the summation. Thus, α2describes the relative importance of each basic variable. The primary focus of the sensitivity analysis is Load Cases 2, 3 and 8, where the lowest β-values are obtained. Variables Q, Or, fyand Oq show the largest significance, with Q and Orhaving the highest α-values. Considering the two models for Or, Figure 8 provides the relative importance α2 of the most significant variables for Load Cases 2, 3 and 8. From Model 1 to Model 2, the coefficient of variation of Orincreases and, in response, the relative importance of Oralso increases, whereas Q becomes less significant (Figure 11). This would justify considering a reduced value of the sensitivity factor for traffic load effect, well below |0.7|. However, as a next step of future research it is recommended to verify and improve the theoretical probabilistic models used for the basic variables, especially Or. Actual data would improve the uncertainty quantification of a variable, which in turn would improve the accuracy of α2and the obtained β.
DISCUSSION
This study is limited to the investigation of static effects only. If DAF were included, β-levels would mostly increase, as the typically conservative nominal value of DAF is considered in design (Van der Spuy et al 2019c), while measurements typically suggest very low dynamic amplification due to heavy traffic (besides effects on local or short-span members). DAF commonly exhibits an inverse proportionality between the dynamic amplification and vehicle weight and a number of lanes, and a reduction in its scatter with increasing weight and number of lanes (Lenner & Sýkora 2016; Ivankovic et al 2019; O'Brien et al 2009; O'Connor & Enevoldsen 2007).
As the results of this study are presented for sagging moments, they need to be interpreted with caution for other types of load effects:
■ Similar results are expected for hogging moments.
■ For shear, particularly at shorter spans and local verifications, a detailed analysis of axle loads is needed. This would likely result in a lower reliability index (Van der Spuy 2020).
Reliability of steel bridges is commonly dominated by fatigue, and modelling of traffic load extremes becomes less important; an example of fatigue verification of a steel bridge using WIM was provided in a recent study (Ma et al 2018).
CONCLUSIONS AND RECOMMENDATIONS
The Roosboom Case Study, considering sagging moments as dominating traffic load effects with an assumed sensitivity factor αΕ= -0.7, indicates that NA loading generally performs well for spans ranging from 15 to 50 metres in length. However, a poor reliability performance is seen for short-span narrow bridges, especially for 5 m and 10 m spans where the number of traffic lanes is equal to the number of notional lanes for NA loading. The findings agree with Oosthuizen et al (1991), Anderson (2006), and Van der Spuy and Lenner (2019a), who also found deficiencies in the NA loading for short-span and narrow bridges. The generally acceptable performance of the rest of the bridges can be contributed to the relatively high partial factor, but mostly to the nature of the notional lane definition of the NA load model. Owing to the geometry of a typical highway bridge, more notional lanes of the NA model are used for design than the bridge can physically carry. The Roosboom case study identifies deficiencies in TMH7 for normal traffic conditions, and it also identifies span lengths that achieve a high reliability performance when considering sagging moments. This implies that the design load model could be optimised to be more cost-efficient for a range of bridges. To study a reliability performance of a critical element, the Kilner Park case study entailed investigation of a single spine of a 20 m twin-spine deck. The results agree with the Roosboom case study and satisfactory performance is observed. In fact, the obtained ß-values range between 6.2 and 7.8, and far exceed the target levels ßtof 3.8 and 3.0 as required by the Eurocode and the SANS codes, respectively. A revision of the load model could therefore lead to potential cost savings. To extend the background information for such revision, it is recommended to verify the findings of this study by studies based on WIM data from other heavy-freight routes in South Africa. It should be further verified whether similar conclusions can be drawn for hogging moments as expected. For shear, particularly at shorter spans and local verifications, the detailed analysis of axle loads is needed and lower reliability indices may be obtained.
ACKNOWLEDGEMENTS
This study has been supported by the Wilhelm Frank Trust in South Africa, and partly by the Ministry of Education, Youth and Sports of the Czech Republic under Grant LTT18003, and by the Czech Science Foundation under Grant 20-01781S. The authors thank the N3TC for access to the Roosboom WIM data. and Bakwena concession for use of the Kilner Park WIM data.
REFERENCES
Allaix, D L 2007. Bridge reliability analysis with an up-to-date traffic load model. PhD Thesis. Turin, Italy: Politecnico di Torino. [ Links ]
Anderson, J R 2006. Review of South African live load models for traffic loading on bridge and culvert structures using Weigh-in-Motion (WIM) data. MEng Dissertation. University of Cape Town. [ Links ]
Ang A & Tang, W 2006. Probability Concepts in Engineering: Emphasis on Applications to Civil and Environmental Engineering. 2nd ed. New York: Wiley. [ Links ]
Basson, S E 2020. An investigation into the reliability performance of bridges designed according to TMH7. MEng Dissertation. Stellenbosch University. [ Links ]
Basson, S E & Lenner, R 2019. Reliability verification of bridges designed according to TMH7. Proceedings, 7th International Conference on Structural Engineering, Mechanics and Computation, Cape Town, pp 1865-1870. [ Links ]
Bruls, A, Croce, P & Sanpaolesi, L 1996. ENV1991. Part 3: Traffic loads on bridges: Calibration of load models for road bridges. Proceedings, IABSE Colloquium on the Basis of Design and Actions on Structures. Delft, The Netherlands: IABSE, pp 439-454. [ Links ]
Caprani, C C 2012. Calibration of a congestion load model for highway bridges using traffic microsimulation. Structural Engineering International, 22(3): 342-348. [ Links ]
Caprani, C C, Belay, A & O'Connor, A J 2003. Site-specific probabilistic load modelling for bridge reliability. Proceedings, 3rd International Conference on Current and Future Trends in Bridge Design, 28-30 April 2003, Shanghai, China, pp 341-348. [ Links ]
Caprani, C C, O'Brien, E J & McLachlan, G J 2008. Characteristic tra ffic load effects from a mixture of loading events on short to medium span bridges. Structural Safety, 30(5): 394-404. [ Links ]
Castillo, E 1988. Extreme Value Theory in Engineering. Boston, MA: Academic Press. [ Links ]
Castillo, E, Hadi, A S, Balakrishnan, N & Sarabia, J M 2005. Extreme Value and Related Models with Applications in Engineering and Science. New York: Wiley. [ Links ]
Coles, S 2001. An Introduction to Statistical Modelling of Extreme Values. London: Springer. [ Links ]
Crespo-Minguillón, C & Casas, J R 1997. A comprehensive traffic load model for bridge safety checking. Structural Safety, 19(4): 339-359. [ Links ]
CSRA (Committee of State Road Authorities) 1998. TMH7. Code of Practice for the Design of Highway Bridges and Culverts in South Africa. Parts 1 and 2. Pretoria: Department of Transport. [ Links ]
De Wet, D P G 2010. Post-calibration and quality management of weigh-in-motion traffic data. MEng Dissertation. Stellenbosch University. [ Links ]
DOT (Department of Transport) 2013. National Transport Master Plan (NATMAP) 2050. Chapter 7: Freight Transport. Pretoria: DOT. [ Links ]
EN (European Standard) 2002. EN 1990:2002. Eurocode - Basis of Structural Design. Brussels: European Committee for Standardisation. [ Links ]
Enright, B 2010. Simulation of traffic loading on highway bridges. PhD Thesis. Dublin, Ireland: University College Dublin. [ Links ]
fib Bulletin 80 2016. Partial factor methods for existing concrete structures. Lausanne, Switzerland: International Federation for Structural Concrete (fib). [ Links ]
Fisher, R A 2006. Statistical Methods for Research Workers. Edinburgh: Genesis Publishing. [ Links ]
Getachew, A & O'Brien, E J 2007. Simplified site-specific traffic load models for bridge assessment. Structure and Infrastructure Engineering, 3(4): 303-311. [ Links ]
Hajializadeh, D, O'Brien, E J, Enright, B, Caprani, C C, Sheils, E & Wilson, S P 2012. Probabilistic study of lifetime load effect distribution of bridges. Proceedings, 6th International ASRANet Conference for Integrating Structural Analysis, Risk and Reliability, 2-4 July 2012, London. [ Links ]
Holický, M 2009. Reliability Analysis for Structural Design. Stellenbosch: SunMedia. [ Links ]
Holický, M 2013. Introduction to Probability and Statistics for Engineers. Berlin, Heidelberg: Springer. [ Links ]
Holický, M, Retief, J & Wium, J 2010. Partial factors for selected reinforced concrete members: Background to a revision of SANS10100-1. Journal of the South African Institution of Civil Engineering, 52(1): 37-44. [ Links ]
Holický, M & Sýkora, M 2012. Conventional probabilistic models for calibration of codes. In Faber, M, Koehler, J & Nishijima, K (Eds). Applications of Statistics and Probability in Civil Engineering, Boca Raton, FL: CRC Press, pp 969-976. [ Links ]
ISO (International Organisation for Standardisation) 2015. ISO 2394:2015. General Principles on Reliability for Structures. Geneva, Switzerland: ISO. [ Links ]
Ivankovic, A, Skokandic, D, Znidaric, A & Kreslin, M 2019. Bridge performance indicators based on traffic load monitoring. Structure and Infrastructure Engineering, 15(7): 899-911. [ Links ]
Jacob, B & Feypell-de La Beaumelle, V 2010. Improving truck safety: Potential of weigh-in-motion technology. IATSS Research, 34(1): 9-15. [ Links ]
Jacob, B, O'Brien, E J & Jehaes, S 2002. COS 323. Weigh-in-motion of road vehicles. Final report. Paris: Laboratoire Central des Ponts et Chaussées. [ Links ]
JCSS (Joint Committee on Structural Safety) 2001. Probabilistic Model Codes. JCSS Working Document. http://www.jcss.ethz.ch [ Links ]
Lenner, R & Sýkora, M 2016. Partial factors for loads due to special vehicles on road bridges. Engineering Structures, 106: 137-146. [ Links ]
Lenner, R & Sýkora, M 2017. Partial factors for imposed loads in areas for storage and industrial use. Structure and Infrastructure Engineering, 13(11): 1425-1436. [ Links ]
Lenner, R, De Wet, D P G &Viljoen, C 2017. Traffic characteristics and bridge loading in South Africa. Journal of the South African Institution of Civil Engineering, 59(4): 34-46. [ Links ]
Ma, R, Xu, S, Wang, D & Chen, A 2018. Vehicle models for fatigue loading on steel box-girder bridges based on weigh-in-motion data. Structure and Infrastructure Engineering, 14(6): 701-713. [ Links ]
Matos, J C, Moreira, V N, Valente, I B, Cruz, P J, Neves, L C & Galväo, N 2019. Probabilistic-based assessment of existing steel-concrete composite bridges: Application to Sousa River Bridge. Engineering Structures, 181: 95-110. [ Links ]
Morales-Nápoles O & Steenbergen R 2014. Analysis of axle and vehicle load properties through Bayesian networks based on weigh-in-motion data. Reliability Engineering and System Safety, 125: 153-164. [ Links ]
Nowak, A S 1993. Load model for highway bridges. Structural Safety, 13(1-2): 53-66. [ Links ]
Nowak, A S & Rakoczy, P 2013. WIM-based live load for bridges. KSCE Journal of Civil Engineering, 17(3): 568-574. [ Links ]
O'Brien, E J, Rattigan, P, Gonzalez, A, Dowling, J & Znidaric, A 2009. Characteristic dynamic traffic load effects in bridges. Engineering Structures, 31(7): 1607-1612. [ Links ]
O'Brien, E J, Schmidt, F, Hajializadeh, D et al 2015. A review of probabilistic methods of assessment of load effects in bridges. Structural Safety, 53: 44-56. [ Links ]
O'Connor, A & Enevoldsen, I 2007. Probability-based bridge assessment. Proceedings of the Institution of Civil Engineers - Bridge Engineering, 160: 129-137. [ Links ]
O'Connor, A J & O'Brien, E J 2005. Traffic load modelling and factors influencing the accuracy of predicted extremes. Canadian Journal of Civil Engineering, 32(1): 270-278. [ Links ]
Oosthuizen, A P, Meintjies, C J, Trumpelmann, V, Peters, D, Ullmann, K K & Oppermann, G H 1991. TMH7 Part 2: Traffic Loading (1991). Proposed Substitution of Section 2.6. Pretoria: Committee of State Road Authorities, Department of Transport. [ Links ]
Pérez, S & Lenner, R 2019. Bridge reduction factors based on Monte Carlo routine with copulas. Engineering Structures, 198. doi.org/10.1016/j.engstruct.2019.109530 [ Links ]
R Core Team 2018. R: A language and environment for statistical computing, version 3.5.0. Vienna, Austria: R Foundation for Statistical Computing. [ Links ]
SANRAL (South African National Roads Agency Limited) 2010. Table 6000/1 Project document: Project specifications. Pretoria: SANRAL. [ Links ]
SANRAL (South African National Roads Agency Limited) 2012. SANRAL Structural Drawings. Pretoria: SANRAL. https://www.nra.co.za/live/content.php?Category_ID=206. [ Links ]
SANS (South African National Standard) 2019. SANS 10160-1:2019. Basis of Structural Design and Actions for Buildings and Industrial Structures. Pretoria: SABS Standards Division. [ Links ]
Soriano, M, Casas, J R & Ghosn, M 2016. Simplified probabilistic model for maximum traffic load from weigh-in-motion data. Structure and Infrastructure Engineering, 13(4): 454-467. [ Links ]
Steenbergen, R D & Vrouwenvelder, A C 2010. Safety philosophy for existing structures and partial factors for traffic loads on bridges. Heron, 55(2): 123-140. [ Links ]
Sýkora, M, Holický, M, Prieto, M & Tanner, P 2015. Uncertainties in resistance models for sound and corrosion-damaged RC structures according to EN 1992-1-1. Materials and Structures/Materiaux et Constructions, 48(10): 3415-3430. [ Links ]
Tabsh, S W & Nowak, A S 1991. Reliability of highway girder bridges. Journal of Structural Engineering, 117(8): 2372-2388. [ Links ]
Teichgräber, M, Nowak, M, Köhler, J & Straub, D 2019. The effect of traffic load model assumptions on the reliability of road bridges. In Life-Cycle Analysis and Assessment in Civil Engineering: Towards an Integrated Vision. Proceedings of the 6th International Symposium on Life-Cycle Civil Engineering (2018), Ghent, Belgium: IALCCE, pp 2837-2845. [ Links ]
Van der Spuy, P 2020. Derivation of a traffic load model for the structural design of highway bridges in South Africa. PhD Thesis. Stellenbosch University. [ Links ]
Van der Spuy, P & Lenner, R 2018. Developing a new bridge live load model for South Africa. Proceedings, 9th International Conference on Bridge Maintenance, Safety and Management (IABMAS), 9-13 July 2018, Melbourne, pp 1405-1410. [ Links ]
Van der Spuy, P & Lenner, R 2019a. Towards a new bridge live load model for South Africa. Structural Engineering International, 29(2): 292-298. [ Links ]
Van der Spuy, P, Lenner, R, De Wet, T & Caprani, C C 2019b. Multiple lane reduction factors based on multiple lane weigh in motion data. Structures, 20: 543-549. [ Links ]
Van der Spuy, P, Lenner, R & Meyer, M 2019c. Dynamic amplification factor for South African bridges. Proceedings, 7th International Conference on Structural Engineering, Mechanics and Computation, 2-4 September, Cape Town, pp 1859-1864. [ Links ]
Von Scholten, C, Enevoldsen, I, Arnbjerg-Nielsen, T et al 2004. Reliability-based classification of the load carrying capacity of existing bridges. Copenhagen: Danish Ministry of Transport, Road Directorate. [ Links ]
 Correspondence:
Roman Lenner
Department of Civil Engineering, Stellenbosch University Private Bag X1
Matieland, Stellenbosch 7602, South Africa
T: +27 21 808 9572, E: rlenner@sun.ac.za
Suzanne Basson
Zutari, Cape Town, South Africa
T: +27 21 526 9463, E: suzanne.basson@zutari.com
Mirek Sýkora
Klokner Institute
Czech Technical University in Prague Czech Republic
T: +420 224 353 529, E: miroslav.sykora@cvut.cz
Pierre Van Der Spuy
Zutari, Cape Town, South Africa
T: +27 21 526 9400, E: pierre.vanderspuy@zutari.com

PROF ROMAN LENNER (PE) is an Associate Professor at Stellenbosch University in the Department of Civil Engineering. His main research interests include structural reliability, bridge loading, target reliability and assessment of existing structures. He is a member of the Joint Committee on Structural Safety, serves as Chair of the IABSE South Africa National Group, is a member of the Editorial Board of Structural Engineering International, and is a member of the IABSE TG1.3-working group.

SUZANNE BASSON, a Candidate Civil Engineer, completed her BEng and MEng in Civil Engineering (cum laude) at Stellenbosch University in 2017 and 2020, respectively. She is currently employed as a civil engineer at Zutari in their Cape Town office. Her research interests include probabilistic modelling, structures, and bulk water supply.

PROF MIREK SÝKORA is an Associate Professor at the Klokner Institute, Czech Technical University in Prague. His research interests cover the basis of structural design, structural reliability, probabilistic optimisation, load modelling, risk assessment of technical systems, and applications of probabilistic methods in structural design. He is a member of the Joint Committee on Structural Safety, fib COM3 Existing Concrete Structures, CEN/TC 250/WG 2 Assessment of Existing Structures, and CEN/ TC 250/SC 1/WG 3 Traffic Loads on Bridges. He is also a member of the Editorial Boards of Structural Concrete (official journal of fib) and Acta Polytechnica (subtitled as Journal of Advanced Engineering).

DR PIERRE VAN DER SPUY (Pr Eng, MSAICE) is a Principal Bridge Engineer with Zutari in Cape Town. He is registered with the Engineering Council of South Africa as a Professional Engineer and is a corporate member ofthe South African Institution of Civil Engineering (SAICE). He recently completed a PhD in bridge traffic loading at Stellenbosch University.

