


Services on Demand
Article
 English (pdf)
 Article in xml format
 Article references
Indicators

Related links
-
 Cited by Google
 -
 Similars in Google
Share

 Permalink
Journal of the South African Institution of Civil Engineering
On-line version ISSN 2309-8775
Print version ISSN 1021-2019
J. S. Afr. Inst. Civ. Eng. vol.63 n.1 Midrand Mar. 2021
http://dx.doi.org/10.17159/2309-8775/2021/v63n1a2
TECHNICAL PAPER
Measurement of probabilistic ballast particle dynamics using Kli-Pi
A Broekman; P J Grabe
ABSTRACT
At first glance the operational performance of ballast appears trivial in its simplicity. However, various mechanisms affect the performance of the ballast both on a macroscopic scale and discrete (mesoscale) particle level. The importance of experimental studies to establish the influence of the granular fabric has been highlighted repeatedly by other researchers. This paper describes a method by which quantitative metrics and statistics can describe the probabilistic response of railway ballast. The measurements were obtained with the installation of a set of customised wireless inertial measurement unit (IMU), referred to as Kli-Pi, in the granular layers of a heavy-haul railway line located in South Africa. The results indicate a complex interaction of displacement and rotation, in all three spatial dimensions. The high-frequency measurements provided approximations of the particle's kinetic and potential energy (mechanical work) in addition to the indirect quantification of changes to the granular fabric. Finally, the descriptive statistics of the mechanical work provided an indirect measure of the confinement and coordination number of the particle, together with supporting evidence of the underlying probabilistic, instead of the expected deterministic response. These results strongly agree with the findings of existing literature that has, to date, been confined to theoretical study.
Keywords: probabilistic ballast particle dynamics, smart ballast instrumentation, Kli-Pi, granular fabric quantification, mesoscale ballast dynamics, impact loading
INTRODUCTION
The performance of the track structure is highly dependent on the operational performance and interaction of ballast particles. The dynamic response can be investigated from either a macroscopic scale (considering the track structure as a whole) or the mesoscale (discrete particle behaviour). Attempting to instrument an individual ballast particle encounters great difficulty, in part due to the morphology of the material and technological limitations. Analytical solutions describing the track structure response subjected to complex dynamic loading requires convoluted solutions. Rucker (1982) concluded that attempts to develop three-dimensional theoretical models for the vibrations of ballast is an extremely difficult, if not impossible task. Representative, continuous empirical measurements are required to understand the fundamental behaviour of ballast in the process of promoting cost-effective life cycle costs of large-scale infrastructure projects. The importance of studying granular particle interactions and contacts under the influence of quasi-static loading conditions - also referred to as the "granular fabric" - is well known (Cowin & Satake 1979). Audley and Andrews (2013) concluded their discussion regarding the availability of track deterioration models as follows: "It is clear from looking at the existing track geometry models that there remains a need for better understanding of the degradation process to be established, which can support the development of accurate models, based on historical data. This model needs to be capable of including the effects of maintenance models."
This paper investigates the application of a "smart ballast" device - referred to as Kli-Pi (derived from the Afrikaans word for a small stone) - in the investigation of mesoscale ballast dynamics. The representative dynamic response of a track structure was recorded for both a laboratory and field experiment - only the results obtained from the field test are considered in this paper. These measurements included all six degrees of freedom (DoF) - three for translation and three for rotation. Descriptive statistics and energy principles were implemented to quantify the performance of the ballast response. This investigation provided insights into the geometry-dependent frequencies, lateral and longitudinal forces, indirect quantification of the "granular fabric", longitudinal principal stress rotations (PSR), particle coordination number (CN) and evidence of the probabilistic (non-deterministic) nature of ballast particles.
LITERATURE
The background literature discusses the relevance of ballast in the track structure and emerging sensor technologies that enable quantitative measurements of the ballast particles. Different modelling approaches for describing inter-particle contact and behaviour - both deterministic and probabilistic perspectives - are reviewed, and conclude with recent examples of "smart ballast" to directly quantify the dynamic ballast properties subject to quasi-static loading.
Track structure
Most of track maintenance pertains to the correction of deteriorating track geometry. The action of repeated cyclic loading degrades the ballast through inter-particle attrition, fouling and weathering of the particles. Although some of the settlement can be attributed to the underlying earthwork (subgrade and subballast), most of the track settlement is caused by the rearrangement and movement of the unbound ballast particles. Low-frequency components associated with the moving load are characterised by geometry-dependent features of the train, such as inter-axle, inter-bogie and inter-wagon dimensions. Intermediate frequencies are characteristic features of the granular layers, with higher frequencies associated with track components and rail defects. For the investigation of ballast, the frequencies of interest are below 250 Hz (Kouroussis et al 2015).
Emerging sensor technologies
Different instrumentation technologies have been developed, adapted and improved over time to measure a wide assortment of track components and associated phenomena. Although the functional importance of ballast is well understood and extensively documented, few studies have attempted to directly instrument ballast particles. Some notable examples are that of Bennett et al (1999) with the development of a cylindrically shaped device to measure strain of asphalt surfacings, and Nejikovsky and Keller (2000) with the on-board measurement of lateral acceleration. Straser and Kiremidjian (1998) developed wireless monitoring systems for civil structures. Any attempts to instrument a ballast particle directly are met with difficulty, owing to the irregular morphology and freedom of movement about multiple degrees of freedom (DoF). Only the particles located at the surface, which is not of interest, are suited for visual study. Recently, Lamas-Lopez et al (2017) investigated the potential replacement of traditional LVDTs (linear variable differential transformers) altogether using accelerometers (Bowness et al 2006; Graizer 2010; Kempe 2011). The peak-to-peak displacement accuracy was reported as 20% over a wide range of train velocities.
The introduction of inertial navigation systems and units (IMU), together with the advancement of micro-electro-mechanical system (MEMS) manufacturing techniques, have led to the development of high-performance sensors in miniaturised form factors. Woodman (2007) defines inertial navigation as: "... a self-contained navigation technique in which measurements provided by accelerometers and gyroscopes are used to track the position and orientation of an object relative to a known starting point, orientation and velocity" A rigid IMU system provides the ability to describe the body frame (of the sensor), relative to the global reference frame, through the measurement of three orthogonal accelerometers and three orthogonal gyroscopes. The linear accelerations and angular velocities are measured by the accelerometers and gyroscopes respectively. MEMS manufacturing technologies refer to the construction of miniaturised IMUs using traditional semiconductor and integrated circuit (IC) fabrication techniques (Nathanson & Wickstrom 1965). The typical construction and operation of such a device are discussed in detail by Lemkin and Boser (1999).
Deterministic mechanics of granular materials
Traditionally, investigations of granular materials, particularly numerical models, laboratory and field investigations, have been from a deterministic point of view. The combined probabilistic response of the particle matrix manifests as macroscopic or deterministic effects and properties such as stress, permanent strain and confinement.
The transfer of load from the sleeper to the ballast produces the same effects as with triaxial compression (Li et al 2015). The middle of the ballast layer experiences a reduction in vertical stress compared to the ballast directly beneath the sleeper, but with higher levels of confinement. The lowest layer of ballast, near the subballast interface, develops tensile strain incrementally as the number of load cycles increases. These particles tend to spread and rearrange, resulting in the development of voids. The substantial influence of particle breakage on the permanent strain was highlighted by Lobo-Guerrero and Vallejo (2006). Cundall and Strack (1979) explored the effect of particle rearrangement on the distribution of principal stresses using numerical models. Typical ballast maintenance activities further disturb the particle arrangement and interlocking where the lateral and longitudinal resistance are reduced by up to 60% and 40% respectively (Tutumluer et al 2006). Furthermore, the long-term rate of permanent deformation (Lekarp et al 2000) and cumulative permanent deformation (Grabe & Clayton 2009) is highly dependent on the development of PSR. The most unfavourable stress combination occurs approximately at the subballast interface depending on the Young's modulus of the subgrade and ballast. Grabe and Clayton (2009) describe the PSR as a combination of three distinct mechanisms:
1. Longitudinal PSR is positioned between two adjacent sleepers for shallow depths and single-axle combinations.
2. Transverse PSR is present at the discontinuous sleeper ends.
3. The depth of influence of PSR correlates with the axle count per bogie.
Micromechanics of granular materials
The deterministic or continuum approach to analysing soils and granular media is generally employed to model the response to loading using theories of elasticity and plasticity. For the investigation of discrete particle media, however, analytical solutions and new instrumentation technologies are required if the micromechanics of mesoscale behaviour are to be better understood. The two most popular numerical methods are finite element modelling (FEM) and discrete element modelling (DEM). The complexity of obtaining realistic results stem from the significant number of particles present and the small time-step required for convergence. To complement the theoretical investigations, the use of miniaturised, MEMS-based sensor technologies has recently been explored. Few comprehensive, constitutive relationships exist that accurately describe the complexities involved with a discrete medium, thus the wide implementation of FEM and DEM.
Cundall and Strack (1979) pioneered the theoretical establishment of DEM modelling. Discrete modelling has the advantage of simulating the relatively large displacements, rotations and contacts occurring within the matrix. A comprehensive, two-dimensional DEM analysis by Zhang et al (2016) investigated the dynamic ballast behaviour for high-speed railway applications. The largest stresses and accelerations were concentrated within the first 200 mm of ballast where peak frequencies were observed in the region below 100 Hz and in the 150-300 Hz range. A dimensionless scalar value of β relates the ratio of the principal stress of a particle to the average of the three principal stresses. When the displacements of these particles are graphed for a moving load, a circular pattern of movement is produced. The spectral frequency densities with the greatest amplitude were observed to be a function of the inter-axle and inter-bogie spacing of the train. Other studies improved upon this research with the implementation of more representative non-convex particle geometry (Wilke et al 2016) generated from photo-grammetric laser scanning (Indraratna et al 2011; Mvelase et al 2012) of the particles.
Some authors have suggested that the driving force behind the rearrangement, orientation and dynamic response of granular media is the manifestation of the maximisation of the system's entropy (Cowin & Satake 1979). This statistical foundation suggests a possible amalgamation between the measured deterministic response and proven probabilistic characteristics exhibited. Rothenburg and Kruyt (2009) concluded that the best descriptor of the inter-particle contact forces, angles and displacements is with the use of statistics, not simplified laws of mechanics. The observed particle displacements, for identical contact angles (the corresponding conditional probability), are merely the outcome or realisation of some independent random variable. The shape of the probability distribution function (PDF) was derived using techniques to maximise the available entropy (Kruyt & Rothenburg 2002). Depending on the average coordination number (CN) of the particles, the PDF is either Gaussian-shaped for dense systems (5.5 < CN < 6) or exponentially shaped (4 < CN < 5). Makse et al (2000) observed similar results to that of Kruyt and Rothenburg (2002). Kitamura (1980) summarises his findings as follows: "Furthermore, it is shown that the discontinuous motions largely contribute to the deformation process of particulate material, and the method to quantitatively estimate the discontinuous motions is proposed based on the probabilistic considerations for the motions of particles."
Smart ballast
The fusion of recent research applications involving smart sensor technologies and ballast particles is collectively referred to as "smart ballast" instrumentation. Zhai et al (2004) provides one of the earliest examples of instrumenting field ballast with a uniaxial MEMS accelerometer, in combination with a theoretical model. Good agreement between the results was found. The resonant frequency of the ballast accelerations was found to be between 80 Hz and 100 Hz. Aikawa (2009) supplemented this method with an additional, secondary accelerometer to derive angular velocities. Rotations exhibited identical frequencies to that of the accelerations with more rapid attenuation. Only vertical accelerations were measured. Li et al (2015) reported a similar range of resonance frequencies in-between 50 Hz and 210 Hz. Milne et al (2016a) utilised several wireless, miniaturised smart ballast particles to investigate aerodynamic effects on the granular media for train velocities exceeding 400 km/h.
The most recent and noteworthy example of smart ballast is the development of "SmartRock" by Liu et al (2016a). The wireless internal unit containing the electronics is surrounded by a 3D printed exoskeleton, measuring only 60 χ 60 χ 60 mm in size. The unit transmits the IMU measurements wirelessly using a Bluetooth interface. The maximum sampling frequency is reported as 64 Hz which can resolve the peak-to-peak translational and rotational accelerations. Short-term testing of 500 loading cycles illustrates the complexity in the rearrangement of the SmartRock in the surrounding granular matrix. A decrease in lateral stiffness was observed at the edge of the sleeper resulting from the decrease in resistance to movement. Additional research was carried out to move the SmartRock to different positions beneath the sleeper (Liu et al 2016b) together with the influence of geogrids installed within the ballast (Liu et al 2016c). The SmartRock proved vital to measure the mesoscale effects associated with different geometric and material variables. The main conclusions reached were the increased amplitude of rotation by positioning the SmartRock at the edge of the sleeper, the significant reduction in the movement with an increase in depth, and the complex interaction between the measured translation and rotation.
KLI-PI DEVELOPMENT
A detailed design methodology outlining the desired functionality and performance characteristics of an improved smart ballast prototype, to meet the required objectives of the study, was established. The methodology incorporated the design, construction and calibration of the instrument. The smart ballast prototype, named "Kli-Pi", was successfully developed (Figure 1) and calibrated for this research project (Broekman & Grabe 2018). The calibration procedure provided comparable instrumentation performance compared to that of Milne et al (2016b). The name Kli-Pi is derived from the Afrikaans word for small rock to convey the miniaturised rock or ballast-shaped analogue. The key performance characteristics of Kli-Pi can be summarised as follows:
■ High-performance, Linux-based microprocessor and MEMS IMU (H3LIS221DL Motion Sensor).
■ Sampling rate of 3 000 measurements per second, divided evenly among the 6 DoF (tri-axis accelerometer and tri-gyroscope). The data for each axis of each sensor is thus recorded at 500 Hz.
■ Programmable full scale of ±16 G and ±2 000 degrees per second (DPS) for the accelerometer and gyroscope respectively.
■ High-strength, non-convex, 3D printed PLA (Polylactic Acid) exoskeleton for ample environmental protection.
■ Sufficient battery capacity to provide a two-month standby time or ten hours of continuous data acquisition.
■ High-bandwidth, in-situ wireless communication using a Wi-Fi connection for the transfer of data (post-recording) over a local area network (LAN).
The 500 Hz sampling rate, or 2 ms between successive readings, provides the ability to accurately integrate the data using numerical methods. A second-order Lagrange interpolation polynomial was used to approximate the discrete data points and is referred to as super-sampling. Following the super-sampling operation, Simpson's method is employed to numerically integrate the array of data. The linear acceleration and rotational velocity were integrated using this method to obtain the displacements and rotations for the three orthogonal axes of measurement. Due to the influence of electromagnetic interference, only the gravitational vector was employed in the alignment of the body vector's z-axis with that of the global frame. The installation method ensured that the lateral axes of the body frame were aligned with that of the global frame. For both the installation and experimentation procedure, the following coordinate system was used:
■ Longitudinal | parallel to the direction of the rails | IMU x-axis or roll (φ)
■ Lateral | parallel to the long axis of the sleepers | IMU y-axis or pitch (θ)
■ Vertical | parallel to the gravitational vector | IMU z-axis or yaw (ψ)
EXPERIMENTAL PROCEDURE
A full-scale field trial was conducted to investigate the representative dynamic response of the ballast. The aim of the experiment was to replicate the typical characteristics and operating behaviour of field conditions for heavy-haul conditions. Figure 2 illustrates the instrumentation configuration together with the depth of the instrumentation. The experiment was carried out during December 2017 near the Komati Power Station / Broodsnyersplaas (26°04'32.9"S 29°30'17.8"E). This primary rail artery is used for exporting coal from the surrounding mines in the Mpumalanga Province of South Africa. Grabe and Clayton (2009) summarised the track specifications and dimensions. The track consists of equidistantly spaced (650 mm) concrete (PY) sleepers using a standard Cape gauge of 1 067 mm. The ballast depth is 300 mm with the subballast and subgrade material extending to a depth of 900 mm. This rail corridor started service in 1976. The direction of travel coincided with an increase in the gradient and a decrease in train velocity as the train passed the static reference measurement point. The granular layers were saturated following short bouts of rain during the preceding week. Additionally, during retrieval of the instruments, the water table was positioned approximately 100 mm above the subballast interface.
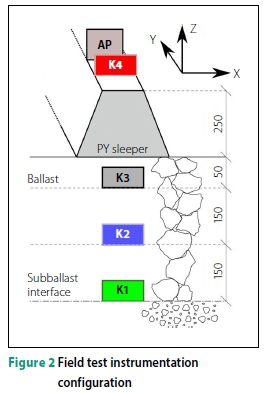
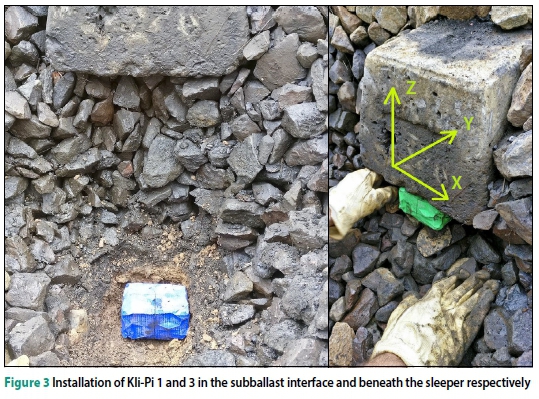
The section was instrumented with a total of four Kli-Pis. For ease of installation and retrieval, the Kli-Pis were installed directly beneath one of the sleepers in the shoulder ballast section (Figure 3). This position also minimises the disturbance to the ballast matrix. Furthermore, this position is synonymous with the expected location where significant rotation (Liu et al 2016b) and PSR (Grabe and Clayton 2009) would be measured in addition to the influence of overlapping stress frusta from the dual-wheel axle configuration. The ballast stones were carefully placed back in position by hand after the installation process to ensure adequate interlocking of the particles surrounding the instruments. During subsequent retrieval of the instruments, it was noted that the orientation remained unaltered. The Wi-Fi access point (denoted AP) used for communicating with all the Kli-Pis, was positioned directly above the vertically aligned column of instruments to ensure a reliable connection. The user interface was situated a safe distance away from the track using an Ethernet interface. The data presented was obtained from the passage of six class 10E locomotives (21 ton/axle) and 100 loaded wagons (estimated 20 ton/ axle), representing a period of approximately 100 seconds.
The software language of choice was Python for its versatile set of available libraries and wide implementation in the research community. Python was used for both the calibration of the IMU and the analysis of the large data sets to extract meaningful data as efficiently as possible. The analysis workflow consisted of filtering methods (Butterworth filtering), numerical approximation and integration methods, frequency domain transformations and peak identification. Similar to Lamas-Lopez et al (2017) and Milne et al (2016b) a Butterworth filter of order 3 with a bandpass of 4-200 Hz was selected for the acceleration data. To remove the bias present in the rotational velocity data obtained from the gyroscope, an average measurement over a 3-second period (with no trains passing) is subtracted (per axis) from the entire dataset. Any other calculations derived from these datasets, for example the displacement and energy metrics and peak-to-peak statistics, are thus automatically filtered. Over a two-minute period, accounting for all six degrees of freedom, 360 000 data samples were generated for each Kli-Pi, or 1.44 million for a single train passage. For any given degree-of-free-dom, the 2 000 largest peak-to-peak samples were extracted for use in the analysis phase. Using Python, graphs illustrating the data in both the time and frequency domain were implemented in quantifying the dominant modes of rotation and translation, together with observations of impact loading, rearrangement of particles in the ballast matrix and ballast resonance.
DISCUSSION OF THE RESULTS
With the introduction of Kli-Pi, the experiment performed aims to augment existing literature and provide new insights into the mesoscale behaviour of ballast under the influence of quasi-static loading. These results are divided into discussions surrounding the typical displacements and rotations for both the time and frequency domains, mechanical work and energy methods, concluding with the statistical descriptors for the interpretation of these metrics. The focus of the discussion is based on the results from the field test.
Time domain features
Figure 4 illustrates the displacement in the vertical or z-axis for all the Kli-Pis with the periodic 4-axle configuration of the wagons clearly visible; each wagon is denoted by the bracket with each of the axles numbered. Impact loading occurs at approximately 31.5 s, whereby the peak-to-peak displacement amplitudes are significantly larger (for all the Kli-Pis) compared to the preceding or successive loading patterns. The largest typical peak-to-peak displacement is associated with Kli-Pi 4 attached to the sleeper, measuring approximately 350 μm (peak-to-peak), reducing with depth. The peak-to-peak displacements measured among all the instruments show significant variance over time. This is also true for the longitudinal (x) and lateral (y) axes, though the magnitude thereof is substantially smaller. Even though the displacement reduces on average with depth, an anomaly occurs for Kli-Pi 3 and Kli-Pi 2 which are positioned beneath the sleeper and in the middle of the ballast layer respectively.
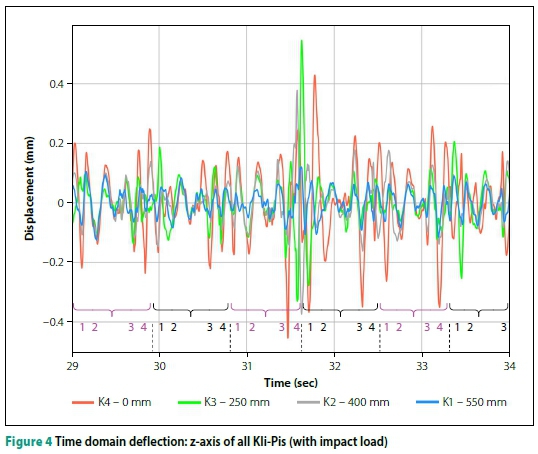
The average vertical displacement (z-axis) was measured as 109 μm and 104 μm for Kli-Pi 3 and Kli-Pi 2, respectively. This net-zero displacement can be explained by the overlapping of stress frusta of the wheel loads occurring in-between the positions of Kli-Pi 2 and Kli-Pi 3. The discontinuous nature of the particles accommodates this strain discontinuity, where the particles beneath the sleeper experience lower levels of confinement. Reorientation or partial suspension of the particles is possible, effectively inducing heaving of the ballast. The measurement of mesoscale behaviour limits any simplified approach to quantify the stress and strain of the material. This provides supportive evidence for the mechanism driving the periodic changes on the ballast matrix as noted by Cundall & Strack (1979). For the comparative laboratory test, the same phenomenon was not observed.
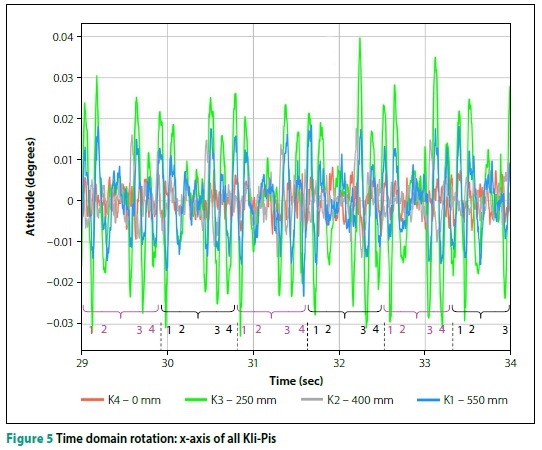
Figure 5 illustrates the rotation about the longitudinal or x-axis for all the Kli-Pis. The rotational response exhibits more uniformity than that of the displacements, although the magnitude is staggered about depth. As expected (Gräbe & Clayton 2009), the longitudinal PSR is visible when considering the relatively large peak-to-peak rotation of Kli-Pi 1 situated within the subballast-ballast interface (0.02 degrees). The influence of the sleeper's transverse PSR in proximity of Kli-Pi 3 is also illustrated, with the magnitude even larger than that of Kli-Pi 1 with a peak-to-peak amplitude of 0.05 degrees. Kli-Pi 2 and Kli-Pi 4 positioned within the middle of the ballast layer and on the surface of the sleeper respectively, hardly exhibit any rotational response. For the laboratory tests, significant variations occurred over the duration of the test where both the magnitude and preferred axis of rotation changed throughout the test, similar to the observations of Liu et al (2016a) with SmartRock. For the field test, however, the peak-to-peak rotations increased rapidly during the initial reorientation after the installation, stabilising after approximately 20 seconds.
Frequency domain features
Fast Fourier Transformations (FFTs) highlight the dominant frequencies associated with the passage of the locomotives and wagons. This information provides insights into the geometry of the train, sleeper-ballast resonance and horizontal forces. For the vertical deflection (z-axis) of Kli-Pi 3, positioned beneath the sleeper, the distinction between the locomotives and wagons is clear (Figure 6). For the first few seconds, the movement and reorientation of the Kli-Pi are represented as a broad range of frequencies with varying intensities.
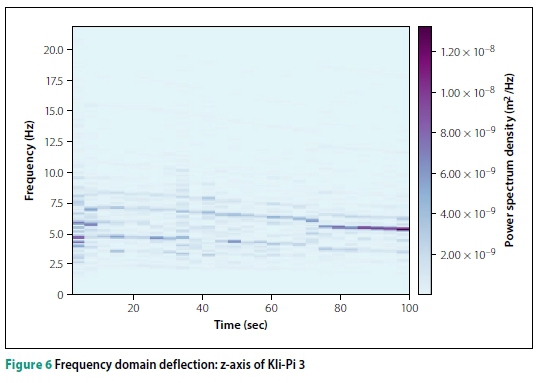
Thereafter, each discrete frequency can be linked to the inter-bogie, inter-axle and inter-wagon frequencies or a more complex combination thereof, as explored in detail by Milne et al (2017) and Ju et al (2009). During the passage of the locomotives, a distinct band of frequencies in the region of 125-150 Hz was observed and correlates with the ballast-sleeper resonance noted by Zhang et al (2016). The bogie passage and car bogie bounce are particularly pronounced between the 5 Hz and 10 Hz band of frequencies (Kouroussis et al 2015). The impact load noted before (Figure 4) is illustrated by the broad range of frequencies at the 32 s mark. The largest proportion of the energy remained concentrated along the vertical direction (z-axis), parallel to the axis of loading. Near the end of the train passage, an increase in the density of the spectra is observed, likely as a result of an increasing level of compaction of the instrument within the surrounding ballast matrix.
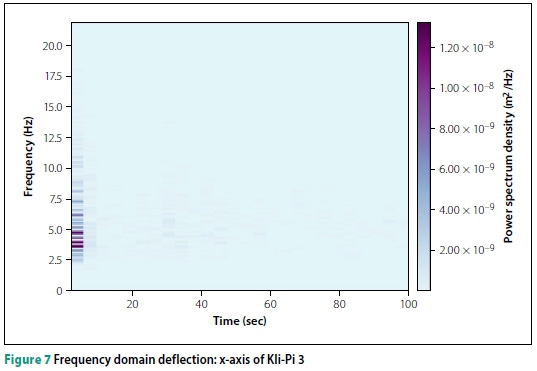
With the passage of the locomotives, the amplitude of the longitudinal displacements (x-axis) during this narrow time frame exceeded that of the vertical displacements (z-axis) by more than 50% (Figure 7). This effect can be linked to the transfer of tractive forces from the locomotive onto the track, inducing a short-lived, oval-shaped translation pattern (Zhang et al 2016). Barely any longitudinal forces (x-axis) are present during the passage of the wagons. The transfer of longitudinal (x-axis) and lateral forces (y-axis) diminishes with depth, although the reduced influence of these forces was recorded by Kli-Pi 1. These forces, however, remain significant, which is usually absent form uniaxial cyclic loading typically employed in laboratory experiments.
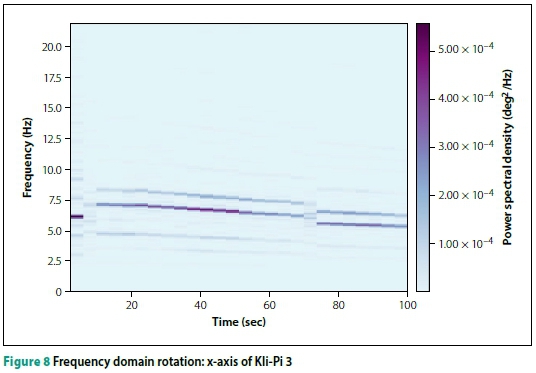
The FFT of the rotational response about the x-axis of Kli-Pi 3 (Figure 8) appears similar to that of the deflection with the density profile strongly concentrated around the discrete spectra associated with the train geometry. This is indicative of a response that is strongly linked to the macroscopic response of the substructure instead of the mesoscale particle behaviour as with the displacements. The negative gradient of the spectra with the progression of time for all the FFT-based figures is a direct result of the decreasing train velocity over time, owing to the positive track gradient.
Mechanical work and energy methods
Considering that the motion of the Kli-Pi was quantified about all three spatial dimensions, application of kinetic and potential energy principles is a cogent analysis method. The assumption can be postulated whereby the position of the Kli-Pi, over a relatively long period of time, remains unchanged. Even though the filtered data represents a relative position (zero-centred data), the assumption is that a constant position before and after the passage of the train represents an absolute datum. The total work associated with the Kli-Pi consists of both kinetic (UK) and potential energy (Up) components. The angular moment of the Kli-Pi is ignored owing to the difficulty associated with the calculation of the moment of inertia and the small rotation angles. The work generated by the potential or gravitational field is equal to the negative change of the potential energy of a rigid body (Stewart 2012). Also, following from Newton's second law of motion, the mechanical work exerted on a rigid body can be shown to equal the change in the kinetic energy. If the total energy is to be conserved for a Kli-Pi moving along a path C, given by a function r(t), through a conservative force field F, Equation 1 must hold:
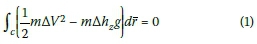
Where:
ΔV = change in body velocity vector
Δhz= change in body elevation with respect to the potential field
m = mass of the body (400 g for every Kli-Pi)
g = gravitational constant
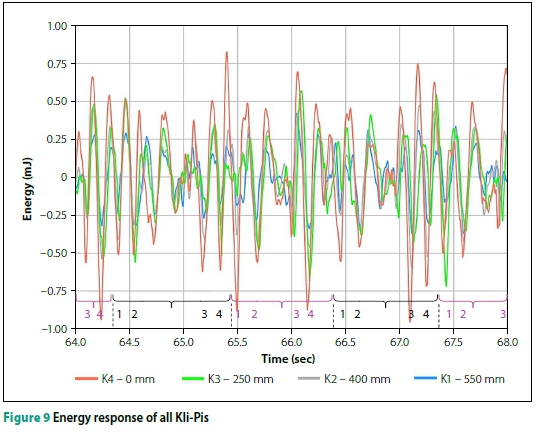
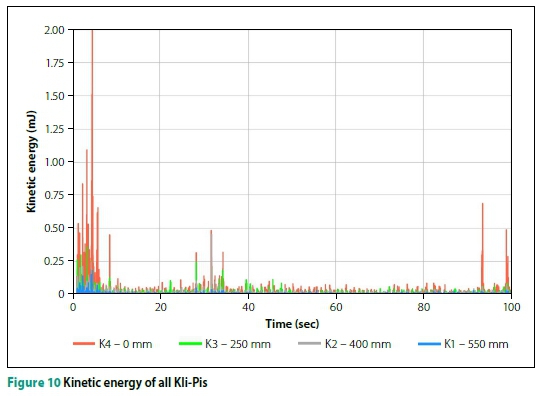
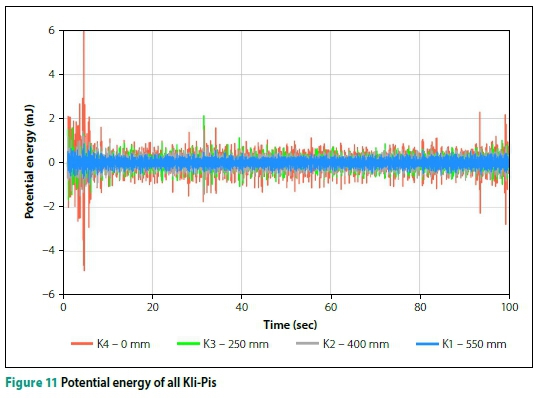
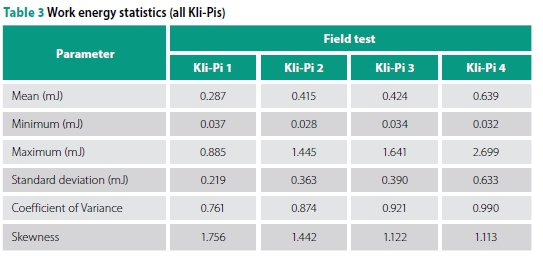
The total energy associated with any one of the Kli-Pis can be expressed as a function of time. The total energy is illustrated over a short period of time (Figure 9) in addition to the isolated kinetic (Figure 10) and potential (Figure 11) energy over the entire duration of the test. Note that the kinetic energy always attains a positive magnitude, whereas the potential energy is either positive or negative depending on the position relative to the datum. Figure 9 illustrates a consistent pattern whereby the peak-to-peak magnitude of the total energy decreases with depth for most of the passing axles. The mean peak-to-peak magnitude for Kli-Pi 4 positioned on the sleeper, over the entire duration of the test, is 0.639 mJ, reducing to 0.287 mJ for Kli-Pi 1 in the subballast (Table 3 on page 22). The total energy associated with Kli-Pi 2 and Kli-Pi 3 is nearly identical owing to the overlapping stress frusta. For the first few load cycles (Figure 10), the kinetic energy highlights the initial reorientation and movement of the installed instruments in combination with the significant lateral and longitudinal locomotive traction forces adding to the overall energy composition. Thereafter, the kinetic energy constitutes only a small portion of the total energy, except for the impact load near 31.5 s and another smaller impact load closer to the end of the test at 99 s. This explicit distinction between the kinetic and total energy provides a clear illustration of the presence of impact loads. The potential energy (Figure 11) contributes the largest proportion of the total energy. Like the kinetic energy graph, the increased axle mass of the locomotives is represented by larger amplitudes, followed shortly thereafter by the repetitive wagon axles with a small degree of variation. The standard deviation of the total energy (peak-to-peak) reduces from 0.633 mJ for Kli-Pi 4 to 0.219 mJ for Kli-Pi 1. The significance of the statistical characteristics of this metric follows in the next section.
Statistical descriptors
Reviewing both the measurements and literature, the underlying probabilistic nature of the particle response is clear. Descriptive statistics is employed to quantitatively compare these results. For each dataset, a total of 2 000 of the largest peak-to-peak amplitudes was extracted to obtain a representative sample for each DoF. This number was obtained through an iterative process until a representative distribution of peak-to-peak amplitudes had been extracted. This number is larger than the number of passing axles due to the stochastic nature of the measurements, especially that of the non-uniform displacements, producing a relatively large number of peak-to-peak amplitudes that need to be accounted for. For each DoF, the minimum, mean, maximum, standard deviation, coefficient of variance (CoV) and skewness statistics were calculated. Of all the statistics analysed, the mechanical work provided the most representative and significant results compared to that of the displacement and rotation statistics.
Displacement
Figure 12 illustrates the difference among the three spatial dimensions. For any given spatial direction, the largest mean peak-to-peak displacement is associated with the sleeper (Kli-Pi 4). A large component of the displacement is associated with the longitudinal direction (x-axis), caused predominantly by tractive wheel-rail forces. This longitudinal component, together with a slightly smaller lateral component, reduces with depth as the force and corresponding displacement dissipates through the ballast matrix. Similarly, the vertical peak-to-peak displacement reduces substantially with depth as the stress frusta is spread over a larger contact area. As noted, the displacements associated with Kli-Pi 2 and Kli-Pi 3 are nearly equal, owing to the overlapping of stress frusta between these two locations. Considering that the mean displacement is associated with the expected outcome of the probability distribution, isolated events will occur where positive or tensile strain is observed at the interface that can lead to a rearrangement of the otherwise stable ballast matrix.
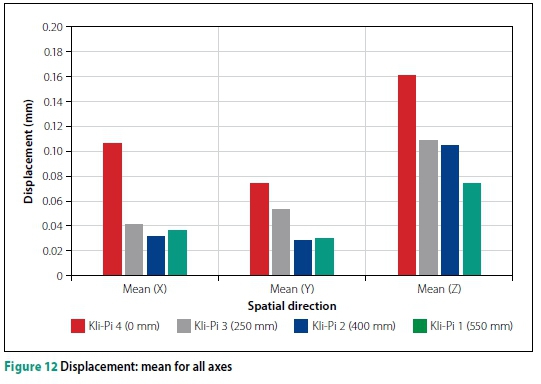
Figure 13 illustrates the significant influence of uncontrolled variables, such as the amplitude of the applied load, associated with the field test. It is intriguing that for all the axes the CoV decreases with depth, likely due to the dissipation of energy and the increasing number of potential pathways in the ballast matrix through which the load can transfer. The magnitude of the CoV is similar among all three axes, with the largest measurements associated with the longitudinal (x-axis) displacement instead of the expected vertical (z-axis) displacement associated with the loading vector. The CoV associated with the longitudinal direction (x-axis) is pronounced only with the sleeper and the sleeper-ballast interface.
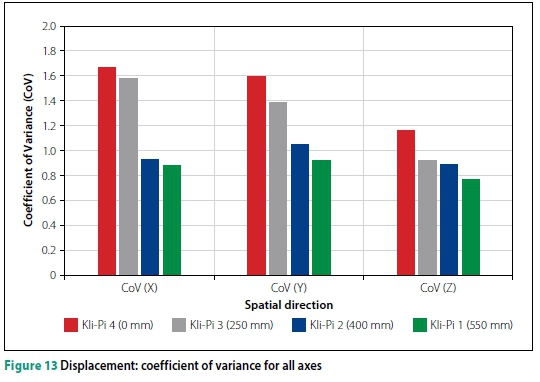
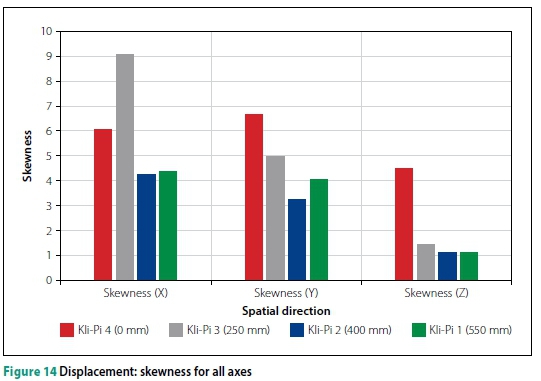
Figure 14 illustrates positive skewness for all the displacement statistics. The data is significantly skewed in the longitudinal (x-axis) and lateral (y-axis) directions compared to the vertical (z-axis) direction, primarily caused by the locomotive tractive forces. These forces are largely dissipated through the sleeper-ballast interface near the position of Kli-Pi 3, where after the skewness decreases noticeably for the instruments positioned at greater depth in the ballast.
Rotation
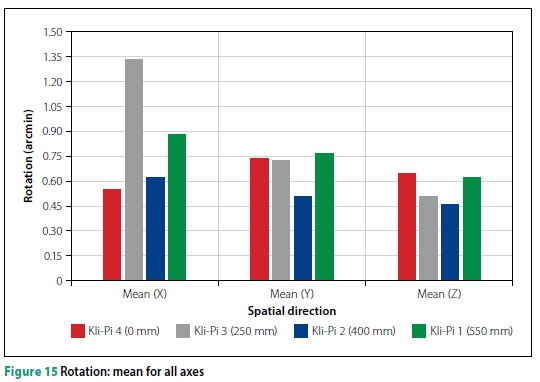
The relationship between the rotation statistics and depth of installation is less clear compared to the displacement statistics. From the time-series data it was concluded that the preferred axis of rotation is primarily associated with the behaviour of the sleeper. The largest mean rotation (Figure 15) is associated with Kli-Pi 3 which is prone to transverse PSR resulting from the sleeper above, followed by Kli-Pi 1. The mean peak-to-peak amplitude for any instrument or DoF remains relatively small, with only a fraction of a degree rotation being measured. This finding was verified during the analysis stage, whereby the rotational velocity (prior to the integration to calculate the attitude or orientations) was rarely measured to be greater than one degree per second.
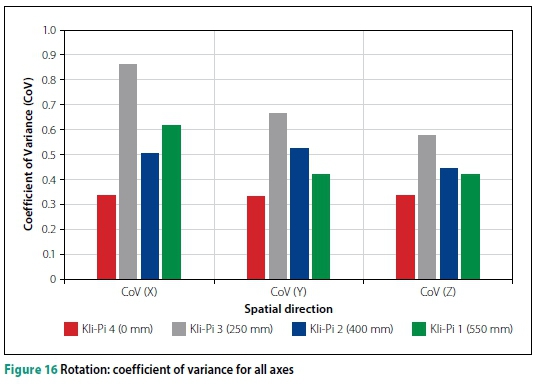
The CoV statistics (Figure 16) illustrate the rigidity of the sleeper where the CoV is relatively small in the longitudinal (x-axis) and lateral (y-axis) directions. Comparing the two metrics, the difference in magnitude of the rotational CoV is significantly smaller than that of the displacement CoV (Figure 13). A small reduction in the CoV with depth is present when comparing Kli-Pi 3 and Kli-Pi 4.
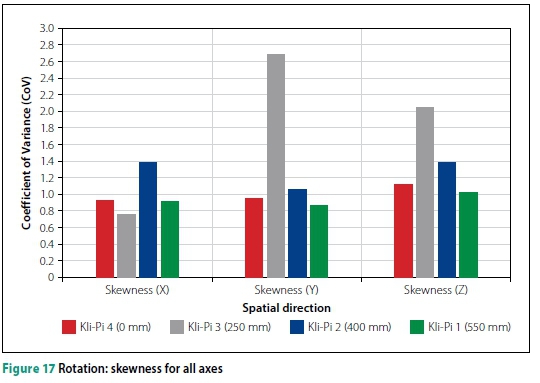
The skewness metric of the rotational measurements is much smaller in magnitude compared to that of the displacements (Figure 17) - the average skewness statistic decreases from a typical value of 5 for the displacement skewness to less than 1 for that of the rotation skewness, indicating a reduced sensitivity for the rotation of the particle to be affected by localised or mesoscale effects and forces. The reduction in magnitude of the skewness statistic with depth is only valid for the yaw (z-axis) vector; the other DoF appears randomly distributed. The rotational response is more strongly influenced by the macroscopic characteristics, which corresponds to the frequency domain results (Figure 8); the rotational response produced a more concentrated spectral density around geometry-dependent frequencies compared to the that of the displacements.
Mechanical energy
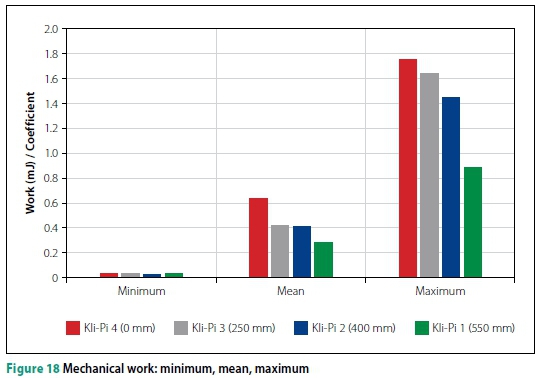
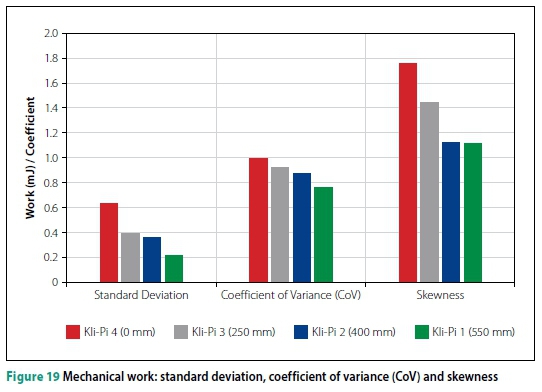
Finally, when considering the mean energy of the field test (Figure 18) the variability introduced by impact loads, varying axle mass and larger particle translations produces a broad range of metrics - the maximum peak-to-peak energy (2.699 mJ) is significantly larger in proportion to that of the minimum (0.032 mJ) and mean (0.639 mJ) energy statistics. This variability is also apparent when considering the CoV metric (Figure 19). For the standard deviation, CoV and skewness statistics, a negative correlation exists with depth for the field test, exemplifying the probabilistic response of the ballast. These phenomena likely stem from both the dissipation of energy and the increasing number of load paths with depth as the load is distributed. From the results presented by Kruyt and Rothenburg (2002) it is known that with an increase in the confinement stress, the shape of the parameter's PDF shifts from an exponential to Gaussian distribution. Correspondingly, this should yield a smaller skewness statistic with depth, which is observed with the field test results. This also indirectly relates the coordination number to the shape of the PDF. The most confined Kli-Pis, positioned at depth in the granular layers, converge towards a skewness value of 1.1, which is indicative of an exponential distribution. The increase of the skewness statistic corresponds with an increase in both the standard deviation and CoV.
CONCLUSIONS
The importance of studying and quantifying the mechanical behaviour of granular media was noted by Cowin and Satake (1979). Following the successful development and deployment of Kli-Pi, new information regarding the dynamic behaviour of ballast particles within a representative environment has been presented. The fundamental behaviour of ballast particles on a particle or mesoscale was characterised by a probabilistic or non-deterministic response.
Historically, the influence of lateral and longitudinal forces, principal stress rotation, particle rearrangement and spectral frequencies has been confined to theoretical discussion and numerical investigations. The results presented in this paper, however, provide valuable insight and supportive evidence for these existing theories and formulations.
Few studies account for all the possible DoFs apart from the direction of load application which is always in the vertical direction. For this field test, the transfer or large longitudinal and lateral forces throughout the substructure were measured as increased displacements in these spatial directions. During the passage of the locomotives, the peak-to-peak magnitude of the displacement parallel to the primary load direction was measured to be smaller than that of the longitudinal direction where traction forces are exerted. Complex, oval-shaped translational patterns were observed to extend throughout the ballast structure, extending down to the subballast interface, as predicted by numerical models. Owing to the probabilistic response of the ballast, in combination with the overlapping stress frusta of the wheel loads, non-uniform strain distribution was measured. The variation in the loading, material and support conditions in the field test significantly amplified the standard deviation, CoV and skewness statistics of the peak-to-peak displacement, rotation and energy measurements. An increase in particle confinement was measured as an increase in energy density about specific frequencies for both experiments, which agrees with the findings of Liu et al (2016b) with the implementation of SmartRock.
Finally, the introduction of the mechanical work energy parameter provided the most representative information. This provides an unambiguous parameter to quantify the magnitude and variance of the quasi-static loads and confinement characteristics. The distinction between the kinetic and potential energy highlighted the effects of the depth of influence for impact forces, locomotive traction forces and the initial particle rearrangement after the installation of the instruments. The minimum, mean and maximum work energy statistics illustrated a strong correlation with the depth of installation. The skewness statistic of the Kli-Pi installed at the greatest depth converged to a value of 1.1. This corresponds with a confined granular state where the probability distribution function tends towards an exponential distribution, corresponding to existing literature. The increase of the skew-ness statistic corresponds with an increase in both the standard deviation and CoV.
Test regimes over a longer period should be perused with the inclusion of typical maintenance and corrective geometry activities. The effects of ballast particle properties, level of fouling, train speed, moisture ingress and the substructure condition, all contributing to both the macroscopic and mesoscale behaviour, have not been investigated or considered in the results. Alternative instrumentation locations should be included, particularly the centre portion of the sleeper and ballast. The proof-of-concept to accurately quantify mesoscale ballast dynamics in detail has, however, been successfully demonstrated.
ADDITIONAL INFORMATION
The following tables provide a summary of the field test statistics - statistics of the displacement (Table 1), rotation (Table 2) and work energy (Table 3).
ACKNOWLEDGEMENT
Transnet Freight Rail is gratefully acknowledged for sponsoring the Chair in Railway Engineering in the Department of Civil Engineering at the University of Pretoria.
DECLARATION
The authors declare no potential conflicts of interest with respect to the research, authorship, and/or publication of this article.
REFERENCES
Aikawa, A 2009. Techniques to measure effects of passing trains on dynamic pressure applied to sleeper bottoms and dynamic behaviour of ballast stones. Quarterly Report of Railway Technical Research Institute, 50(2): 102-109. [ Links ]
Audley, M & Andrews, J D 2013. The effects of tamping on railway track geometry degradation. Proceedings of the Institution of Mechanical Engineers, Part F: Journal of Rail and Rapid Transit, 227(4): 376-391. [ Links ]
Bennett, R, Hayes-Gill, B, Crowe, J A, Armitage, R, Rodgers, D & Hendroff, A 1999. Wireless monitoring of highways. Smart Structures and Materials 1999: Smart Systems for Bridges, Structures and Highways, 3671: 173-182. [ Links ]
Bowness, D, Lock, A C, Powrie, W, Priest, J A & Richards, D J 2006. Monitoring the dynamic displacements of railway track. Journal of Rail and Rapid Transit, 221: 3-22. [ Links ]
Broekman, A & Gräbe, P J 2018. Development and calibration of a wireless, inertial measurement unit (Kli-Pi) for railway and transportation applications. Proceedings, 37th Annual South African Transportation Conference (SATC 2018), pp 521-531. [ Links ]
Cowin, S C & Satake, M 1979. Continuum mechanical and statistical approaches in the mechanics of granular materials. Journal of Rheology, 23(2): 243-256. [ Links ]
Cundall, P A & Strack, O D L 1979. A discrete numerical model for granular assemblies. Géotechnique, 29(1): 47-65. [ Links ]
Gräbe, P J & Clayton C R I 2009. Effects of principal stress rotation on permanent deformation in rail track foundations. Journal of Geotechnical and Geoenvironmental Engineering, 135(4): 555-565. [ Links ]
Graizer, V M 2010. Strong motion recordings and residual displacements: What are we actually recording in strong motion seismology? Seismological Research Letters, 81(4): 635-639. [ Links ]
Indraratna, B, Ngo, N T & Rujikiatkamjorn, C 2011. Behaviour of geogrid-reinforced ballast under various levels of fouling. Geotextiles and Geomembranes, 29(3): 313-322. [ Links ]
Ju, S H, Lin H T & Huang J Y 2009. Dominant frequencies of train-induced vibrations. Journal of Sound and Vibration, 319: 247-259. [ Links ]
Kempe, V 2011. Inertial MEMS: Principles and Practice. 1st ed. Cambridge, UK: Cambridge University Press. [ Links ]
Kitamura, R 1980. Analysis of deformation mechanism of particulate material based on the probability theory. PhD Dissertation, Japan: Kyoto University, p 17. [ Links ]
Kouroussis, G, Caucheteur, C, Kinet, D, Alexandrou, G, Verlinden, O & Moeyaert, V 2015. Review of trackside monitoring solutions: From strain gauges to optical fibre sensors. Sensors, 15(8): 20115-20139. [ Links ]
Kruyt, N P & Rothenburg, L 2002. Probability density functions of contact forces for cohesionless frictional granular materials. International Journal of Solids and Structures, 39: 571-583. [ Links ]
Lamas-Lopez, F, Cui, Y J, Costa Aguiar, S & Calon, N 2017. Assessment of integration methods for displacement determination using field accelerometer and geophone data. Journal of Zhejiang University, 18(7): 553-566. [ Links ]
Lekarp, F, Isacsson, U & Dawson A 2000. State of the Art. II: Permanent strain response of unbound aggregates. Journal of Transportation Engineering, 126(1): 76-83. [ Links ]
Lemkin, M & Boser, B E 1999. A three-axis micromachined accelerometer with a CMOS position-sense interface and digital offset-trim electronics. IEEE Journal of Solid-State Circuits, 34(4): 456-468. [ Links ]
Li, D, Hyslip, J, Sussmann, T & Chrismer, S 2015. Railway Geotechnics. Boca Raton, FL: CRC Press, pp 93-100. [ Links ]
Liu, S, Huang, H, Qiu, T & Gao, L 2016a. Comparison of laboratory testing using SmartRock and discrete element modelling of ballast particle movement. Journal of Materials in Civil Engineering, 29(3): 1-7. [ Links ]
Liu, S, Huang, H, Qiu, T & Gao, Y 2016b. Study on the ballast particle movement at different locations beneath crosstie using "SmartRock". Proceedings, 2016 Joint Rail Conference, Columbia, SC. [ Links ]
Liu, S, Haung, H, Qiu, T & Kwon, J 2016c. Effect of geogrid on railroad ballast particle movement. Transportation Geotechnics, 9: 110-122. [ Links ]
Lobo-Guerrero, S & Vallejo, L E 2006. Discrete element method analysis of railroad ballast degradation during cyclic loading. Granular Matter, 8(3): 195-204. [ Links ]
Makse, H A, Johnson, D L & Schwartz, L M 2000. Packing of compressible granular materials. Physical Review Letters, 84(18): 4160-4163. [ Links ]
Milne, D, Le Pen, L, Watson, G, Thompson, D et al 2016a. Measuring ballast acceleration at track level. Proceedings, 3rd International Conference on Railway Technology: Research, Development and Maintenance. 5-8 April 2016, Cagliari, Sardinia, Italy. [ Links ]
Milne, D, Le Pen L, Watson, G, Thompson, D et al 2016b. Proving MEMS technologies for smarter railway infrastructure. Procedia Engineering, 143: 1077-1084. [ Links ]
Milne, D R M. Le Pen L M, Thompson D J, Powrie, W 2017. Properties of train loading frequencies and their applications. Journal of Sound and Vibration, 397: 123-140. [ Links ]
Mvelase, G M, Anochie-Boateng, J K & Gräbe, P J 2012. Application of laser-based technology to quantify shape properties of railway ballast. Proceedings, 31st Annual Southern African Transport Conference (SATC), Pretoria, pp 243-254. [ Links ]
Nathanson, H C & Wickstrom, R A 1965. A resonant-gate silicon surface transistor with high-Q bandpass properties. Applied Physics Letters, 7(4): 84. [ Links ]
Nejikovsky, B & Keller, E 2000. Wireless communications-based system to monitor performance of rail vehicles. Proceedings, IEEE/ASME Joint Railroad Conference, Newark, NJ, pp 111-124. [ Links ]
Rothenburg, L & Kruyt, N P 2009. Micromechanical definition of an entropy for quasi-static deformation of granular materials. Journal of the Mechanics and Physics of Solids, 57: 634-655. [ Links ]
Rucker, W 1982. Dynamic interaction of a railroad-bed with the subsoil. Proceedings, Soil Dynamics and Earthquake Engineering Conference, Southampton, UK, pp 435-448. [ Links ]
Straser, E G & Kiremidjian, A S 1998. A modular, wireless damage monitoring system for structures. Technical Report No 128. Stanford, CA: John A. Blume Earthquake Engineering Center, Stanford University. [ Links ]
Stewart, J 2012. Calculus, Early Transcendentals. 7th ed. Boston, MA: Cengage Learning. [ Links ]
Tutumluer, E, Huang, H, Hashash, Y & Ghaboussi, J 2006. Aggregate shape effects on ballast tamping and railroad track lateral stability. Proceedings, AREMA Annual Conference, 23 May 2006, Salt Lake City, UT, pp 17-20. [ Links ]
Wilke, D N, Govender, N, Pizette, P & Abriak, N E 2016. Computing with non-convex polyhedra on the GPU. Proceedings, 7th International Conference on Discrete Element Methods, 1-4 August 2016, Dalian, China, pp 1371-1377. [ Links ]
Woodman, O J 2007. An introduction to inertial navigation. Technical Report No 696. Cambridge, UK: University of Cambridge Computer Laboratory. [ Links ]
Zhai, W M, Wang, K Y & Lin, J H 2004. Modelling and experiment of railway ballast vibrations. Journal of Sound and Vibration, 270: 673-683. [ Links ]
Zhang, X, Zhao, C & Zhai, W 2016. Dynamic behaviour analysis of high-speed railway ballast under moving vehicle loads using discrete element method. International Journal of Geomechanics, 17(7). [ Links ]
BIBLIOGRAPHY
Selig, E T & Waters, J M 1994. Track Geo-technology and Substructure Management. 1st ed. London: Thomas Telford Ltd. [ Links ]
 Correspondence:
André Broekman
Department of Civil Engineering Engineering 1, Room 13-10 University of Pretoria
Pretoria 0002, South Africa
T: +27 12 420 4723, E: andre@broekmail.com
Hannes Gräbe
Department of Civil Engineering Engineering 1, Room 13-7 University of Pretoria
Pretoria 0002, South Africa
T: +27 12 420 4723, E: hannes.grabe@up.ac.za

ANDRÉ BROEKMAN is full-time PhD student and researcher in the Civil Engineering Department at the University of Pretoria, South Africa. In 2018 he obtained his MEng degree in Transportation Engineering (cum laude) under supervision of Prof Hannes Gräbe, having graduated with a BEng Hons Transportation degree (cum laude) in 2017 and a BEng Civil Engineering degree (cum laude) in 2016 at the University of Pretoria. He is also responsible for lecturing undergraduate students in the field of instrumentation design and assists with the development of new instrumentation hardware, software and communications technologies (Civiltronics) for undergraduate and post-graduate research projects.

PROF HANNES GRÄBE (Pr Eng, FSAICE) is a civil engineer with experience in the fields of track technology, geotechnology, advanced laboratory testing, field investigations, maintenance models and numerical analysis of track structures. He is Associate Professor: Transnet Freight Rail Chair in Railway Engineering at the University of Pretoria, where he lectures under- and post-graduate courses in railway engineering. He is also responsible for railway research, as well as for continuing professional development in the form of short courses presented to industry. He holds a PhD degree from the University of Southampton (UK).

