


Services on Demand
Article
 English (pdf)
 Article in xml format
 Article references
Indicators

Related links
-
 Cited by Google
 -
 Similars in Google
Share

 Permalink
Journal of the South African Institution of Civil Engineering
On-line version ISSN 2309-8775
Print version ISSN 1021-2019
J. S. Afr. Inst. Civ. Eng. vol.62 n.4 Midrand Dec. 2020
http://dx.doi.org/10.17159/2309-8775/2020/v62n4a4
TECHNICAL PAPER
Methodological approach for the compilation of a water distribution network model using QGIS and EPANET
A L Muller; O J Gericke; J P J Pietersen
ABSTRACT
This paper presents the development of a methodological approach based on the integration of free-of-charge open-source software, e.g. QGIS and EPANET, and engineering practices applicable to water distribution network design. The use of QGIS and EPANET, as well as the integration thereof with sound engineering practices and judgement, proved to be both viable and practical to enable practitioners to create a water distribution network model of an existing network in smaller developments or towns. Typically, in the latter smaller developments or towns, the professional cost associated with the additional time required when commercial licensed software is used, could be lower than the actual cost associated with the procurement of the licensed software itself. Hence, the developed process flow diagrams will not only potentially save time and money in comparison to a traditional, manual approach in EPANET, but will also provide guidance to practitioners and assist smaller municipalities in southern Africa facing challenges in terms of outdated records and budget constraints. It is envisaged that the implementation of the overall methodology will contribute to improved water infrastructure planning, design and management, especially in the southern African context where water resources are scarce and service delivery remains a pressing issue.
Keywords: EPANET, GHydraulics, GIS, QGIS, Voronoi polygons, water ‑distribution network
INTRODUCTION
Water resources management, planning and supply form an integral part of the functionality of water utilities (e.g. local authorities, municipalities and/ or water boards) throughout the world (Ormsbee 2006). This is particularly the case in semi-arid and arid regions where rainfall is low and water resources are scarce, The use of computer modelling systems for the simulation of water distribution networks (WDNs) can aid water utilities with the identification of problem areas within a water supply system, as well as enable the planning processes required for the ever-changing urban landscape. Availability of data and the format in which the data is available, pose significant challenges to the effective management of WDNs. By developing a more standardised method in which data can be stored, evaluated and processed to enable the modelling of a WDN, better management practices could be implemented, specifically within the Namibian and South African context.
Internationally, substantial research has been published on the relevance and applicability of WDN models implemented using EPANET software (Saminu et al 2013; Gama et al 2015; Ramana et al 2015; Georgescu et al 2016; Kara et al 2016; Shital et al 2016). Detailed guidelines on the compilation of a WDN model from existing geographical information systems (GIS) and end-user data are generally not available, especially within the southern African context. According to Berardi et al (2014), data availability is a major issue in many water utilities, Although some water utilities have network data in GIS format, the accuracy is not always acceptable, and some data is missing. In addition, the lack of efficient decision-support systems, that might exploit detailed information of the WDN, further reduces the motivation for improving the accuracy of data collection (Berardi et al 2014).
Saminu et al (2013) and Shital et al (2016) described the compilation of a WDN model by manually entering the data into the EPANET interface, However, the utilisation of different methods by means of which large data sets are processed in QGIS, and subsequently exported to EPANET have not been fully implemented in a single study or method (Salmivirta 2015), The use of a transitional package, i.e. plugin, to convert GIS data into EPANET readable file formats may be required, Advances in open-source software have resulted in the development of numerous such add-in/plugin packages for a wide range of applications within QGIS, Most of these add-ins in the public domain are made available free-of-charge and are frequently updated. Therefore, it is necessary to realise that the development of new WDN modelling tools is an on-going process that evolves on an almost daily basis along with advances in technology.
Despite the availability of all these add-in packages and tools currently available in QGIS, no comprehensive methodology for the development of a WDN model based on existing GIS data is available, Methodologies that do exist, e,g, Saminu et al (2013) and Shital et al (2016), do not address the extensive acquisition and/or processing of data and the tedious development of a WDN model, In essence, the acquisition of the required data sets may in some cases even prove to be a more tedious exercise than the compilation of the WDN model itself, Unavailability of data and the lack of record-keeping by water utilities are some of the factors that further complicate the practitioner's task of compiling a WDN model.
Based on the shortcomings discussed above, the need for a methodological approach is highlighted and justified, Such a methodological approach should enable practitioners to process large amounts of data and perform topological analyses on GIS-based feature classes, to ultimately create a representative WDN model. Hence, the primary objective of this study is to develop such a methodological approach based on the integration of free-of-charge open-source software, e.g. QGIS and EPANET, and engineering practices associated with water distribution network design. Since the proposed methodological approach would enable practitioners to create a water distribution network model of an existing network in smaller developments or towns, the professional cost associated with the additional time required when commercially licensed software is used, could be lower than the actual cost associated with the procurement of the licensed software itself, Hence, the developed process flow diagrams will not only potentially save time and money in comparison to a traditional, manual approach in EPANET, but it will also provide guidance to practitioners and assist smaller municipalities in southern Africa.
WDN models for any development or town should therefore no longer be seen as a tedious exercise, due to the advances in GIS software to process large data sets, provided that the data sets are up to date and well maintained. A summary of the study area is contained in the next section, followed by a description of the methodologies adopted and the results obtained, This is followed by the discussion and conclusions.
STUDY AREA
Swakopmund is located on the western coastline of Namibia in the Namib Desert in southwestern Africa, The elevations within the town range from 45 m above mean sea level to 0 m at the shore (USGS 2015), The topography enables the distribution of water by means of gravity feed for the greater part of the town, with a pressure tower and booster pumps for the higher-lying areas in the network, Essentially, the coastal towns of Walvis Bay, Swakopmund and Henties Bay are supplied with fresh water from the Central Namib Water Supply Scheme based at Swakopmund. The scheme is managed by NamWater and abstracts groundwater from wellfields in the Omaruru and Kuiseb Rivers, which are the nearest sources of potable water to the towns (Christelis & Struckmeier 2011). A vast array of consumers are served by the WDN of Swakopmund and the analyses conducted in this study are based on information from approximately 8 920 water meters used to monitor water consumption on a continuous basis, The details pertaining to the water supply schemes to Swakopmund are shown in Figure 1, Shortfalls in the water supply capabilities at the NamWater wellfields are supplemented by desalinated water from the Orano (previously known as Areva) desalination plant, The latter shortfall in water supply, especially surface water, could be ascribed to the fact that Namibia is an arid country, with the mean annual precipitation (MAP) of Swakopmund being less than 50 mm (Mendelsohn et al 2003), Hence, with no or limited fresh surface water sources, the low MAP further exacerbates the challenges faced by the Swakopmund Municipality in terms of assurance of water supply.

METHODOLOGY AND RESULTS
The methodology described in this section provides an overview of the processes that were followed, whilst the results are presented directly thereafter to highlight the exact nature and sequence of activities and the corresponding results.
Methodological framework
The methodological framework developed consists of process flow diagrams which could serve as a practitioners' guideline to integrate open-source software and engineering practices when WDN models of an existing network need to be compiled. Typically, the framework is inclusive of the following key processes (Figure 2):

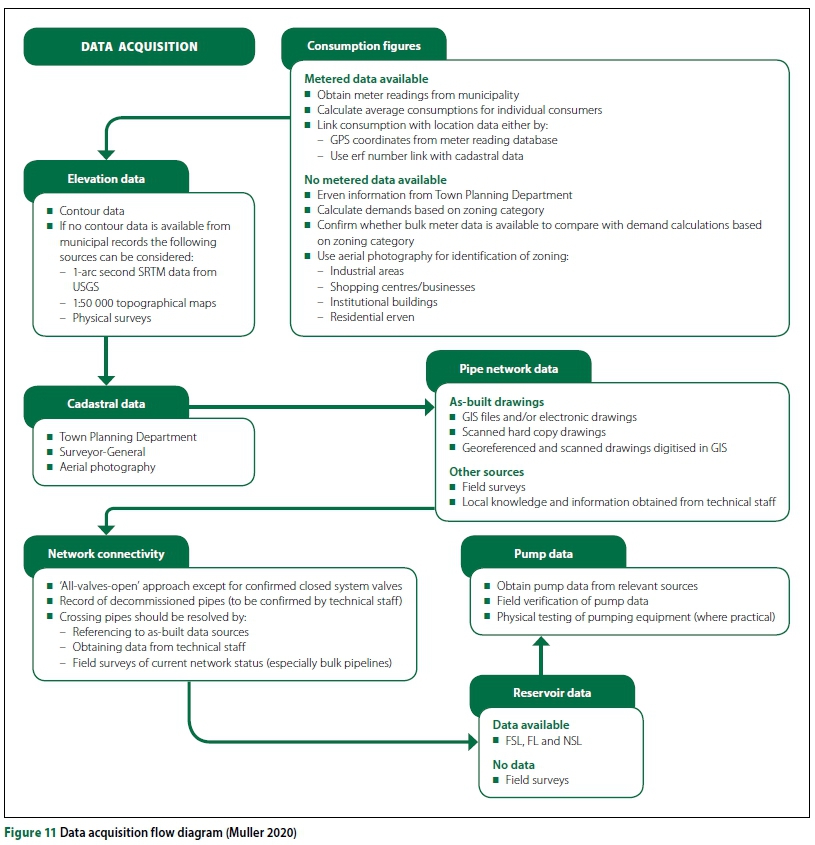
■ Data acquisition - inclusive of consumption figures, network connectivity and elevation, and cadastral, pipe network, reservoir and pump data sets.
■ Data processing - inclusive of data verification, filling of gaps, topology verification, data validation, allocation of friction factors, the compilation of EPANET data sets, and the subsequent processing and analysis thereof.
Data acquisition
Spatial data pertained to the location of pipelines, demand nodes and supply nodes (e.g. reservoirs and tanks) form the backbone of any WDN model. During the compilation of a WDN model, comprehensive data collection of the above-mentioned components is of high importance (Gama et al 2015). In this study, various data sources were identified to compile the Swakopmund WDN model, Typically, information was obtained from client records (as-built drawings, GIS data sets, computer aided design (CAD) drawings and hard copies of archived drawings), client representatives (maintenance personnel, operators and managers), field surveys and in some instances aerial imagery for above-ground pipes.
Fortunately, with the advent of GIS, data is nowadays better structured, maintained and stored by the municipality. However, in some cases alternative data sources were used in the absence of primary data.
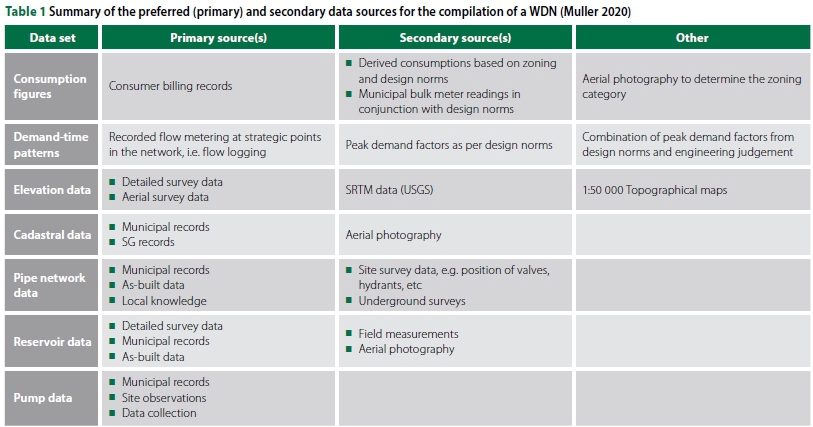
Innovative thinking and sound engineering judgement need to be demonstrated by any practitioner in cases where data sources are either incomplete or unsuitable. For example, historical aerial imagery may indicate a pipeline trench route during construction, while hand-held GPS devices can be used to pin site features such as valves, hydrants, pipeline routes, etc, after which, the data can be digitised and processed for further use. A summary of the preferred (primary) and secondary data sources used in this study to compile a WDN model, is listed in Table 1.
It is important to note that special care should be taken to ensure that all data sets and information received from the municipality are stored separately from all working files. This measure serves to prevent corruption or alteration of source data during processing. The use of revision numbers and unambiguous file name allocations for new or processed files will prevent the loss of data and the use of incorrect or outdated data for processing and analysis purposes.
Consumption figures
Account data comprising historical water consumption should be available from the Financial Department of a water utility if no data is available from the Engineering Department. These data sets were processed using Microsoft Excel, and any redundant columns containing administrative data (i.e. name of owner, street address and property valuation) were discarded in cases where it would not be required at a later stage. In GIS, the 'tabular joins' function was used to facilitate the linking of spatial data sets (i.e. shapefiles) and non-spatial table formats, i.e. comma separated values (CSV) and database file (DBF), provided that there was at least one unique corresponding column in each of the data sets, For example, if meter readings are available without GPS coordinates, the probability is high that erf numbers are present in one of the reference columns of the data received from the water utility. Erf numbers, in turn, are normally associated with projected and coordinated cadastral shapefiles. By making use of the erf numbers as common join field, the consumption figures can be linked to the shapefile.
Elevation and cadastral data
Both the elevation and cadastral data were obtained from the Swakopmund Municipality. In some cases, elevation data may not be as readily available from the water utility as expected, Suitable alternative sources for elevation data include 1-arc second Shuttle Radar and Topography Mission (SRTM) data from the United States Geological Survey (USGS), 1:50 000 topographical maps, or topographical surveys by means of conventional methods.
SRTM data can be downloaded in a GeoTiff format which consists of a raster with associated numerical values, i.e. elevations, allocated to all cells, The 1:50 000 topographical maps can be obtained from the Surveyor-General (SG) in raster format, Contour data from the 1:50 000 topographical maps should be converted to vectors by tracing the contour lines with polylines, whereafter the process as described for the creation of a digital elevation model (DEM) from contour lines can be followed, In South Africa the National Geospatial Information (NGI) provides digital contour data, 1:50 000 topographical maps in vector format, as well as digital terrain model (DTM) data files, The digitising of contours to generate a DTM or DEM should only be considered as the last resort, since the process is regarded as inaccurate.
Pipe network data
Skeletonisation refers to the process of identifying selected pipes within a WDN that are deemed to have the greatest importance and which need to be included in a WDN model (Mays 2000). The latter process largely involves a significant amount of engineering judgement to determine which pipes and/or components are to be included and/ or excluded from a WDN model. Typically, the pipe network data includes GIS shape-files, CAD drawings, scanned as-built drawings (raster images) and field drawings. Where uncertainty existed regarding the accuracy of the data, or where there was contradictive data for certain pipe sections, field surveys were conducted.
Network connectivity remained a challenge for the case study area. Due to the age of the infrastructure in the town, the data from the layouts resulted in numerous crossing lines representing pipelines. Where crossing lines were encountered, uncertainty arose as to whether these pipelines are connected by a crossing piece, two tee pieces or whether there is any connection at all. In cases where as-built drawings did not clearly indicate connections between crossing pipes of varying diameter, the pipelines were regarded as separate lines. The probability that crossing pipes of equal diameter were connected was considered high, and these pipes were modelled accordingly, while the contrary was true for pipes varying significantly in diameter.
The status of isolation valves in the network, albeit open or closed, may have a notable impact on pressures and flow velocities in the WDN. Isolating valves can either be closing clockwise or counter clockwise, making it difficult to determine whether a critical zone valve is closed or opened. Especially older isolating valves do not have appropriate markings that indicate the closing direction of the spindle, making the determination of their 'open' or 'closed' status a tedious exercise. As an initial approach for the compilation of the WDN model, an 'all-valves-open' approach was followed for all pipes, except where the status of the valves in the network could be confirmed. It is proposed that a similar approach should be followed initially when new WDN models are compiled, after which the identification of closed valves and pressure zones may be done as part of the calibration of the WDN model.
All line features representing pipelines were defined by only two vertices, as the linking of nodes and line features during later stages of the model development depended on lines being defined as such, The Explode Lines geo-algorithm in the Processing Toolbox was used for the creation of single-line features from polylines that originated from the data as received from the municipality. The aforementioned geo-algorithm creates a new vector layer in which each line of the original layer is replaced by a set of lines, representing the segments in the original line. Although EPANET is capable of processing polylines, the creation of denser Voronoi polygons (due to an increased number of nodes) is more beneficial during the allocation of demands to the WDN. A preliminary check for duplicate entities was done prior to commencing with data processing.
Reservoir data
The Engineering Department of any municipality or water utility should be able to provide the relevant information pertaining to the elevation data and storage capacities of reservoirs. Typical elevation levels that are of significance include the full storage level (FSL), floor level (FL) and normal service level (NSL). In the event that the aforementioned data is not available, physical measurements can be conducted on-site by using conventional methods.
Pump station data
Pump stations in a WDN are largely limited to booster pump stations and lifting pump stations that supply elevated tanks. The pump data used is based on site visits, performance criteria provided by the suppliers and actual recordings.
Data processing
Upon receiving all the data from the various sources, as mentioned above, the next step was to verify the data and conduct cross-checks between data sources where possible. Under ideal circumstances it would be preferable to have multiple data sources which support each other; however, this is seldom the case. For Swakopmund, an as-built database of approximately 28 drawings was georeferenced. The georeferenced drawings enabled cross-checking of the CAD and GIS data, which proved to be quite accurate for the majority of the WDN in cases where as-built drawings were available.
Setup of attribute tables and verification of attribute data
The digitising and conversion of data into shapefiles commenced after all the data had been acquired and verified. During this step, special care was taken to ensure that the spatial projection of the data was correct, as all further measurements would be dependent thereon. In Namibia, the Transverse Mercator projection is used with the Schwarzeck Datum, while it is not uncommon to encounter data sets using the WGS 84 Datum (Mugnier 2006). In the latter instance it may be necessary to apply x and y constants, depending on the source of the data. Open-source data sets may be in geographical (latitude/longitude) projection, which in turn needs to be projected and transformed to correspond with the specific projection and associated datum under consideration to enable any geometry calculations. Depending on the requirements of the water utility and the extent and nature of the project, the number of and details contained in the initial attribute fields may vary. Attribute fields should at least contain the length and diameter of the pipes, along with a unique identification number (ID).
Filling of gaps in data
Further verification of attribute data entailed the verification between data sources and the contents of the attribute data table, i.e. pipe diameters in the line vector shapefile representing the pipelines should be the same as the diameter and material as indicated on the georeferenced drawings. With the attribute tables compiled for the various vector features, columns were sorted, and empty data fields were identified. Attribute data fields were sorted numerically to identify which features lacked attribute data. Alternatively, 'Styles' were applied according to attribute data and the missing data was represented visually in QGIS.
Topology verification
Topology describes the relationships between points, lines and polygons that represent the features of a geographical region (QGIS Development Team 2016). The relationship between features proved to be a crucial point of interest, which required significant attention, Problems regarding topology included duplicate records (both for pipes and metered data), short pipe sections, i.e. less than 1 m in length, and ill-connected lines. Most of the latter instances could be ascribed directly to bad draughting practice during the initial digitising of the water network drawings.
In cases where different pipelines did not converge at their start or end vertices, the connectivity between the pipes could not be accurately exported to EPANET, which ultimately resulted in errors during the initial analysis. In addition, duplicate features would also result in erroneous connectivity between entities exported to EPANET. On the other hand, if duplicate pipes were exported and did not register as errors during the analysis, inaccurate flow and pressure results would be modelled due to the flow being split between two pipes of the same diameter and length.
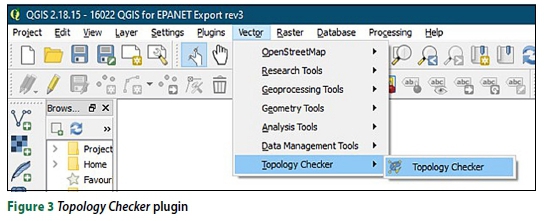
As for metered data represented by a point shapefile, duplicate features would cause an increase in point demand values; hence, an increase in flow and head loss. A challenge posed by duplicate records/ features is that it cannot easily be identified visually. The 'must not have dangles', 'must not have duplicates' and 'must not have invalid geometries' rules were applied in the Topology Checker plugin (Figure 3) to conduct the topology verification for the line vector layers.
All duplicate line features were listed in the 'Error' field after the application of the 'must not have duplicates' rule. Duplicate entities were deleted carefully to ensure that no data was lost in the process, Ill-connected features were identified during the application of the 'must not have dangles' rule, The latter identified lines were typically not connected to other lines at both ends. In some instances, the dangles were representative of the on-site pipeline network where single lines terminate at the properties of end users, thus not forming part of a ring-feed supply. For the remaining dangles which were identified, the lines were edited graphically and connected as required.
The topology of the point file containing the average consumption figures was evaluated by applying the same rules as used for the line features, except for the 'must not have dangles' rule. Pipelines with a length attribute of less than 1 m were regarded as redundant features. The practical analysis of such short sections of pipe was not deemed viable; hence, the data was filtered to indicate these sections and rather combine them into single segments with the longer adjoining pipeline features.
Validation of processed data
Subject to the compilation of the data sets containing the WDN data, the data was circulated to the municipal representatives in the Technical and GIS Departments for comment. The data was presented in drawing format and comments thereon were received. Typical inputs from the Swakopmund Municipality included information on pipelines that had been decommissioned, new pipelines that were installed, but that were not digitised and included in the GIS database, and clarification on connectivity where bulk mains and reticulation mains crossed. The distribution and updating of data were done over a period of approximately one month, with updated information being redistributed to representatives for further comments. The meetings held with the team of representatives from the municipality and the use of visual aids, e.g. a digital data projector to highlight the WDN features, yielded much quicker results, since the updating of attribute fields and connectivity of the features could be resolved immediately.
Allocation of friction factors to vector line entities
Friction factors were allocated based on a representative Hazen-Williams (HW) C-factor of 140, which is a common value between asbestos cement (AC) and unplas-ticised polyvinyl chloride (uPVC) pipes (Mays 2000). Further calibration, especially in terms of friction factors, was done at a later stage, since the initial HW C-factor of 140 was deemed to be too high and secondary losses would therefore not be accounted for sufficiently.
Compilation of data sets for EPANET
The correct setup of attribute fields was fundamental in the compilation of the data sets prior to export to EPANET using the GHydraulics plugin. Despite some of the automated features built into the GHydraulics plugin, a manual approach was followed in addition to ensure that the topology of the exported data was correct, especially with regard to junction creation and connectivity with line features. The required attribute fields for exportation to EPANET are listed in Figure 4.

QGIS compilation of a WDN model
This section describes the use of QGIS to compile input data sets for WDN modelling in EPANET. A brief overview of the setup of project parameters within EPANET is also provided.
Elevation data
Contour data for Swakopmund was supplied by the municipality from their GIS database. The contours were generated from a grid aerial survey which was conducted simultaneously with the aerial photography of the town. A DEM was created from the contour shapefile. The following steps were followed during the creation of the DEM:
a. Contour lines were split into separate line segments by distance, The V.split, length geo-algorithm splits vector lines into shorter segments using a maximum specified distance between nodes. The resulting length of all segments is expected to be equal and not longer than the given length parameter. Normally 10 m lengths should be sufficient, depending on the processing capabilities of the computer being used.
b. Nodes were extracted from lines using the Extract Nodes geo-algorithm, which uses a line or polygon layer to generate a point layer with points representing the nodes in the input lines or polygons.
c. Bearing in mind that the start and end vertices of the different line segments overlap, duplicate points were created by the Extract Nodes geo-algorithm. The latter duplication was removed by using the Delete Duplicate Geometries geo-algorithm. In other words, duplicated geometries are identified and removed without considering their attributes. Hence, in cases where two features have identical geometries but different attributes, only one of them will be added to the resultant layer.
d. The final step in the compilation of the DEM was completed by using the SAGA Nearest Neighbour geo-algorithm. The Add Raster Values to Points geo-algorithm (Figure 5 on page 37) was used to extract data from the specified raster (DEM) layer and to add attributes from the DEM to a selected point file (junctions).Consequently, the geo-algorithm creates a new point layer based on the sampling points' positions and the attributes extrapolated from the underlying raster cells, In using such an approach, elevation values from GeoTiff or other elevation data files in raster format can typically be applied to the nodes within a WDN model.

Creation of junctions
Junctions were created by converting polyline vertices to points using the Convert Polygon/Line Vertices to Points geo-algorithm. The resultant point shapefile consisted of numerous duplicate features which were deleted. Attribute fields as per Figure 4 were allocated to the point features representative of junctions in the WDN model. All the attribute fields containing numerical values were entered as such to have a 'precision' of up to 4 decimal places.
Linking start and end nodes with line attribute data
The 'STARTCRD', 'ENDCRD' and 'CRD' fields (cf. Figure 4) provided common join fields between the line features layer and the junctions layer. After selecting the properties menu of the line features shapefile, a join was created between the 'STARTCRD' attribute field of the line features shapefile and the 'CRD' attribute field of the point shapefile. The corresponding 'DCID' attributes were then copied to the NODET attribute field. The process was repeated for the 'ENDCRD' attribute join as well, and the corresponding 'DCID' attributes were populated to the NODE2' attribute field.
Creation of Voronoi polygons from network nodes
Voronoi polygons were created by using the junctions' layer as input layer to obtain areas of representative demands which could be allocated to the junctions. Figure 6 represents the various input fields to be completed for the Voronoi polygons function. The created layer was renamed and saved as a separate polygon shapefile. The validity of the created layer, i.e. intersections, closed holes, and fix node ordering, was verified with the Check Geometry Validity geo-algorithm. No errors or validity issues were identified during the analysis. However, should such errors occur, a systematic approach needs to be followed by the visual inspection of each geometry issue and correcting the geometries accordingly. The Voronoi polygons applicable to the study area are shown in Figure 7.


Adding consumption figures to Voronoi polygons
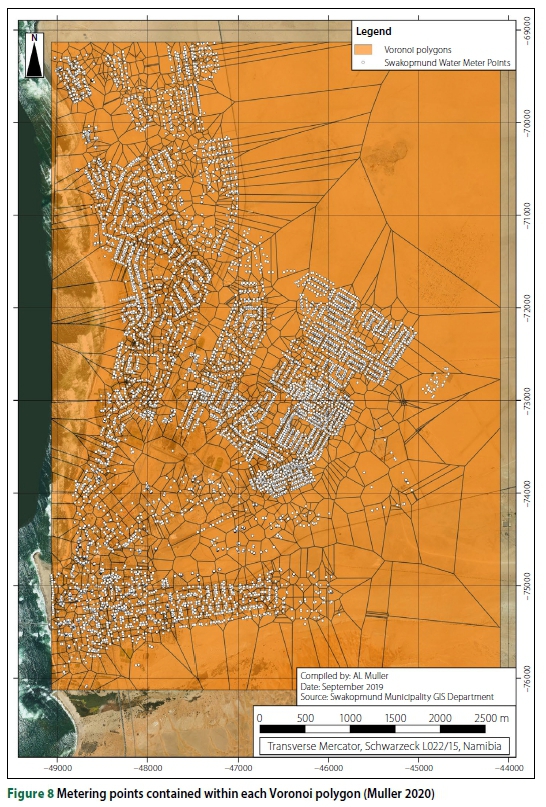
The point file associated with the consumption figures of each water meter was overlaid in the GIS model. All these points are located within the Voronoi polygons.
An average consumption figure associated with each water meter (represented by a point in the vector point file) was assigned to a specific attribute field in the 'Swakopmund Water Meter Points' point shapefile as shown in Figure 8.
The Join Attributes by Location geo-algorithm was used to combine the consumption figures from the individual points into a single value for each Voronoi polygon. The Voronoi polygon shapefile created from the junctions and the point file containing the consumption data were set as the target vector layer and the join vector layer, respectively. The geometric predicate was set to include all points that are contained within the polygon areas of the Voronoi layer. It is important to note that the attribute summary setting must be set to: 'Take summary of intersecting features'; otherwise the consumption figures would not be inclusive of all records contained within a Voronoi cell, but would only include the value of the first data record encountered. Statistics for summary settings were required to be set to 'SUM', since the total sum of the consumption figures per Voronoi cell is required. The 'Joined Table' setting was also selected to keep all records, including non-matching target records, especially in cases where a Voronoi polygon may not contain any consumption figures covered by its area. A resultant layer was also created which contains the original Voronoi polygon features and the sum of the consumption figures located within each polygon area.
Addition of consumption figures to nodes
A common attribute field, i,e, DCID, exists between the Voronoi polygon and point shapefiles. Hence, the common attribute field was also transferred to the joined layer to link the consumption figures to the junctions as shown in Figure 9. At this point, special care was taken to ensure that the consumption figures' units were correct, i,e, litres per second. Other units may be used, but it should be noted that the setup of the project defaults within EPANET has to align with the unit values allocated during this step. For the Swakopmund data set, the average annual daily demand (AADD; k£/day) figures were multiplied by a 1 000 and divided by 86 400, resulting in demand values in litres per second. The calculation was done during the transfer of the attribute values from the joined attribute column to the junctions' demand attribute column. An expression was compiled using the expression dialog for the calculation of attribute values.
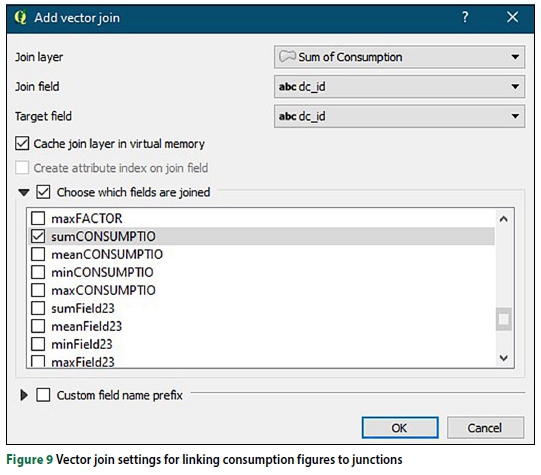
With reference to Figure 9, it is important to note that the 'sumCONSUMPTIO' field refers to the sum of all the AADDs of the demand nodes located within a Voronoi polygon.
Exportation of data using the GHydraulics plugin
All the fields that were required for the successful exportation of information were populated and the associated shapefiles were created. By selecting the settings tab under the GHydraulics menu as shown in Figure 10, the relevant shapefile layers were allocated to the correct predetermined fields within the GHydraulics plugin, No reservoirs, pumps, tanks, etc, were added to the GIS database for export to EPANET. For smaller networks, inputs can be made to run the analysis within QGIS using EPANET as analysis engine. However, troubleshooting using the latter method becomes difficult when compared to the clear error messages generated within the EPANET interface.

The Darcy-Weisbach (litres per second) template was exported, due to the fact that the demands allocated to the individual junctions were in litres per second, Although the friction factor was specified for the Hazen-Williams equation, the Darcy-Weisbach template was used for exportation purposes. The required adjustments to the head loss equation were implemented in EPANET.
WDN model setup in EPANET
The hydraulic analysis of the WDN was done by means of EPANET. It was preferred to conduct all hydraulic analyses using only the EPANET software to minimise risks of instability where EPANET is used in the background as analysis engine. As the software develops in the future, it may be more feasible to conduct analyses within the QGIS environment; however, the functionality of the GHydraulics plugin did not lend itself towards the full scope of the analysis, especially in terms of demand patterns and peak factors.
Demand patterns
Time-based demand patterns based on a variable daily consumption can be activated in EPANET. These patterns can either be based on actual recorded diurnal patterns obtained during flow logging within the WDN, or it could be based on theoretical data.
Hydraulic project parameters
Firstly, the applicable reservoir data was entered into EPANET at the appropriate locations within the model, and subsequent components such as valves, control valves and pumps were added as well, By making use of the 'Darcy-Weisbach litres per second' template within the GHydraulics plugin, the hydraulic project parameters were set up automatically. The GHydraulics plugin does not have a standard template for the Hazen-Williams equation in combination with the 'litres per second' flow units. Upon accessing the INP-file in EPANET, the flow units were confirmed to be in 'litres per second' and the head loss formula was set to 'H-W for the Hazen-Williams equation.
EPANET analysis
The preceding steps enabled and culminated into the actual hydraulic modelling analysis being performed in EPANET. According to Rossman (2000), as summarised below, EPANET will issue specific 'Error and Warning' messages when problems are encountered in performing a hydraulic modelling analysis:
a. Pumps cannot deliver the flow or head
b. Network is disconnected
c. Negative pressures exist
d. System unbalanced
e. Hydraulic equations are unsolvable, i.e. numerically unstable.
The most common error encountered during the setup of the Swakopmund EPANET WDN model was associated with network connectivity, From these identified errors, corrective measures were proposed as set out in the preparatory steps described in the previous sections, In essence, error identification and verification became an iterative process of correcting identified errors in the GIS shapefile, exporting data to EPANET, setting up the EPANET parameters, and data analysis. The error verification process continued until a successful performance of the WDN model was achieved.
After several rounds of editing of the GIS data, exporting of the data to EPANET, and repeating the analysis, errors regarding connectivity became less abundant, and corrections were made within EPANET. However, it is important to emphasise that all changes to the EPANET model were duplicated in the GIS shapefile to maintain an identical representation of the WDN in both the GIS and EPANET models. The aforementioned process would apply to minor changes to individual pipes or nodes, as the setup of hydraulic parameters and other EPANET functions will not be required. In cases where concerns regarding the practicality and the danger of 'duplication' using the aforementioned procedure exist, it is recommended that all changes be limited to the GIS model and the resulting data should subsequently be exported to EPANET. Such an approach will ensure identical data sets being used in both the GIS and EPANET environment. In terms of updating the GIS and hydraulic models upon the installation of new pipes or decommissioning or upgrading of existing pipelines, similar procedures are recommended to ensure that both the GIS and EPANET models are representative of the actual on-site conditions.
DISCUSSION
In this paper, methodological procedures were described to enable the effective integration of QGIS and EPANET. Based on the methodology adopted and the results obtained, summative guidelines in the form of process flow diagrams as part of a methodological framework are presented in Figures 11 and 12, respectively.
It is evident from these figures that the two key processes, i.e. data acquisition and data processing, were achieved, In essence, the processing and analysis of all the data were accomplished by integrating QGIS and EPANET, whilst recognising standard engineering practices associated with water distribution network design. However, consideration was given to the fact that the context and specific needs of water utilities may differ and that all the data sets might not be as readily available as in the case of the study area.
QGIS software containing improved features and processing capabilities is released on a frequent basis, e.g. QGIS Version 3.8.2 'Zanzibar' (August 2019) and QGIS Version 3.10 A Coruna' (November 2019). Amongst the plugins that were developed for the latter versions, the QEPANET plugin exhibits similar functionalities as the GHydraulics plugin used in this study. Hence, it is recommended that the improved functionalities of the QEPANET plugin and further integration of analyses within the QGIS package should be investigated and the required processes should be documented in a methodological manner.
Future studies should be directed towards the quantification of recommended man-hours and determination of associated
consultation fees for the development of a WDN model based on various parameters such as: (i) WDN size and area, (ii) data availability, (iii) length of pipes in the network, (iv) number of nodes to be analysed, and (v) level of modelling detail required. The latter parameters would provide municipalities with guidelines to be used for budgeting purposes, while practitioners would also then have a baseline guide to determine the required resources and time to be allocated for the compilation of a WDN model. In addition, the development of standard guidelines stipulating the minimum requirements (level of detail and methodology) of a completed WDN model for municipalities in southern Africa may prove valuable to provide municipalities with a benchmark when the terms of reference need to be compiled for the appointment and evaluation of service providers. Such a set of standards may also provide common ground for different analysis software packages, i.e. commercial and open-source software packages.
CONCLUSIONS
The developed methodological approach and associated process flow diagrams will not only provide guidance to practitioners, but could ultimately possibly also enable and assist municipalities in southern Africa facing challenges in terms of technical skills shortages, service delivery backlogs, outdated records and budget constraints -hence, the justification for such a methodology based on open-source software that does not require annual licensing or additional capital expenditure typically associated with commercial software products.
It is envisaged that the implementation of the methodology and the recommendations for future research will contribute to improved water infrastructure planning, design and management, especially in the southern African context where water resources are scarce and service delivery remains a pressing issue.
ACKNOWLEDGEMENTS
The Swakopmund Municipality is hereby thanked for providing all the relevant data sets and technical support. The Central University of Technology, Free State (CUT) is likewise thanked for supporting and funding this research. We also wish to thank the anonymous reviewers for their constructive review comments, which have helped us to improve the paper significantly.
REFERENCES
Berardi, L, Liu, S, Laucelli, D, Xu, S, Zeng, W & Giustolisi, O 2014. Energy saving and leakage control in water distribution networks: A joint research project between Italy and China. Procedia Engineering, 70:152-161. [ Links ]
Christelis, G & Struckmeier, W 2011. Groundwater in Namibia: An explanation to the Hydrogeologie al map. Windhoek, Namibia: Ministry of Agriculture, Water and Rural Development. [ Links ]
Gama, M C, Lanfranchi, E A, Pan, Q & Jonoski, A 2015. Water distribution network model building, case study: Milano, Italy. Procedia Engineering, 119: 573-582. [ Links ]
Georgescu, S C, Georgescu, A M, Madularea, R A, Piraianu, V F, Anton, A & Dunca, G 2016. Numerical model of a medium-sized municipal water distribution system located in Romania. Procedia Engineering, 119:660-668. [ Links ]
Kara, S, Karadirek, I E, Muhammetoglu, A & Muhammetoglu, H 2016. Hydraulic modelling of a water distribution network in a tourism area with highly varying characteristics. Procedia Engineering, 162: 521-529. [ Links ]
Mays, L W 2000. Water Distribution Systems Handbook. New York: McGraw-Hill. [ Links ]
Mendelsohn, J, Jarvis, A, Roberts, C & Robertson, T 2003. Atlas of Namibia. Cape Town: David Philip. [ Links ]
Mugnier, C J 2006. Grids and Datums: The Republic of Namibia. Photogrammetric Engineering and Remote Sensing, 72 (8): 883-884. [ Links ]
Muller, A L 2020. Development of a water network modelling system to evaluate existing municipal water infrastructure in developing countries: Case study of Swakopmund, Namibia. Unpublished MEng Dissertation. Bloemfontein: Central University of Technology, Free State. [ Links ]
Ormsbee, L E 2006. The history of water distribution network analysis: The computer age. Proceedings, Water Distribution System Analysis Symposium, of WDSA 2006, 27-30 August 2006, Cincinnati, OH. [ Links ]
QGIS Development Team 2016. QGIS User Guide. Open Source Geospatial Foundation. https://qgis.org/en/site/ (accessed on 4 December 2020). [ Links ]
Ramana, G V, Sudheer, V S S & Rajasekhar, B 2015. Network analysis of water distribution system in rural areas using EPANET. Procedia Engineering, 119:496-505. [ Links ]
Rossman, L A 2000. EPANET 2 User's Manual. Cincinnati: US Environmental Protection Agency. [ Links ]
Salmivirta, T 2015. Water distribution development and modelling in Keetmanshoop, Namibia. Unpublished MSc Dissertation. Tampere, Finland; Tampere University of Technology. [ Links ]
Saminu, A, Abubakar, N & Sagir, L 2013. Design of NDA water distribution network using EPANET. International Journal of Emerging Science and Engineering, 1 (9): 5-9. [ Links ]
Shital, K, Krunali, M, Mehta, D & Yadav, V 2016. Simulation of existing water distribution network by using EPANET: A case study of Surat City. Global Research and Development Journal for Engineering, 2016: 184-192. [ Links ]
USGS (United States Geological Survey) 2015. SRTM Mission Summary, https://www.usgs.gov/centers/eros/science/usgs-eros-archive-digital-elevation-srtm-mission-summary?qt-science_center_objects=0#qt-science_center_objects(accessed on 4 December 2020). [ Links ]
 Correspondence:
Louwrens Muller
Department of Civil Engineering, Faculty of Engineering, Built Environment and Information Technology, Central University of Technology, Free State
Bloemfontein, South Africa
T: +264 61 379 005
E: louwrensm00@gmail.com
Prof Jaco Gericke
Department of Civil Engineering, Faculty of Engineering, Built Environment and Information Technology, Central University of Technology, Free State
Bloemfontein, South Africa
T: +27 51 507 3516
E: jgericke@cut.ac.za
Jaco Pietersen
Department of Civil Engineering, Faculty of Engineering, Built Environment and Information Technology, Central University of Technology, Free State
Bloemfontein, South Africa
T: +27 51 507 3693
E: jpietersen@cut.ac.za

LOUWRENS MULLER, Pr Tech Eng (ECSA), Inc Eng (ECN), is currently employed by Burmeister and Partners Consulting Engineers in Windhoek, Namibia. He graduated with an MEng (Civil) degree from the Central University of Technology, Free State (CUT) in 2020 and has a special interest in reticulation design and water resources management. He has 12 years' experience in the consulting engineering industry and has been involved in various multi-disciplinary projects.

PROF JACO GERICKE Pr Eng, IntPE (SA), is the Head of Department (Civil Engineering) at the Central University of Technology, Free State. He obtained his PhD Eng (Agriculture) degree from the University of KwaZulu-Natal in 2016 and has more than 20 years' professional and academic experience, mainly in the fields of hydrology, water resources management and river hydraulics. He has published a number of papers in the design hydrology field and is currently involved in four research projects funded by the Water Research Commission.

JACO PIETERSEN Pr Tech Eng is currently employed by the Central University of Technology, Free State (CUT). He graduated with B Tech Eng (Civil) and M Tech Eng (Civil) degrees from the CUT and has a special interest in flood hydrology and water resources management. In addition to his ten years' academic experience, he also worked at an internationally recognised civil engineering consultancy for five years. He is currently studying towards a D Eng (Civil) degree at the CUT.

