


Services on Demand
Article
 English (pdf)
 Article in xml format
 Article references
Indicators

Related links
-
 Cited by Google
 -
 Similars in Google
Share

 Permalink
Journal of the South African Institution of Civil Engineering
On-line version ISSN 2309-8775
Print version ISSN 1021-2019
J. S. Afr. Inst. Civ. Eng. vol.62 n.3 Midrand Sep. 2020
http://dx.doi.org/10.17159/2309-8775/2020/v62n3a5
TECHNICAL PAPER
The effect of lane blockage on signalised intersection performance -analysing and modelling
E Dogan; E Korkmaz; A P Akgüngör
ABSTRACT
Unexpected stops or entry/exit manoeuvres of vehicles on the road may cause the related lane to become blocked. When this blocking happens in a signalised intersection zone, it also affects intersection performance. Determining the extent of this effect will assist traffic engineers with intersection design and performance analysis. In this study, the effects of Lane Blockage (LB) on intersection performance under various traffic conditions were analysed according to two performance criteria. ANN (Artificial Neural Network) models were also developed to enable the prediction of intersection performance. As a result of the analysis, it was clearly determined that the effect of LB on intersection performance was limited at v/c <0.5. However, it was determined that the intersection performance may decrease between 10% and 110% under the condition of 0.5 < v/c, depending on the LB frequency and duration. Additionally, the developed ANN models have R > 0.95 and will therefore be useful in LB-related intersection performance analysis.
Keywords: lane blockage, signalised Intersection, ANNs, modelling, delay, intersection performance
INTRODUCTION
A temporary stop occurring in the signalised intersection approach lane usually causes Lane Blockage (LB) on the right/ left (depending on driving-hand side) lane. The reasons for this stop are random (e.g. accident, malfunction, etc) or non-random (presence of a bus stop). In either case, LB can significantly affect the performance of the intersection. Precautions should be taken to prevent or alleviate intersection performance reduction caused by LB. Therefore, determining the traffic situation levels where the negative effects of LBs are high is important for regulating counter-measures. In this study, the effects of LB Frequency (F-LB) and LB Duration (D-LB) at an isolated intersection were analysed at various volume/capacity (v/c) ratios. In addition, two ANN models were developed to predict Total Delay (T-Delay) and Move/ Total time ratio (M/T) using the analysis results. The (M/T) values are the ratio of the moving time of the vehicles in the intersection during the simulation period to the total time in the system.
Although studies about LB are limited in literature, from previous studies it was seen that researchers generally studied the effects of bus movements on the intersection. Wong et al (1998) studied the effects of bus-dwelling in an intersection.
Research indicated that bus-dwelling has a negative effect on delay when it happens in the range of 200 m from the stop line. It was also found that the delay becomes worse the closer the bus-dwelling happens to the stop line. Qi et al (2009) attempted to develop probability models between delays and unwanted events occurring on the road. Ghasemlou et al (2016) examined the impact of bus stops on road capacity by using the Cell Transmission Model. Their research showed that the negative effect of LB due to bus stops is significantly increased closer to the stop line. Other related studies were done by Rodriguez-Seda and Benekohal (2006), Ghasemlou et al (2012), and Amita et al (2015). Ghasemlou et al (2014) also tried to determine the effect of heavy vehicle traffic on a signalised intersection. Although some attempts were made to resolve this issue, there are still situations that have not been fully clarified. For instance, as far as we know, most studies have examined non-random bus stops and the effects of LB on the system as a result of these stops. In our study, random occurrence of LB was also considered. In addition, control delay calculations as per the Highway Capacity Manual (HCM) (TRB 2010) are suggested for non-LB events. It is also stated that, in the case of an LB event, this effect should be taken into account for delay analysis.
With this study, if there is an LB event in the intersection region, it will assist in the performance analysis of the intersection and in determining the level of performance. This study therefore tried to address the gap in this important issue.
In the next section (the methodological section) the geometric and signal system of the experimental intersection are illustrated, the LB event is described, and the simulation parameters explained. In the section following that the results of the LB event analyses are given. Additionally, the models are developed via ANNs and tested according to the performance criteria. In the last section, the analysis results are discussed, and conclusions are reached.
INTERSECTION GEOMETRY, LANE BLOCKAGE AND SIMULATION
Because safety is a problem it is very difficult to perform tests on the road itself when determining how an LB event affects intersection performance. Therefore, and for the sake of safety and simplicity, these studies were done using simulation programs (today there are a number of sophisticated traffic simulation programs available for traffic studies). With the help of these programs, variables that affect traffic flow, including driver behaviour, can be analysed by keeping other variables constant. In this study, the simulations of the LB event were performed with the TSIS v6.3 program. In the CORSIM program, situations occurring in less than 60 seconds and blocking the lane are described as short-term events. Examples of these events are parallel parking, parking manoeuvres and stops, as well as drop-off and pick-up of passengers in the lane without a bus pocket. The frequency and duration of these events can be adjusted by entering them into the simulation program so that their impact on intersection performance can be analysed. TSIS v6.3 is a widely used program consisting of CORSIM which simulates microscopic traffic, TRAFED used for creation of CORSIM traffic network, and other auxiliary modules (McTrans 2012).
The intersection shown in Figure 1 was created with the TSIS program. A four-leg intersection was used in the simulation, which is widely used in field applications. This intersection has two lanes of which the width is about 3 m (10 feet) for all approaches. The intersection phase plan consists of four phases, as shown in Figure 1. The green-light periods of this intersection for all phase plans are 30 seconds. The vehicle volume in each approach leg is distributed equally for the right, left and straight movements. In addition, it is assumed that there is no heavy vehicle traffic in the intersection, but that only passenger vehicles use this intersection. The aim is to decrease the number of variables and to observe the LB effect more clearly within these assumptions.
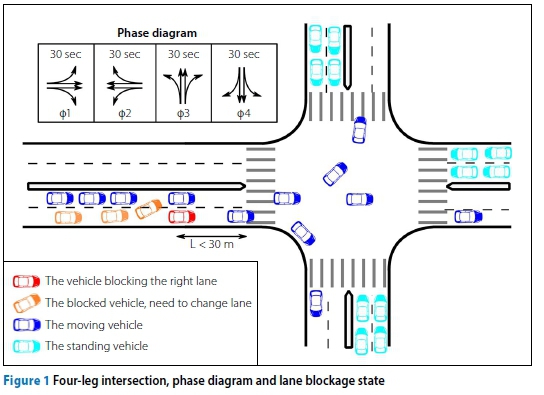
It is known that the negative effect of the LB event on intersection performance is elevated if the event is close to the stop line (Ghasemlou et al 2016). Therefore, situations in which an LB is 30 m away or closer to the stop line were examined in the simulations. Since the program can only analyse LB events for the right lane, the cases in which the LB happened in the right lane were investigated. Due to this restriction in the program, the study was only performed for right-hand drivers. The total duration (TimeSim) of each simulation was determined as 3 600 seconds. Considering that the green phase is 30 seconds, the amber 3 seconds and the all-red 1 second, approximately 26.5 cycles would occur within 3 600 seconds.
Thus, the queuing effect, due to vehicles being unable to pass the stop lane during the green phase, formed part of the analysis results. In addition, the simulations were repeated 100 times with different arrival headways, by keeping other parameters constant. Then the average values of simulation outputs were calculated and used for comparison purposes. The assumptions for intersection geometry, signal control and simulation are shown in Table 1.
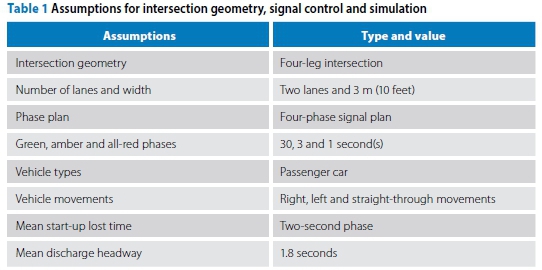
Four-leg intersections with two lanes on each leg are the most common types of intersections. This intersection type has been dealt with in many simulation-based studies (Soh et al 2010; Yang et al 2012).
The values of the mean start-up lost time and mean discharge headway were selected according to the Highway Capacity Manual 2010 (TRB 2010). In studies where capacity delay is investigated, the effect of heavy vehicles is also taken into account (Ghasemlou et al 2014; Qi et al 2009). Since only the effect of LB was investigated in this study, the passenger car was used as the vehicle type.
In the simulation, three variables (D-LB, F-LB and v/c) were analysed by constantly keeping two of them in simulation. D-LB and F-LB variables were considered as {10, 20, .... 60 sec} and {10, 20, 60 LB/h} respectively; the v/c ratio was also utilised as {0.1, 0.3, ...,1.1}. Therefore, the number of simulations reached were 21 600 (6 x 6 x 6 x 100). Another variable used in the analysis and in the development of the models was the Event Total Duration (ETD). The ETD was calculated by multiplying the frequency and the Duration of the LB Event, as illustrated Equation 1.
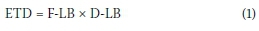
The fact that the ETD value is 3 600 at the intersection arm, in other words (F-LB = 60 LB/h and D-LB = 60 sec), indicates the situation in which the relevant lane is constantly blocked.
EFFECT OF LB EVENT ON INTERSECTION PERFORMANCE
Failure of traffic flow for any reason in the lane of a signalised intersection will affect the intersection performance. It can be predicted that the effect of the LB event to intersection performance will vary with D-LB, F-LB and (v/c). Therefore, changes in the performance of the intersection have been examined according to different values of D-LB, F-LB and v/c. As performance criteria, the total delay time (T-Delay) and the Move/Total time (M/T) values were considered. The T-Delay is a value expressed as vehicle-hours and represents the total delay values of all vehicles in the intersection during the simulation period (Roess 2011).
Scatter plots for the presence and absence of the LB event (LB vs No-LB) are given in Figure 2. These graphs are separated according to the two performance criteria and grouped according to the v/c ratios. It can be seen from Figure 2 that, as the v/c ratio increases, the T-Delay values increase and the M/T ratio decreases. In the case of No-LB, the values of T-Delay and M/T increase linearly on the dashed line shown in Figure 2, depending on the increase in v/c. However, with the change of F-LB and D-LB values, the spots begin to scatter. The figure shows that the T-Delay values started becoming affected after the v/c ratio reached 0.7. Because with v/c = 0.7 (turquoise dots), the data started to scatter along the vertical axis. This situation shows itself more clearly when v/c reaches the 0.9 and 1.1 values. This tendency is similar in the scattering of M/T values. However, M/T values started to increase their scattering on the graph after the v/c ratio had reached 0.5.
It is understood that the increase in delay value is linear in under-saturated traffic flow, in other words in the region
where the v/c ratio is less than 1. However, it can be seen that the delay values exponentially increase when the v/c value is 1.1. For instance, in the case of No-LB, the T-Delay value, which is 3.27 veh-hr for v/c = 0.1, increases to 25.5 veh-hr when v/c = 1.1. When the LB situation occurs, it can be seen from Figure 2 that the T-Delay value reaches 52 veh-hr for v/c = 1.1. For M/T values, it is observed that M/T is about 0.49 when the v/c is 0.1. With the v/c reaching 1.1, the M/T value drops to 0.30 without the effect of LB events. When considering the LB effect, it is understood that this has decreased to approximately 0.16.
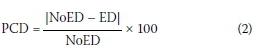
The effect of LB events occurring at distances close to the stop line on the delay is shown in Figure 3 as a percentage change. Depending on the v/c ratios, the percentage of change between the number of delays occurring in the absence and presence of LB events is calculated with Equation 2.
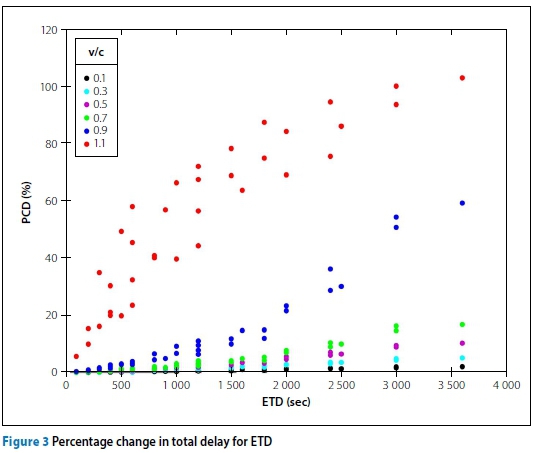
When Figure 2 is analysed, it is observed that there is an increase of 2.11% and 5.18% in PCD values respectively in cases where the v/c is 0.1 and 0.3, when the LB event times reach 3 600 seconds. When the v/c reaches 0.7, this value is approximately 17%. It can be seen that the PCD values increase linearly with the increase of the v/c from 0.1 to 0.7. However, when the v/c value reaches 0.9, it is understood that the effect of the LB event time has increased exponentially (blue point scattering). In this case, there is a delay increment of about 60% when the LB event duration is at its highest point (3 600 seconds). The state of v/c = 1.1, where the traffic flow is higher than the capacity, is given as red dots in Figure 3. It can be seen that the PCD values, which had increased rapidly since the beginning, increase by approximately 103% when the LB event duration reaches 3 600 seconds.
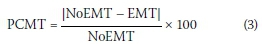
The scatter graph of the M/T values is shown in Figure 4. The scatter pattern is similar to that in Figure 3. However, it is observed that there is a difference in the rate of change of M/T after short-term events. The percentage change of M/T (PCMT) is calculated by using Equation. 3.
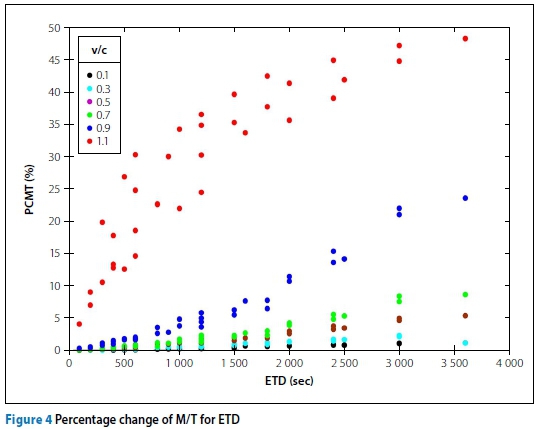
When Figure 4 is examined, it can be seen that the maximum increase of PCMT is about 48%. It is understood that this point is where v/c is equal to 1.1 and the ETD value is 3 600 seconds. Similar to the PCD graphic in Figure 3, it is seen that the PCMT value decreases rapidly when the v/c ratio and ETD values decrease.
When Figures 3 and 4 are examined, it is seen that there are some multiple points corresponding to the same v/c ratios and the same ETD values. For example, for ETD = 3 000 seconds, it can be observed that two red points (v/c = 1.1) or two blue points (v/c = 0.9) occur at the same vertical axis. The reason for this is that they have the same ETD value after the multiplication of different F-LB and D-LB values. Hypothesis testing was performed to determine whether the different F-LB and D-LB values giving the same ETD duration in the delay and M/T graphs were effective, and the obtained results from the hypothesis test are given in Table 2.
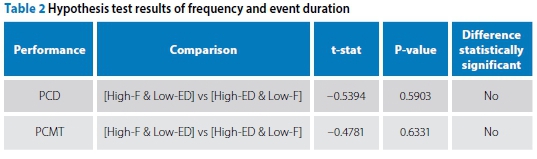
In the case of the same ETD value, the results of the two-sample t-test showed that high Frequency (F) or Event Duration (ED) does not have a statistical effect on performance. In this case, it is expressed that ETD is the main effective.
FORECASTING DELAY AND M/T WITH ANNS
As seen in Figures 3 and 4, different ETD and v/c values are effective in changing the T-Delay and M/T. It is also observed that performance values change specifically at different v/c ratios. Therefore, it is anticipated that the parametric models can be applied successfully. However, to be successful the models have to be designed according to each v/c value. For these reasons, it would be appropriate to develop models by using Artificial Neural Networks (ANNs) in order to estimate T-Delay and M/T values. An ANN is an artificial intelligence technique inspired by biological neurons. By connecting these neurons to each other with various coefficients, artificial neural networks occur. These networks are trained for different events and are now widely used to develop successful models. Various ANN-based studies exist, such as the development of delay models for signalised intersections (Murat & Baskan 2006; Murat 2006), signal control (Lin & Lee 1991; Srinivasan et al 2006) and queue length estimation (Chang & Su 1995). The ANN network used for prediction of the T-Delay and M/T were trained with the Levenberg-Marquardt algorithm (Levenberg 1944; Marquardt 1963), and the network architecture is shown in Figure 5. The hyperbolic tangent function in the hidden layer of the network and the linear transfer function in the output layer were used.
It is understood from Figures 2 and 3 that the ETD and v/c values directly affect T-Delay and M/T. For this reason, ETD and v/c variables were used as input variables in ANN models. In this study, two different ANN models estimating T-Delay and M/T values are given in Figure 5.
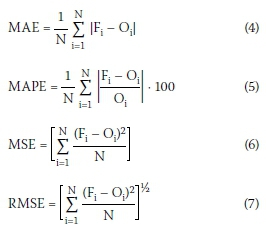
For the training of the ANNs, 70% of total data (216 x 0.70 = 152 data items), 15% (32 data items) for validation and 15% (32 data items) for testing were used. The data used for testing and training was not constant and consecutive but were randomly taken from the data set. Additionally, the performance of these models was compared with the Mean Absolute Error (MAE), Mean Absolute Percentage Error (MAPE), Mean Squared Error (MSE), and Root Mean Squared Error (RMSE) criteria given in Equations 4-7.
In ANNs training, ten-fold cross-validation was used, i.e. ANNs were trained in ten different training and validation sets divided from the data set (McLachlan et al 2005). The average of the error values obtained for these ten sets was considered as the error value of the ANNs. Thus, the performance of ANNs with different network architectures has been revealed more objectively.
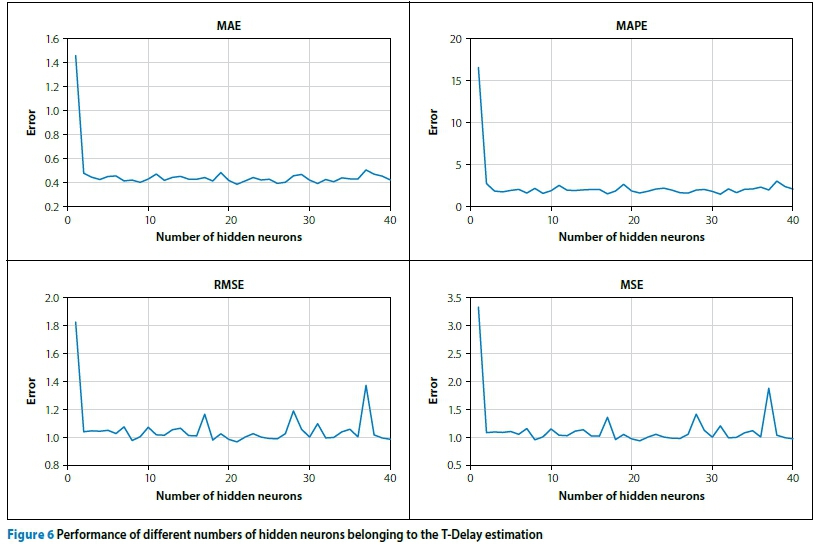
To investigate the effect of the different hidden layers on the performance of ANNs for T-Delay estimation, the estimation errors of the ANNs models with the number of hidden layers between 1 and 40 are shown in Figure 6. The highest error value is observed in the T-Delay model with only one hidden layer neuron. In general, the error values of the networks with different neuron numbers than 1 are close to each other and the lowest error values for the T-Delay occurred in the 2 x 21 x 1 (number of inputs - hidden neurons - output) network architecture. The MAPE value at this point is approximately 1.5%.
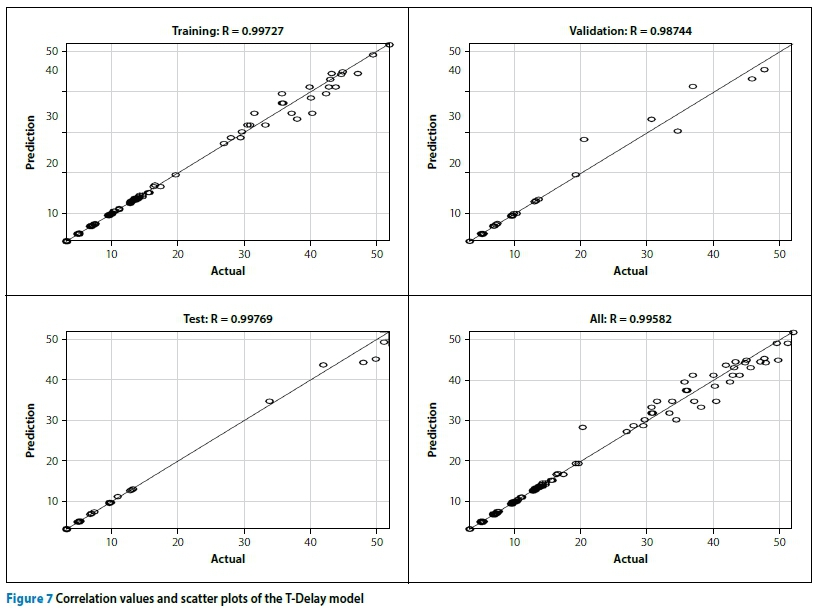
When comparing the estimates of the training, validation and test sets of the T-Delay model with the actual values, the correlation (R) values approaching 1 were found and are shown in Figure 7. It can be seen that the prediction and actual values, especially below 20 veh-hr delay values, are located at the R = 1 line. At higher delay values, it is understood that there is some scattering. There are cases in the dataset where v/c is less than 1 and larger. It is understood from Figures 4 and 5 that the intersection performance is affected differently in these two situations. The model consists of data covering both situations. Therefore, situations where the v/c is less than 1 (much data) are better predicted. However, although the forecast was successful in cases where v/c was higher than 1, it was not as good as the forecast in situations where v/c was less than 1. This situation explains the scattering in Figure 7.
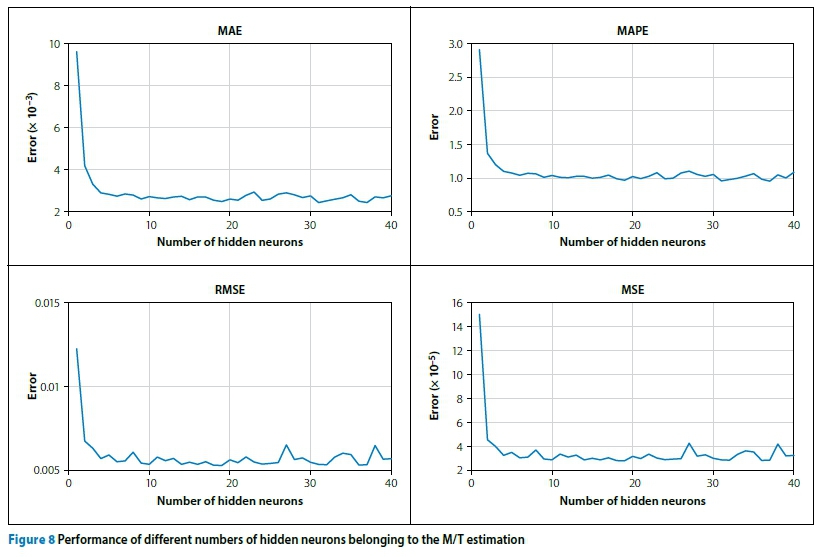
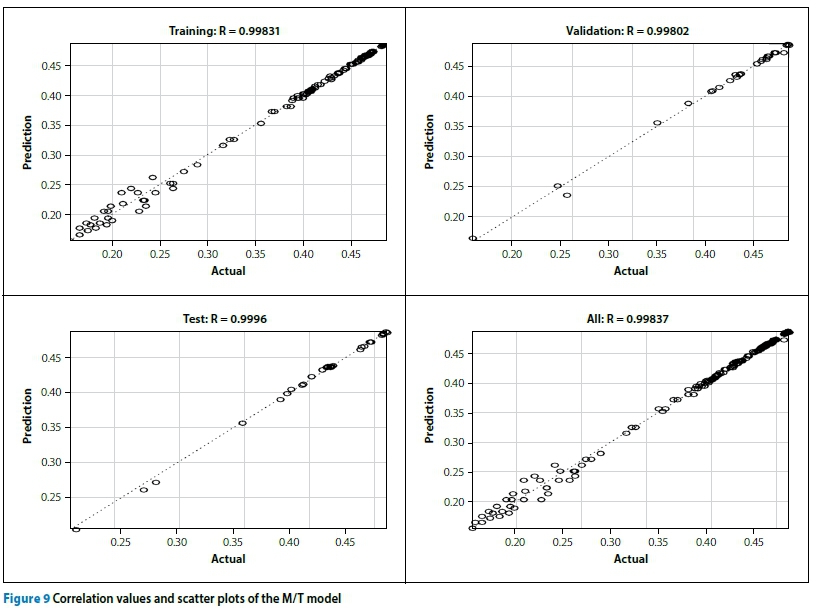
The effect of the different number of hidden layers on the performance of ANNs for M/T estimation is shown in Figure 8. The highest error value was observed in the M/T model with one hidden layer of neurons, similar to the T-Delay model. With the increase in the number of neurons, these error values suddenly decrease. The lowest error value is determined by the 2 x 19 x 1 network architecture. The MAPE value in this network architecture is below 1%.
The correlation values and scatter graphs of the training, validation and test sets of the developed 2 x 19 x 1 ANNs model for predicting the M/T ratio are shown in Figure 9 (p 59). It can be seen from Figure 9 that the correlation values are very close to 1 for training, validation and test sets. It is understood from the figure that the actual and predicted values for above 0.3 of the M/T ratios are less scattered than those below 0.3 for M/T ratios.
DISCUSSION AND CONCLUSION
In this study, the analysis of LB that occurred in the signalised intersection region was investigated. In the analysis, varied v/c rates, LB frequencies and durations were considered. The effects of these variables on intersection performance were determined by creating many simulations. T-Delay and MT ratios were observed as performance criteria. In addition, LB and intersection performance were modelled using the results of the analysis. Other results regarding analysis and models are listed as follows:
1. Increasing ETD and v/c values decrease the intersection performance.
2. If the ETDs of two LB events with different F-LB and D-LB are equal, the effects of these two different events on intersection performance are considered statistically the same.
3. The effect of the LB event on delay significantly increases from v/c = 0.7. This increase is also observed at lower v/c rates for M/T.
4. For v/c <1, the performance is seriously reduced only when the ETD gets closer to the simulation time. On the other hand, T-Delay and M/T ratios become very sensitive to the increase in ETD as it approaches the saturation level of the intersection. Therefore, planning should be organised for rapid response to LB events at periods of vc >1 at intersections.
5. At v/c <0.5, the increases in T-Delay and M/T as a result of the ETD increase are approximately linear. However, at v/c >0.5 these increases are exponential. Further studies to investigate the starting point of this change would contribute to a better understanding of the LB event.
6. The developed ANN-Latency and ANN-MT models have very high correlations. In addition, model errors
of training and test observations are close to each other and minimal. This indicates that models can generalise the event, that is they do not memorise it. As a result, the developed models can be used in real-world applications. LB occurs for a variety of reasons and it is very difficult to prevent all of them. However, their negative effects can be alleviated by various measures. It may be advisable to develop controls to avoid LB events, especially in densely signalised intersections. It is recommended that bus stops be removed from within intersection zones, or that bus schedules are rearranged according to the v/c ratios. Additionally, designing increased shoulder and lane widths could help reduce the negative impact of an LB event. It is recommended that response teams be located at critical intersections during periods of high v/c, thereby shortening the event response time.
DISCLOSURE STATEMENT
No potential conflict of interest was reported by the authors.
REFERENCES
Amita, J, Singh, J S & Kumar, G P 2015. Prediction of bus travel time using artificial neural network. International Journal for Traffic and Transport Engineering, 5(4): 410-424. doi: 10.7708/ ijtte.2015.5(4).06 [ Links ]
Chang, G L & Su, C C 1995. Predicting intersection queue with neural network models. Transportation Research Part C: Emerging Technologies, 3(3): 175191. doi: 10.1016/0968-090X(95)00005-4 [ Links ]
Ghasemlou, K, Aydin, M M, Tanyel, S, Topal, A & Çaliçkanelli, S P 2012. Effect of dwell time on performance of signalized intersections. Proceedings, 10th International Congress on Advances in Civil Engineering, Ankara, Turkey, 17-19 October 2012, pp 1-10. [ Links ]
Ghasemlou, K, Aydin, M M & Yildirim, M S 2016. An investigation on lane blockage effects at signalized intersections. International Journal for Traffic & Transport Engineering, 6(3): 289-302. doi: 10.7708/ijtte.2016.6(3).05 [ Links ]
Ghasemlou, K, Topal, A, Aydin, M M, Tanyel, S & Kazemi Afshar, A A 2014. Investigation of the effect of heavy vehicles on capacity of signalized intersections based on Bayes' theorem. Proceedings, 2nd Transportation & Development Congress: Planes, Trains, and Automobiles, Orlando, FL, 8-11 June 2014, pp 376-387. doi: 10.1061/9780784413586.036 [ Links ]
Levenberg, K 1944. A method for the solution of certain non-linear problems in least squares. Quarterly Journal of Applied Mathematics, 2(2): 164-168. [ Links ]
Lin, C T & Lee, C S G 1991. Neural-network-based fuzzy logic control and decision system. IEEE Transactions on Computers, 40(12): 1320-1336. doi: 10.1109/12.106218 [ Links ]
Marquardt, D W 1963. An algorithm for least-squares estimation of nonlinear parameters. Journal of the Society for Industrial and Applied Mathematics, 11(2): 431-441. [ Links ]
McLachlan, G, Do, K A & Ambroise, C 2005. Analyzing microarray gene expression data. New York: Wiley. [ Links ]
McTrans 2012. TSIS-CORSIM. Available at: http://mctrans.ce.ufl.edu/mct/index.php/tsis-corsim. [ Links ]
Murat, Y S 2006. Comparison of fuzzy logic and artificial neural networks approaches in vehicle delay modeling. Transportation Research Part C: Emerging Technologies, 14(5): 316-334. doi: 10.1016/j.trc.2006.08.003 [ Links ]
Murat, YS & Baskan, O 2006. Modeling vehicle delays at signalized junctions: Artificial neural networks approach. Journal of Scientific and Industrial Research, 65(7): 558-564. [ Links ]
Qi, Y, Teng, H & Martinelli, D R 2009. An investigation of incident frequency, duration and lanes blockage for determining traffic delay. Journal of Advanced Transportation, 43(3): 275-299. doi: 10.1002/atr.5670430303 [ Links ]
Rodriguez-Seda, J & Benekohal, R 2006. Methodology for delay-based passenger car equivalencies for urban transit buses. Transportation Research Record: Journal of the Transportation Research Board, 1988: 127-137. doi: 10.3141/1988-18 [ Links ]
Roess, R P, Prassas, E S & McShane, W R 2011. Traffic engineering. New York: Pearson/Prentice Hall. [ Links ]
Soh, A C, Rhung, L G & Sarkan, H M 2010. MATLAB simulation of fuzzy traffic controller for multilane isolated intersection. International Journal on Computer Science and Engineering, 2(4): 924-933. [ Links ]
Srinivasan, D, Choy, M C & Cheu, R L 2006. Neural networks for real-time traffic signal control. IEEE Transactions on Intelligent Transportation Systems, 7(3): 261-272. doi: 10.1109/TITS.2006.874716 [ Links ]
TRB (Transportation Research Board) 2010. Highway Capacity Manual (HCM 2010). Washington, DC: Transportation Research Board, National Research Council. [ Links ]
Wong, S C, Yang, H, Yeung, W A, Cheuk, S L & Lo, M K 1998. Delay at signal-controlled intersection with bus stop upstream. Journal of Transportation Engineering, 124(3): 229-234. doi: 10.1061/(ASCE)0733-947X(1998)124:3(229) [ Links ]
Yang, W, Zhang, L, He, Z, & Zhuang, L 2012. Optimized two-stage fuzzy control for urban traffic signals at isolated intersection and Paramics simulation. Proceedings, 15th International IEEE Conference on Intelligent Transportation Systems, 16-19 September 2012, Anchorage, AK, pp 391-396. [ Links ]
 Correspondence:
Erdem Dogan
Department of Civil Engineering Kirikkale University Yahsihan
Kirikkale 71451 Turkey
T: +90 318 357 42 42 Ext 1214 E: edogan@kku.edu.tr
Ersin Korkmaz
Department of Civil Engineering Kirikkale University Yahsihan
Kirikkale 71451 Turkey
T: +90 318 357 42 42 Ext 1080 E: ersinkorkmaz@kku.edu.tr
Ali Payidar Akgüngör
Department of Civil Engineering Kirikkale University Yahsihan
Kirikkale 71451 Turkey
T: +90 318 357 42 42 Ext 1255 E: akgungor@kku.edu.tr

PROF ERDEM DOGAN is Assistant Professor in the Department of Civil Engineering at Kirikkale University, Turkey, where he has been a faculty member since 2014. His research interests are in the fields of traffic flow, artificial intelligence applications in traffic control, and prediction models.

PROF ERSIN KORKMAZ obtained degrees in Electrical and Electronics Engineering in 2011 and in Civil Engineering in 2012, both from Erciyes University, Turkey. He has been working as Assistant Professor in the Civil Engineering Department at Kirikkale University since 2019. He completed his MSc degree in 2016 and received his PhD in 2019, and has published many articles and papers in national and international journals. He is interested in delay analysis, signalling, optimisation techniques and the analysis of traffic accidents.

PROF ALI PAYIDAR AKGÜNGÖR is Professor in the Civil Engineering Department at Kirikkale University, Turkey, where he is the head of the Transportation Division and teaches transportation courses. He received his BS and MSc degrees in Civil Engineering from Istanbul Technical University, Turkey, in 1989 and 1993 respectively, and earned his PhD in Transportation Engineering from the University of Pittsburgh, USA, in 1998. His research interests are traffic operation, traffic signal control, signalised intersections, mathematical models of delay estimation, queuing analysis and meta-heuristic optimisation techniques.

