


Services on Demand
Article
 English (pdf)
 Article in xml format
 Article references
Indicators

Related links
-
 Cited by Google
 -
 Similars in Google
Share

 Permalink
Journal of the South African Institution of Civil Engineering
On-line version ISSN 2309-8775
Print version ISSN 1021-2019
J. S. Afr. Inst. Civ. Eng. vol.62 n.3 Midrand Sep. 2020
http://dx.doi.org/10.17159/2309-8775/2020/v62n3a4
TECHNICAL PAPER
Physical model study of bedrock scour downstream of dams due to spillway plunging jets
A Bosman; G R Basson
ABSTRACT
The erosive power of a free-falling high-velocity water jet, flowing from a dam spillway, could create a scour hole downstream of the dam, endangering the foundation of the dam. Despite extensive research since the 1950s, there is presently no universally agreed method to predict accurately the equilibrium scour depth caused by plunging jets at dams. These formulae yield a large range of equilibrium scour dimensions. The hydrodynamics of plunging jets and the subsequent scour of a rectangular, horizontal and vertical fissured rock bed were investigated in this study by means of a physical model. Equilibrium scour hole geometries for different fissured dimensions (simulated with rectangular concrete blocks tightly prepacked in a regular rectangular matrix), for a range of flow rates, plunge pool depths, and dam height scenarios were experimentally established with 31 model tests. From the results, non-dimensional formulae for the scour hole geometry were developed using multi-linear regression analysis. The scour depth results from this study were compared to various analytical methods found in literature. The equilibrium scour hole depth established in this study best agrees with that predicted by the Critical Pressure method.
Keywords: erodibility, impinging jets, physical model, plunge pool, scour
INTRODUCTION
A free-falling high-velocity water jet, flowing from a dam spillway, could scour the bedrock downstream of a dam if the erosive capacity of the jet is large enough. The foundation of the dam could be endangered by the scour hole. It is therefore imperative to determine the equilibrium geometry of the scour hole to incorporate it at the design stage to ensure the stability of the dam.
Well documented cases, such as Kariba Dam on the Zambezi River (border between Zimbabwe and Zambia, Africa) and Wivenhoe Dam in Australia are prime examples where the plunge pool scouring had drastic consequences. The depth of the scour hole of Kariba Dam is approximately two-thirds of the dam height of 128 m (Noret et al 2012), while that of the Wivenhoe Dam is one-third of the dam height of 33.87 m (full supply level to spillway bucket lip) (Stratford et al 2013).
The purpose of this study was to simulate rock scour due to plunging jets in a physical model and to gain a greater understanding of the scouring process. The physical model results were then compared to the predictions of different analytical methods of the equilibrium rock scour depth. New formulae were developed to determine the scour hole geometry (depth, length, width and volume) based on stream power and the rock's movability number and settling velocity.
ROCK SCOUR
Bedrock scour downstream of a dam is a complex physical process and the complete understanding of the air-water-rock phase interaction in the scouring process is required. The free-falling jet could be split into three different modules, namely the falling jet module, plunge pool module and rock mass module as defined by Bollaert and Lesleighter (2014) in Figure 1.

Various researchers have studied the hydrodynamics of a free-falling jet in the air and the plunge pool. It was found that the fall height (Hw), issuance velocity (Vi), discharge, air entrainment, outlet shape and initial turbulence (Tu) influence the behaviour of the jet as it falls through the air (Van Aswegen et al 2001). The jet trajectory and energy at impingement with the plunge pool surface are dependent on the velocity of the jet (Vj), whereas the breakup length (Lb: distance for the jet core to dissipate in the air) is reliant on the initial jet turbulence intensity (Manso et al 2008).
Manso et al (2008) investigated the behaviour of the jet as it travels through the plunge pool. The jet velocity (Vj), impact angle (6) and turbulence at entering the plunge pool surface, as well as the plunge pool depth (Y) and geometry, determine the amount of energy that would be dissipated and how much of the jet core remains intact at impact with the bedrock. According to Ervine and Falvey (1987), the inner core diffusion angle (ain) of highly turbulent plunging round jets when travelling through a plunge pool is approximately 8°, whereas the outer expansion angle (aout) can increase up to 15°.
The plunge pool bed would scour if the erosive capacity of the jet exceeds the ability of the rock to resist it. To determine the conditions of the jet at impact with the rock bed, the velocity and pressure decay in the plunge pool need to be defined. Ervine and Falvey (1987) defined the maximum pressure of a circular jet at a certain distance below the plunge pool's free surface in terms of the velocity head and pressure coefficients to account for the fluctuating nature of the turbulent jet. Castillo et al (2014) determined the mean and fluctuating pressure coefficients for rectangular jets. Factors affecting the vulnerability of the erodibility of the rock are lithology, rock strength, joint spacing, joint orientation and joint condition (Annandale 2006).
Extensive research has been conducted on the prediction of rock scour depth due to plunging jets since the 1950s. However, there is no universally agreed upon method to accurately predict the equilibrium scour depth. Rock scouring is a complex physical process that is normally assessed in practice by empirical methods combining laboratory and field observations with some physics (Bollaert 2002).
Empirical or semi-empirical formulae, developed from physical model tests and prototype observations generally used to predict the plunge pool scour depth, are summarised in Table 1. Most of the empirical formulae for rock scour rely on the fall height and unit discharge.
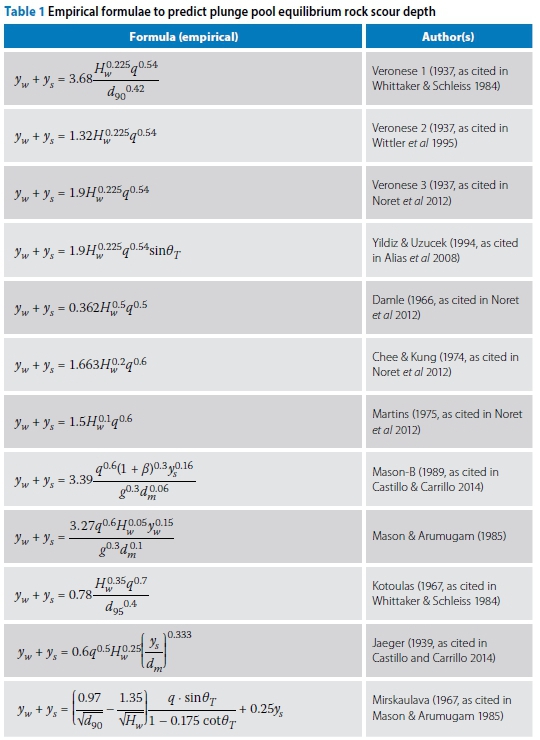
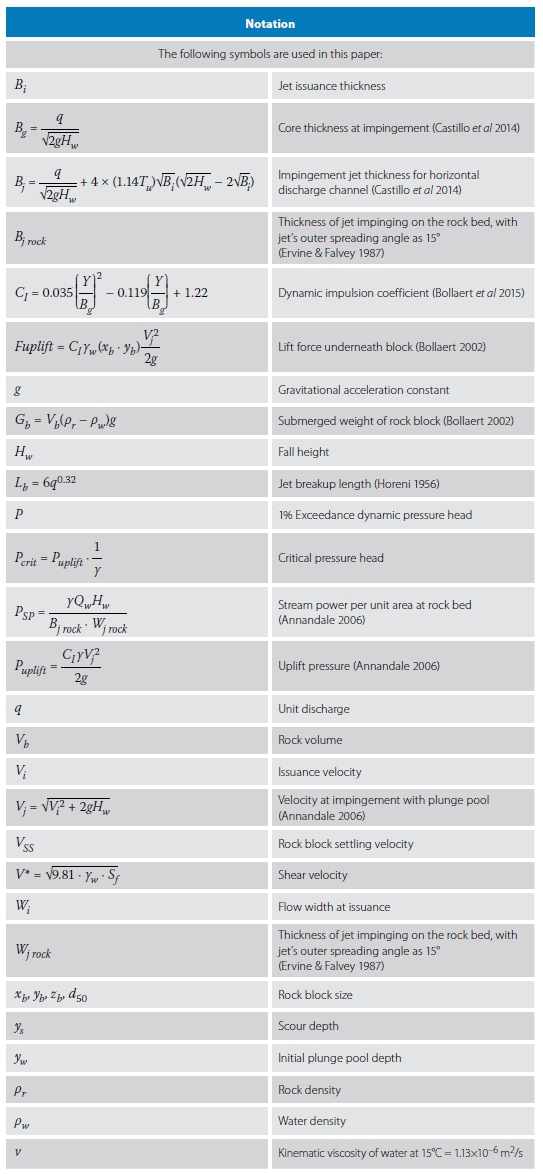
In Table 1 ywis the plunge pool depth (m), ysis the scour hole depth (m), Hwis the effective head (m), q is the unit discharge (m3/s/m), d90and d95 the rock diameter representing the 90% and 95% percentile respectively, 6 the impingement angle with plunge pool surface, dmthe median diameter, and ß the air-water relationship (refer to Figure 1).
Van Schalkwyk et al (1994; 1995) proved that the hydraulic erodibility of rock can be characterised by the Kirsten index (Kirsten 1982) through studying rock scour formation of 42 spillways in South Africa and the United States of America. Annandale (2006) improved on the rock scour concepts developed by Van Schalkwyk et al (1994; 1995) to develop a classification method called the Erodibility Index Method (EIM). The method compares the erosive capacity of the water jet, to the erosive resistance of the rock. The erosive capacity of the jet is defined by stream power per unit area and varies with depth in the plunge pool calculated with Equation 1.
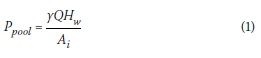
where Aiis the jet footprint (impact area of the jet) at different elevations below the plunge pool water surface (m2), yQH is the stream power that stays the same at impact with the plunge pool free surface, y is the unit weight of water (N/m3), Q is the total discharge (m3/s), Hwis the fall height (m), and Ppool is the stream power per unit area in the pool at a certain depth (W/m2).
The ability of the rock to resist scouring is defined by the erodibility index K (see Equation 2), which takes several geological rock characteristics into account, such as the mass strength of the rock, block size and shape, the interparticle friction, and the joint orientation relative to the flow direction (Annandale 2006).
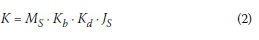
in which K is the erodibility index, Msis the mass strength number, Kbthe block size number, Kdthe discontinuity bond shear strength number, and Jsthe relative ground structure number. Table 2 encapsulates the formulae for the erodibility index parameters.
The scour threshold for the rock strength in terms of stream power per unit area (kW/m2) is based on the erodibility index K (Annandale 2006):
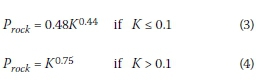
According to the EIM, the maximum scour depth is reached when the available stream power is equal to the resistive capacity of the rock(Ppool < Prock).
The EIM does, however, have some limitations, as the method only determines the depth at the centreline of the jet and cannot determine the extent of the scour hole. The EIM provides a generalised evaluation for rock scour, as it does not explicitly consider the mechanisms of block removal, brittle fracture, or fatigue failure. Although the geometric influence of rock joint orientation is considered, it is handled in a two-dimensional context, and therefore does not capture the essence of block removal in three-dimensional fractured rock masses (Kieffer & Goodman 2012). Pells (2016) argued that, to determine the extent of the scour of unlined dam spillways in rock, a gradation indicating erosion regions should rather be used than a threshold line. The erosion regions presented by Pells (2016) compared well with the independent data set presented by Van Schalkwyk et al (1995).
Bollaert (2002) also investigated rock scour due to falling jets. For this investigation, near-prototype laboratory experiments were carried out to reproduce the dynamic pressure fluctuations at the plunge pool bottom and inside the rock joints. Bollaert (2002) developed the Comprehensive Scour Model (CSM) to predict the equilibrium scour depth for both open-ended and closed joints. The CSM consists of three methods describing the failure of rock, namely Comprehensive Fracture Mechanics (CFM), Dynamic Impulsion method (DI), and Quasi-Steady Impulsion method (QSI). The CFM method assesses the instantaneous or time-dependent joint propagation due to joint water pressures (fatigue failure and brittle fracturing) of closed-ended joints.
The DI method analyses sudden rock block ejection due to uplift pressures on individual rock blocks from the completely jointed rock bed. The net impulse or maximum dynamic impulsion underneath a rock block can be obtained by time integration of the net forces on the block (Bollaert et al 2015):
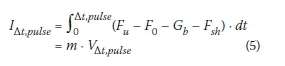
in which Fuand F0 are the forces under and over the block (N) respectively, Gbis the immersed weight of the block (N), Fsh represents the shear and interlocking forces on the block (N), m is the mass of the block (kg), VΔAt,pulse is the average velocity experienced by the rock block during time period At (m/s), At,pulse is the time interval of certain pressure pulse(s) and IΔAt,pulse the impulse on the rock block (Ns).
The first step in the DI method is to define the maximum net impulsion (Imax) as the product of a net force and a time period. The corresponding pressure is made non-dimensional by the jet's kinetic energy  . This results in a net uplift pressure coefficient, Cup. The time period is non-dimensionalised by the travel period that is characteristic for pressure waves inside rock joints, i.e. Tup=
  , with L the joint length (L = xb+ 2zb), with xbthe width of the rock block and zbthe height of the rock block, and the mean pressure wave celerity c taken as 100 m/s. Hence, the non-dimensional impulsion coefficient CIis defined by the product Cup - Tup=
  [m • s]. The maximum net impulsion (Imax) is obtained by multiplication of C1by
  Prototype-scaled analysis of uplift pressures resulted in the following expression for CI (Bollaert et al 2015):
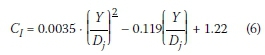
with Y the total plunge pool depth (yw+ ys) as defined in Figure 1, and Djthe jet diameter at impact with the plunge pool free surface.
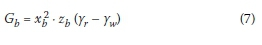
The immersed weight of the rock block is defined by Equation 7.
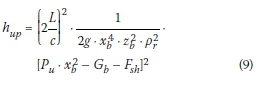
Failure of a block is expressed by the displacement it undergoes due to the net impulsion. This is obtained by transformation of VΔAt,pulse in Equation 5 into a net uplift displacement, hupdefined by Equation 8. As the block is ejected out of the rock bed, the kinetic energy (velocity) applied to the block is transformed into potential energy.
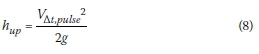
in which hupis the height the rock block is lifted (m).
If the height that the block is lifted (hup) during the time period (Δt) is high enough, the particle or rock block would be ejected out of the matrix and become mobilised. Tightly jointed rock, for example, would require a vertical displacement close to its height (hup/zb> 1) while rock which is not as tightly jointed, would require a lower valueofhup/zb.
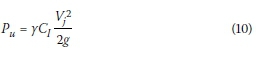
The critical pressure for scour initiation of a rock bed subjected to an impinging jet could be used in a similar manner as the DI method to determine when a rock block would become dislodged from the bed. This scour prediction method is called the Critical Pressure Method in this current study. A stable equilibrium scour hole is achieved when the condition Pactual <pcriticalis satisfied. The height ablock should be lifted, generally hup/zb > 1, for the particle to be displaced out of the bed matrix and become mobilised is quantified as follows (Annandale 2006):
with the critical net uplift pressure (Pu) underneath a rock block with open-ended joints being calculated with Equation 10 (Bollaert 2002):
The QSI method (Bollaert 2012 calculates the peeling of protruding rock blocks along thin layers in the wall jet region parallel to the plunge pool floor as illustrated in Figure 2. The QSI method is dependent on the quasi-steady high-velocity wall jets parallel to the pool floor and the subsequent quasi-steady uplift forces on rock blocks, which are caused by the protrusions of the rock blocks. The rock blocks are said to be plucked or peeled out of the bed matrix due to the wall jet, when the quasi-steady uplift force (Equation 11) can overcome the immersed weight (Equations 7) of the protruding rock block.
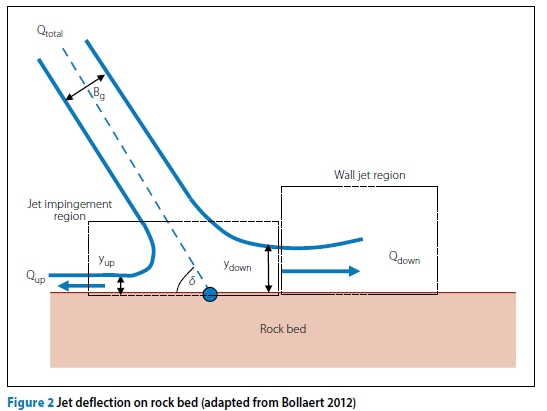
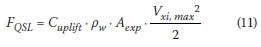
In Equation 11 Cupliftis the net uplift pressure coefficient, pwis the density of water, Aexpis the exposure area of a rock block, and Vximax(Equation 14) is the wall jet velocity x-distance from the impingement point.
The deflection of the jet at the pool bottom occurs in both the up and downstream directions. The importance of each of these deflections directly depends on the jet impingement angle (8) of the jet upon impact with the rock bed, as set out in Table 3.
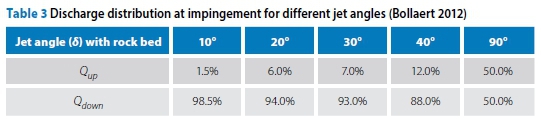
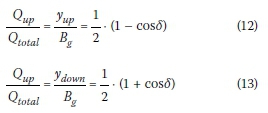
The wall jet thicknesses yupand ydown are determined with Equations 12 and 13 respectively, with initial discharge QtotaLand jet thickness Bgimpinging on a flatbed (Bollaert 2012).
Once the jet deflects, the wall jets may be characterised by their initial flow velocity Vzbottom(Equation 15) and their initial thickness yupor ydownat the point of deflection. Initiating from this impingement location, the wall jets develop radially outwards following self-preserving velocity profiles as given by Equation 14 (Beltaos & Rajaratnam 1973 as cited in Bollaert et al 2015). V xi, max expresses the decay of the maximum cross-sectional jet velocity with the relative distance from the start of the wall jet (lateral distance X divided by the initial thickness of the deflected jet yupor ydown):
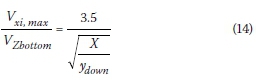
The initial flow velocity at impingement Vzbottom(Equation 15) depends on the diffusion angle (a in Figure 1) of the impinging jet and on its development length through the plunge poo1 (yw + ys). Vzbottomcontinuously changes during scour formation (Bollaert et al 2015). The velocity decay through the plunge pool would increase for a greater jet diffusion angle (a)
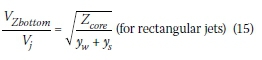
with Zcorethe distance required for the jet core to diffuse in the plunge pool depth (m), which is generally taken as four times the jet thickness (m) at impact (Bg).
EXPERIMENTAL WORK
Model scale
Bollaert and Schleiss (2005) determined that the pressures inside the rock joints are accurately reproduced for a physical model scale of approximately 1:10. Boushaba et al (2013) found that the scale effects on the plunging jet velocity, initial turbulence, plunge pool aeration and the dynamic pressures at the bedrock surface are negligible for a physical model scale not exceeding 1:20. Model scales greater than 1:100 could cause incorrect aeration results. Therefore, a model scale not exceeding 1:20 is recommended for the experimental results from this study. Additionally, with the available laboratory height, a 1:20 model scale is able to replicate realistic prototype spillway heights (i.e. 60 m up to 100 m).
Model layout
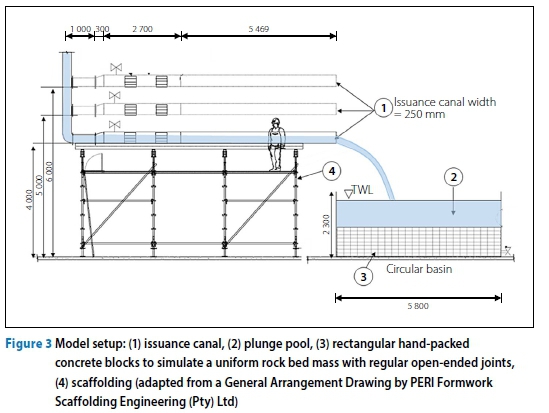
The experimental investigation was conducted in the hydraulics laboratory of the Civil Engineering Department at Stellenbosch University, South Africa. The three-dimensional physical model (based on Froude scale laws) consisted of a rectangular horizontal issuance canal, replicating an uncontrolled spillway. Flow straighteners were installed in the issuance canal to ensure that uniform, fully developed flow would be reached. The issuance canal could be adjusted to three different fixed heights above the movable rock bed: 3 m, 4 m and 5 m (prototype heights for 1:20 model scale: 60 m, 80 m and 100 m respectively). The tailwater depth at the plunge pool was also adjustable, namely 0.5 m and 1 m (prototype: 10 m and 20 m respectively). Plunging jets were evaluated for unit discharges of 0.10 m3/s/m to 0.224 m3/s/m (prototype: 35 m3/s/m to 80 m3/s/m). The broken-up rock bed mass was modelled by using tightly hand-packed concrete paver blocks (cobblestones) emulating a uniform three-dimensional open-ended horizontal and vertical rock joint network. The two rock sizes tested were rectangular concrete blocks with x, y, z dimensions of 0.1 m x 0.1 m x 0.05 m and 0.1 m x 0.1 m x 0.075 m (prototype: 2 m x 2 m x 1 m and 2 m x 2m x 1.5 m respectively). A similar prototype rock density of 2 650 kg/m3 should be used in the model since gravity cannot be scaled. The paver block densities used were 2 355.4 kg/m3 and 2 388.1 kg/m3 respectively. The test conditions are summarised in Table 4.
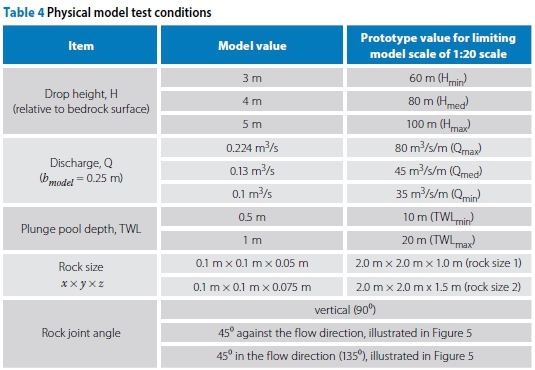
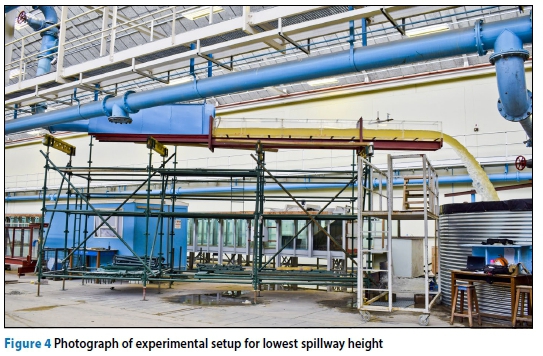
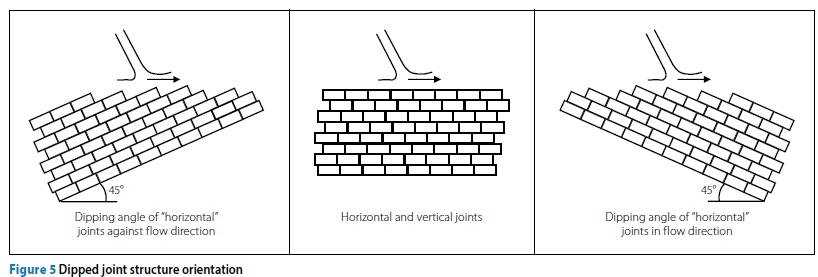
A total of 31 experimental tests were carried out. Ten per cent of the experiments were repeated to ensure repeatability of the results, and showed a maximum deviation of 15%. Figure 3 shows the laboratory model setup (dimensions shown in Figure 3 are model dimensions in mm). Figure 4 shows a photograph of the experimental setup. The three joint structures investigated are illustrated in Figure 5.
During each of the experimental tests, the scouring of rock by the free-falling rectangular jet that exited the spillway was monitored until scouring in the plunge pool stopped and equilibrium conditions were reached (after 6 to 8 hours of testing), called Case A. The bed profile of the equilibrium scour hole was then surveyed. The same test was then repeated, but instead of leaving the scoured blocks from the pool, the deposited rocks downstream of the scour hole were continuously removed until equilibrium conditions were reached again (called Case B) after approximately 16 to 20 hours, where after the so-formed equilibrium bed profile was surveyed again. Figure 6 (p 41) shows the bed deformation process for the horizontal and vertical aligned joint structures. The topography of the bed profile was surveyed using a three-dimensional laser scanner, Z+F Imager 5006h, at a high resolution of 10 000 pixels/360°.
Results of experimental work
Although various flow rates, drop heights, and tailwater levels were tested, only results of selected tests are presented in this paper since all the tests followed similar trends.
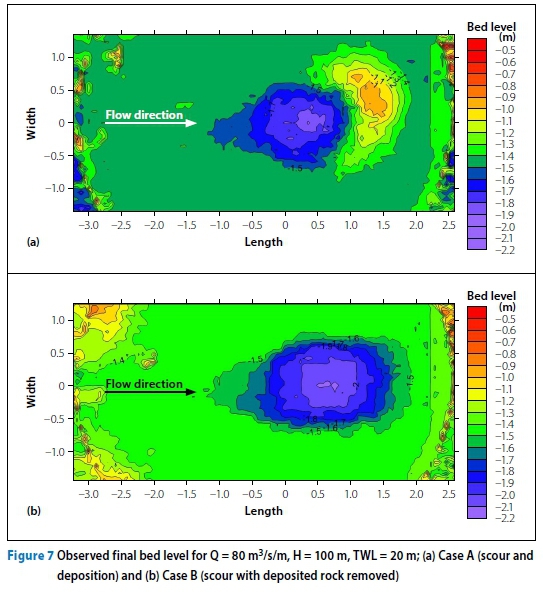
Figure 7 shows the contour maps of the surveyed scour holes of the model for Cases A and B respectively for the maximum discharge, highest drop height, and deepest plunge pool. It can be seen from the contour maps that the scour hole depth, length, width and volume increase when the deposited rocks downstream of the hole are removed, and the horizontal distance from the spillway to the onset of scour decreases.
The longitudinal and lateral bed profiles for the model for the various flow rates, listed in Table 4 (35 m3/s/m, 45 m3/s/m and 80 m3/s/m), for the highest fall height (Hmax= 100 m) and the deepest plunge pool depth (TWLmax= 20 m) are shown in Figure 8 for Case A (scour and deposition) and Case B (scour with deposited rock removed). Figure 8 illustrates that the scour depth, width and length increase as the discharge increases. The scour results for Case B presented in Figure 8 also indicate that greater scour could occur if the deposited rocks downstream of the scour hole are removed by floodwaters. Test 2 in Figure 8 is a repeated test of Test 1.
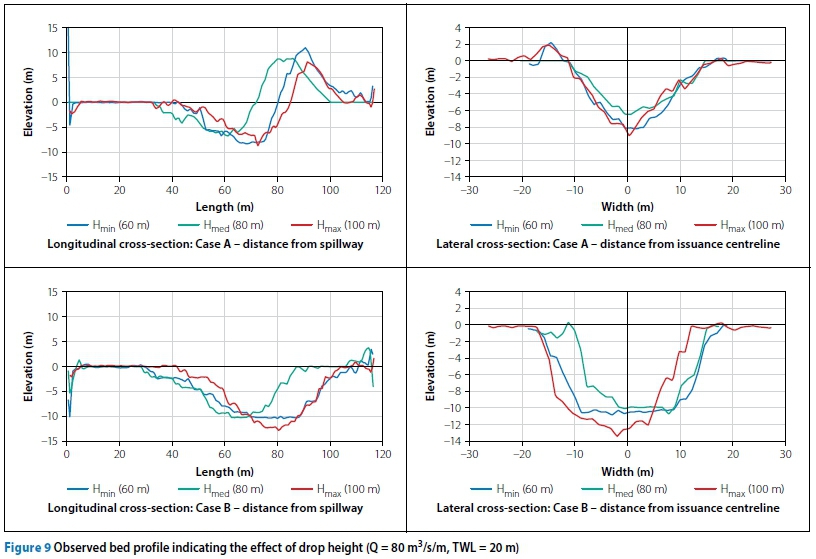
Figure 9 indicates that the scour depth, width and length for the three different drop heights (60 m, 80 m and 100 m) were of similar magnitude. A possible reason for the low sensitivity towards the drop height could be that the jet was already fully developed (the jet core is fully dissipated) at the impingement with the plunge pool water surface for all three drop heights.
Figure 10 shows that the plunge pool acts as a water cushion, since the scouring depth, width and length decrease with an increase in the plunge pool depth, in accordance with Van Aswegen et al (2001) and Bollaert et al (2012).
The bed profiles depicted in Figure 11 indicate that the scour depth, width and length decrease as the rock block size increases. Larger rock blocks provide greater erosive resistance than smaller blocks, due to its submerged weight, in accordance with Annandale (2006).
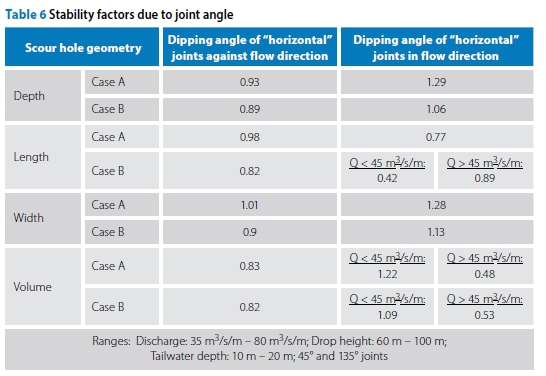
The geologic structure of the rock can significantly influence the erodibility of the rock. The effect of the rock joint angle relative to the flow direction was therefore investigated by means of Figure 12. The three joint angles under investigation were 45° dipped against the direction of the flow, vertical (90° to the horizontal axis) and 45° in the direction of the flow (thus 135°).
Similar to the well-known rock scour case of Ricobayo Dam in Spain (Annandale 2006), the scour results shown in Figure 12 indicate that the rock is more conducive to scour failure when the joint structure is dipped 45° in the direction of the flow. The experimental results (Table 6) indicate that the rock with a joint structure dipped 45° against the flow direction has a greater scour resistance to the erosive capacity of the water.
DEVELOPMENT OF FORMULAE BASED ON EXPERIMENTAL DATA OF THIS STUDY
A multi-linear regression analysis was done on the physical model results to find non-dimensional formulae that define the scour hole geometry (depth, length, width and volume). Three regression models were analysed, namely Linear, Logarithmic Transformed and Linear Logarithmic, represented by Equations 16 to 18 respectively.
where Q0is the dependent variable, the independent variable, x123 and k, a, b, and c are constants.
Several parameters were incorporated in the regression analysis, such as rock diameter, discharge, drop height, plunge pool depth, stream power, and uplift pressure. The main parameters influencing the flow and rock scour were selected based on the extensive literature study conducted and experimental tests.
Instead of incorporating bed shear stress explicitly, the movability number (Equation 19) based on the settling velocity (Vss) and the particle Reynolds number (Equation 20) were used in analysing the rock scour. The movability number and particle Reynolds number Rep(Armitage & Rooseboom 2010) have the benefit that they are based on the shear velocity V* (Equation 21) the particles are experiencing due to the plunging jet, and the particle size.
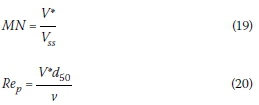
with v the kinematic viscosity of water = 1.13 X 10⁻⁶ m2/s at 15°C, and V*, the shear velocity, is defined as:
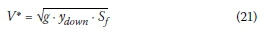
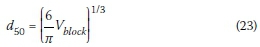
with ydowndenoting the jet thickness downstream of the impingement region as illustrated in Figure 2. The energy slope Sfrequired for determining the shear velocity was determined from Chèzy (Equation 22) by assuming the hydraulic radius R =  (area of jet deflected downstream of impingement/jet width at impingement with the bedrock as illustrated in Figure 2). The surface roughness was approximated as ks= d50median particle size (Equation 23). The settling velocity was elected as the representative of the transportability of large aggregate, since it accounts for size, shape and density of the rock blocks. A settling tank was used in the laboratory to determine that the blocks have a median prototype settling velocity (VSS) of 4.19 m/s and 4.99 m/s for the small and large rock blocks respectively.
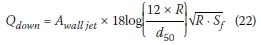
with Qdownthe respective discharge downstream of the impingement region, based on the total flow and jet impinging angle, S (Table 3), R the hydraulic radius, and Sfthe energy slope. The wall jet flow area is defined as Awall jet= ydownX Wj rockwith Wj rockbeingthe width of the jet at impingement with the rock bed, taking the jet outer spreading angle as 15° (Ervine & Falvey 1987) for highly turbulent jets. The median particle size (d50) is defined by Equation 23 (Pabst & Gregorova 2007) with Vblock the rock block volume (m3):
The parameters describing the scour hole geometry were calculated using ordinary least squares regressions, with due consideration given to the parsimony principle. Due to the availability of many possible regressors, parsimony is emphasised to ensure avoiding over-fitting. The parameters were made dimensionless by applying the Buckingham theorem (Albrecht et al 2013).
The Logarithmic model provided the best fit for the scour hole dimensions (scour depth, length, width and volume), except the scour hole depth for Case B was predicted best by the Linear Log model.
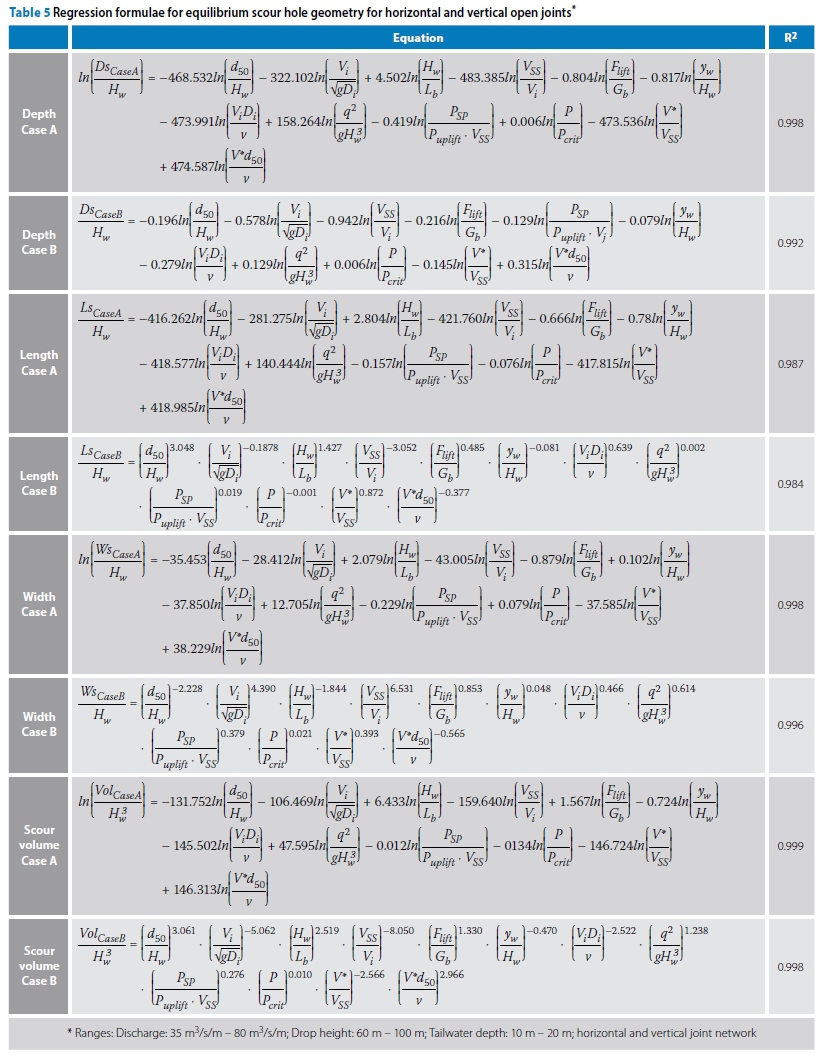
Table 5 summarises the non-dimensional formulae for vertical rock joints obtained from the regression analysis. To apply these regression formulae, the equilibrium scour depth should first be determined by a trial-and-error procedure using the scour formula in Table 5, initially for a jet impinging onto the original flat bed. Iteration ceases when a reasonable percentage difference is found. Thereafter the scour parameters (i.e. movability number and dynamic pressure head) at the equilibrium scour depth can be used in order to obtain the other scour hole geometries (length, width and volume) by using the formulae presented in Table 5. The regression formulae should be applied inside the prototype ranges in which the formulae were developed (discharge: 35 m3/s/m -80 m3/s/m; drop height: 60 m - 100 m; tailwater depth: 10 m - 20 m; horizontal and vertical joint network).
The stabilising (or destabilising) factors for joint structures orientated 45° in and against the direction of the flow are summarised in Table 6. The joint structure angle factors should be applied to the predicted scour geometry results obtained for the horizontal and vertical joint formulae in Table 5. The variations in the stabilising factors are small. However, additional experimental testing is required to ascertain whether linear interpolation is possible between the stabilising factors for different degrees of joint structures between 0° and 45° in and against the flow direction.
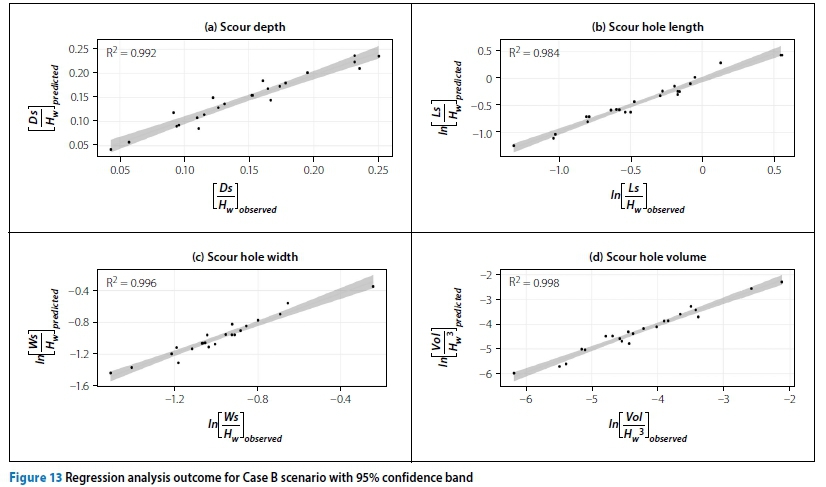
The regression analysis results for the scour hole parameters (depth, length, width and volume) for the Case B scenario (deposited rocks removed) shown in Figure 13 with the 95% confidence band indicates the correlation between the formulae predicted and the confirmation test results. The regression analysis results indicate that a good correlation was achieved between the predicted and observed values. The regression formulae were confirmed inside the ranges in which the developed formulae were based by using experimental tests that did not form part of the regression analysis but with parameter values inside the ranges of the tests. The developed formulae have a good agreement with the observed confirmation values with the following percentage errors (i.e. percentage differences between test values and those predicted by the developed formulae) - for the scour depth 14.3%, for the scour length 22.5%, for the scour width 8.6%, and for the scour volume 14.4%.
COMPARISON OF PHYSICAL MODEL RESULTS WITH SCOUR PREDICTION METHODS FROM LITERATURE
Eleven empirical formulae (Table 1), and the EIM and CSM traditionally employed to predict rock scour due to plunging jets were evaluated against the results from the physical model study for a full-scale prototype.
Only the DI and QSI methods of the CSM, and not the CFM method, were compared with the physical model test results, since the CFM method analyses fatigue failure and brittle fracturing of closed-ended joints and the model's rock mass comprised a fully formed joint network.
The prototype scour hole depth formed in a movable bed based on the physical model study is compared in Figure 14 to the scour prediction methods found in literature for the 45 m3/s/m flood, a drop height of 80 m and a plunge pool depth of 20 m.
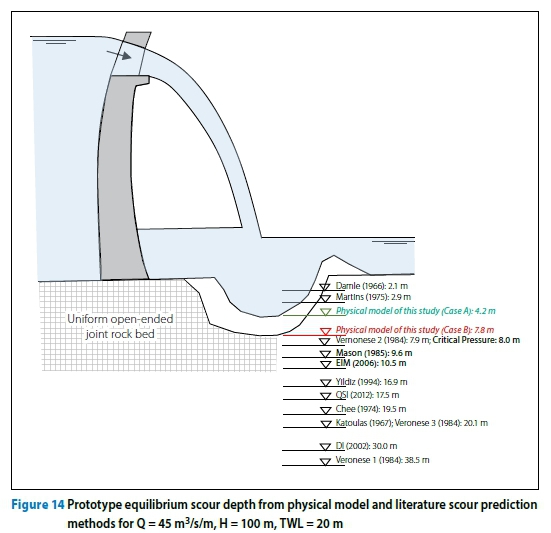
The scour depth prediction methods from literature were found to yield a wide range of varying results for the same input conditions as shown in Figure 14. Figure 15 is a correlation plot of scour depths observed in the experimental tests versus the scour depths predicted by 15 selected formulae from literature by applying prototype Case B physical model test conditions as input in the respective formulae and methods. Figure 16 presents the statistical spread of the data in Figure 15. The percentage difference between the observed prototype depth from the experimental tests and the depths obtained from the respective literature methods is given
The percentage difference results shown in Figure 16 indicate that the methods are in weak agreement with one another and generally overestimate the observed scour depths with a mean difference of 99% (over-predict) for the Case B scenario. The analytical method that agrees best with the experimental results is the Critical Pressure method (Annandale 2006), since the median percentage difference is close to zero (-25.2%). However, the safest scour prediction method (accurate and conservative) would be the EIM (Annandale 2006), followed by Mason and Arumugam's (1985) empirical formula, since the first quartile (25th percentile) nears the zero percentage difference (-12% and 15% respectively) with a narrow statistical spread.
The Critical Pressure method (Annandale 2006) proves to agree the closest with the laboratory data, presumably because it relies on the critical pressure for scour initiation of a rock bed subjected to an impinging jet. The critical pressure is dependent on the submerged weight of the rock block, block dimensions, uplift pressures inside the joints, diffusion of the jet through the air and plunge pool, as well as the velocity of the jet and drop height.
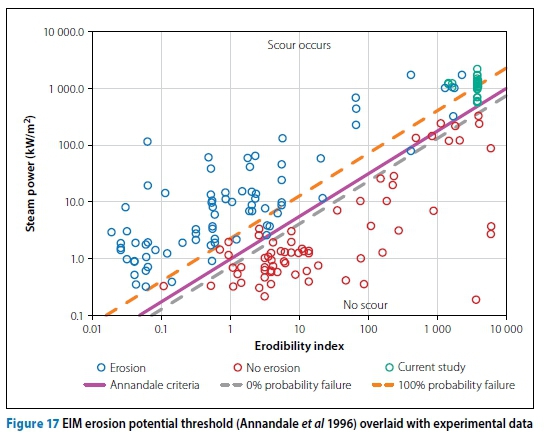
The EIM presumably performed well because it relies on rock material properties and the stream power of the jet as it travels through the air and plunge pool. Figure 17 indicates that the EIM erosion threshold is compatible with the laboratory experimental data for the Case B scenario when the scoured blocks were continually removed, since the data plots above the threshold line in the "scour" region (green markers).
Mason and Arumugam (1985) proved to be the only identified empirical formula that incorporates the plunge pool depth with gravity acceleration. The implication of this is that models taking the plunge pool depth, and consequently the dissipation of the jet's energy through the plunge pool, into consideration could offer better scour depth predictions. The experimental test results reiterate the experimental finding that the scour depth greatly depends on the plunge pool depth. The Jaeger equation (1939, as cited in Castillo & Carrillo 2014) also incorporated the plunge pool depth and had a median percentage difference close to zero (25%); however, it had a wide percentage difference statistical spread.
Yildiz and Uzucek (1994, as cited in Alias et al 2008) and Mirskaulava (1967, as cited in Mason & Arumugam 1985) rely on the impingement angle of the jet with the plunge pool surface. Both equations have a narrow statistical spread; however, the Yildiz and Uzucek equation overestimates the scour depth, whereas the Mirskaulava equation underestimates the scour depth. Also, the median percentage difference calculated using the Mirskaulava equation (-78.6%) is closer to zero compared to the Yildiz and Uzucek equation (126.1%). A possible reason is that the Mirskaulava equation also incorporates the plunge pool depth and 90% percentile rock dimension, whereas the Yildiz and Uzucek equation does not.
The remainder of the empirical formulae are based on the drop height and unit discharge with varying coefficients. A wide range in scour depths, both under- and overpredicted, were calculated, indicating that the scour depth does not rely solely on the discharge and drop height, and that the scour depth is sensitive to the parameter coefficients. Furthermore, these equations do not incorporate the rock block size, thus the same scour depth would be predicted if the discharge and drop height are kept constant for various particle size scenarios. These empirical formulae are therefore considered less applicable for full-scale prototype cases.
The DI and QSI methods (Bollaert 2012) demonstrated the most significant spread of differences between all the methods. The DI method takes the uplift pulsating forces integrated over a pulse period into account, whereas the QSI method is the only identified scour prediction model that takes wall jets into consideration. Both methods overestimated the scour depth, presumably due to the challenges posed by physical model scales, and that both methods were developed for vertical falling jets.
The developed regression formula to predict the scour depth agreed well with the experimental results. There is a compact statistical range of differences with a median difference percentage close to zero (0.8%), with the first quartile just below zero (-2%: overprediction) compared to the literature scour prediction methods as seen in Figure 16.
The sum of squared residuals (SSR), as defined by Equation 24, was compared against the various scour prediction methods in Figure 18 for the Case B scenario (scour with deposited rocks removed).
The developed regression formula to determine the scour hole depth ranked the highest with the least total SSR 26;13 (underpredicted; overpredicted), followed by Martins (1975) and Damle (1966). However, Martins' and Damle's empirical formulae have a high number of underpredictions. The EIM and Critical Pressure methods (Annandale 2006) ranked seventh and eighth respectively in the least total SSR.
CONCLUSIONS
This paper presents the results of equilibrium plunge pool scour hole geometry obtained from a physical model study. A model scale not exceeding 1:20 is recommended for the experimental results from this study in order to limit scale effects. The physical model was used to simulate and test the following conditions:
■ Rectangular plunging jets issuing horizontally.
■ Jet issuance levels of 3 m, 4 m, and 5 m (prototype: 60 m, 80 m and 100 m) above the rock bed level.
■ Plunge pool tailwater depths of 0.5 m and 1.0 m (prototype: 10 m and 20 m).
■ Unit discharges of 0.1 m3/s/m to 0.224 m3/s/m (prototype: 35 m3/s/m to 80 m3/s/m).
■ Two rock sizes of 0.1 m X 0.1 m X 0.075 m and 0.1 m X 0.1 m X 0.05 m (prototype: 2.0 m X 2.0 m X 1.5 m and 2.0 m X 2.0 m X 1.0 m).
■ Rock joint angles of 45°, 90° and 135° with the horizontal axis.
Results from the physical model were used to develop non-dimensional multi-linear regression formulae to predict the scour hole geometry (depth, length, width and volume). The proposed regression formulae were confirmed to be inside the ranges in which the formulae were developed by using experimental test data that did not form part of the regression analysis. These proposed regression formulae agree reasonably well with the experimental data on which they are based.
The scour depth results from the physical model were compared to various analytical methods found in literature. It was found that, regarding the more frequently used formulae from literature, the Critical Pressure method agrees the closest with the experimental data and regression formulae developed in this study, whereas the EIM method (Annandale 2006) followed by Mason and Arumugam's (1985) empirical formula were more conservative than the formulae developed in this study.
ACKNOWLEDGEMENTS
The assistance toward this research of PERI Formwork Scaffolding, Continental Cobbles, Kaytech Engineered Fabrics, and Horts Geo-Solutions, as well as Mr NF Katzke and Mr DE Bosman, is acknowledged with gratitude. The opinions expressed, and conclusions arrived at, are those of the authors.
REFERENCES
Albrecht, M, Nachtsheim, C, Albrecht, T & Cook, R 2013. Experimental design for engineering dimensional analysis. Technometrics, 55(3): 257-270. DOI: 10.1080/00401706.2012.746207. [ Links ]
Alias, N, Mohamed, T, Ghazali, A & Mohd, M 2008. Impact of takeoff angle of bucket type energy dissipater on scour hole. American Journal of Applied Sciences, 5(2): 117-121. [ Links ]
Annandale, G, Smith, S, Nairns, R & Jones, J 1996. Scour Power. Civil Engineering, 66(7): 58-60. [ Links ]
Annandale, G W 2006. Scour Technology: Mechanics and Engineering Practice. New York: McGraw-Hill. [ Links ]
Armitage, N & Rooseboom, A 2010. The link between Movability Number and Incipient Motion in river sediments. Water SA, 36(1): 89-96. [ Links ]
Bollaert, E 2002. Transient water pressures in joints and formation of rock scour due to high-velocity jet impact. PhD Thesis, Lausanne, Switzerland: Ecole Polytechnique Fédérale de Lausanne. [ Links ]
Bollaert, E 2012. Wall jet rock scour in plunge pools: A quasi-3D prediction model. Hydropower and Dams, XX: 1-9. [ Links ]
Bollaert, E & Lesleighter, E 2014. Spillway rock scour experience and analysis - The Australian scene over the past four decades. Proceedings, 5th International Symposium on Hydraulic Structures, Brisbane, Australia. [ Links ]
Bollaert, E & Schleiss, A2005. Physically based model for evaluation of rock scour due to high-velocity jet impact. Journal of Hydraulic Engineering, 131(3): 153-165. DOI: 10.1061/(ASCE)0733-9429(2005)131:3(153). [ Links ]
Bollaert, E, Munodawafa, M & Mazvidza, D 2012. Kariba Dam plunge pool scour: Quasi-3D numerical predictions. Proceedings, ICSE 6-265, Paris, pp 627-634. [ Links ]
Bollaert, E, Stratford, C & Lesleighter, E 2015. Numerical Modelling of Rock Scour: Case Study of Wivenhoe Dam (Australia). London: Taylor & Francis. [ Links ]
Boushaba, F, Manso, P, Schleiss, A, Yachouti, A & Daoudi, S 2013. Numerical and experimental high-Reynolds jet diffusion and impact pressures in flat and laterally confined aerated pools. International Journal of Hydraulic Engineering, 2(6): 133-141. DOI: 10.5923/j.ijhe.20130206.02. [ Links ]
Castillo, L & Carrillo, J 2014. Scour analysis downstream of Paute-Cardenillo Dam. Proceedings, 3rd IAHR Europe Congress, Porto, Portugal, pp 1-10. [ Links ]
Castillo, L, Carillo, J & Blàzquez, A 2014. Plunge pool dynamic pressures: A temporal analysis in the nappe flow case. Journal of Hydraulic Research, 53(1): 101-118. DOI: 10.1080/00221686.2014.968226. [ Links ]
Ervine, D & Falvey, H 1987. Behaviour of turbulent water jets in the atmosphere and in plunge pools. Proceedings of the Institution of Civil Engineers, Part 2, 83(1): 295-314. [ Links ]
Horeni, P 1956. Disintegration of a free jet of water in air. Byzkumny ustav vodohospodarsky prace a studie, Sesit 93. [ Links ]
Kieffer, D & Goodman, R 2012. Assessing scour potential of unlined rock spillways with the Block Scour Spectrum. Geomechanics and Tunnelling, 5: 527-536. [ Links ]
Kirsten, H 1982. Classification system for excavation in natural materials. The Civil Engineer in South Africa, 24: 293-308. [ Links ]
Manso, P, Bollaert, E & Schleiss, A 2008. Evaluation of high-velocity plunging jet-issuing characteristics as a basis for plunge pool analysis. Journal of Hydraulic Research, 46(2): 147-157. [ Links ]
Mason, P & Arumugam, K 1985. Free jet scour below dams and flip buckets. Journal of Hydraulic Engineering, 111(2): 220-235. [ Links ]
Noret, C, Girird, J, Munodawafa, M & Mazvidza, D 2012. Kariba Dam on Zambezi River: Stabilizing the natural plunge pool. Proceedings, ICSE 6-265, Paris. [ Links ]
Pabst, W & Gregorova, E 2007. Characterization of particles and particle systems. Proceedings, ICT, Prague, p 122. [ Links ]
Pells, S 2016. Erosion of rock in spill-ways. PhD Thesis. Kensington, Australia: University of New South Wales. [ Links ]
Stratford, C, Bollaert, E & Lesleighter, E 2013. Plunge pool rock scour analysis techniques: Wivenhoe Dam spillway, Australia. Proceedings, Hydro 2013 Conference, Innsbruck, Austria. [ Links ]
Van Aswegen, W J, Dunkley, E, Blake, K R K 2001. Plunge pool scour reproduction in physical hydraulic models. Stellenbosch: Water Research Commission. [ Links ]
Van Schalkwyk, A, Dooge, N & Pitsiou, S 1995. Rock mass characteristics for evaluation of erodability. Proceedings, 11th European Conference on Soil Mechanics and Foundation Engineering, Volume 3, Copenhagen, Denmark. [ Links ]
Van Schalkwyk, A, Jordaan, J & Dooge, N 1994. Die erodeerbaarheid van verskillende rotsformasies onder variërende vloeitoestande. Report WRC 302/1/95. Pretoria: Water Research Commission. [ Links ]
Whittaker, J & Schleiss, A 1984. Scour related to energy dissipators for high head structures. Zürich: Eidgenössischen Technischen Hochschule. [ Links ]
Wittler, R, Mefford, B, Abt, S, Ruff, J & Annandale, G 1995. Spillway and dam foundation erosion: Predicting progressive erosion extents. Proceedings, International Conference on Water Resources Engineering, San Antionio, TX, pp 1-5. [ Links ]
 Correspondence:
Adèle Bosman
Civil Engineering Department, Water Division, Stellenbosch University
Private Bag X1 Matieland 7602
T: +27 21 808 4356 E: abosman2@sun.ac.za
Gerrit Basson
Civil Engineering Department, Water Division, Stellenbosch University
Private Bag X1 Matieland 7602
T: +27 21 808 4355 E: grbasson@sun.ac.za

ADÈLE BOSMAN PrEng is a lecturer in Hydraulics at the University of Stellenbosch, South Africa. She is currently studying towards her PhD (Civil) degree in developing a numerical model for predicting rock scour. She has more than 11 years' experience mainly in river hydraulics and the design of large hydraulic structures.

PROF GERRIT BASSON PrEng MSAICE is a professor in Hydraulic Engineering in the Civil Engineering Department at Stellenbosch University. He obtained a PhD from Stellenbosch University in 1996 and has more than 30 years' experience mainly in the fields of river hydraulics, fluvial morphology and the design of large hydraulic structures. He has worked on projects in 21 countries and is an Honorary Vice-President of ICOLD (International Commission on Large Dams).

