


Services on Demand
Article
 English (pdf)
 Article in xml format
 Article references
Indicators

Related links
-
 Cited by Google
 -
 Similars in Google
Share

 Permalink
Journal of the South African Institution of Civil Engineering
On-line version ISSN 2309-8775
Print version ISSN 1021-2019
J. S. Afr. Inst. Civ. Eng. vol.62 n.3 Midrand Sep. 2020
http://dx.doi.org/10.17159/2309-8775/2020/v62n3a3
TECHNICAL PAPER
Quantifying the economic benefits of gauge changes on the South African core railway network
C P Demmerez de Charmoy; P J Grabe
ABSTRACT
In its white paper, the Department of Transport (2017) envisages a future South African core railway network which requires the conversion and construction of over 8 500 km of standard-gauge railway track by 2050. The scale of the project would undeniably have a large cost attached to it, which needs to be well understood before any of the construction takes place. Numerous studies regarding railway gauge have been conducted within South Africa, but no single paper has addressed the issue of which specific railway corridors could economically benefit from a standard-gauge intervention.
The purpose of this study was to identify which corridors in the South African core network could potentially benefit from a gauge change intervention. These identified corridors were then economically evaluated to determine which of the corridors would outperform the base case, which was set as the Market Demand Strategy (MDS) plan. Finally, it was determined if any of the corridors identified outperformed the base case, to simulate how the operations of the corridor would be affected.
The conclusions of the study indicated that all the corridors in the South African core network should follow the plans proposed in the MDS to achieve the maximum return for the analysis period, except for the Natal corridor. It was identified that the Natal corridor would benefit most from a standard-gauge single line which would run concurrently with the narrow-gauge system transporting containers and other general freight along the corridor.
Keywords: railway gauge, economic analysis, agent-based simulation
INTRODUCTION
South Africa's rail network has been unable to take advantage of rail's inherent benefits because of the early South African government's decision to construct the rail network in narrow gauge. Rail's success is built upon its three genetic technologies, namely bearing, guiding and coupling (Van der Meulen 2010). According to the Department of Transport (DoT) (2017), South Africa can operate long heavy-haul trains; however, South Africa is unable to take advantage of speed and axle load in the same way that standard-gauge systems are able to. Numerous studies regarding railway gauge have been conducted within South Africa, but no single paper has addressed the issue of which specific railway corridors could benefit from standard-gauge interventions.
The objectives of the study are summarised as follows:
■ To establish which corridors could potentially benefit from a standard-gauge intervention.
■ To identify what type of standard-gauge intervention would be most economically beneficial on the identified corridors, such as adding a third rail, constructing a standard-gauge line parallel to the narrow-gauge corridor or completely changing the line from narrow- to standard-gauge.
■ For the intervention identified, to understand how this will influence the operations on the corridor through the analysis of the intervention by means of simulation.
BACKGROUND
Rail gauge has been a contentious issue within South Africa for a long time and has led to the release of many government statements and papers regarding the issue. The NATMAP 2050 report was compiled by The DoT in 2009 and evaluated the issue of gauge in a global context and locally within South Africa. Since the NATMAP 2050's release, the DoT (2017) released the National Rail Policy (NRP) White Paper which seeks to reposition rail and would require the conversion of many corridors to standard-gauge.
South Africa's core railway network and key corridors
The South African core network comprises 60% of the entire network, while the remainder of the lines are classified as "branch lines" (Transnet 2016). The inter-modal freight lines are rated for 20 tonnes per axle loading, while the iron ore line operates on 30 tonne axle loading and the coal line on 26 tonne axle loading.
Perway condition and railway line utilisation
Perway is referred to as a section of track with its numerous components (McNaught 2015). Transnet in more recent years have placed a larger focus on maintaining assets rather than constructing new railway lines. However, the core railway network is either in an average or poor condition (Transnet 2016).
Key corridors in South Africa
Transnet (2016) indicates that the South African core network consists of 18 sections that can be categorised into the following four systems:
■ Iron ore and manganese system
■ Coal system
■ North-eastern system
■ Intermodal and general freight system.
The coal export and iron ore export lines generate 60% of Transnet's revenue and together move more than 150 mtpa (Transnet 2018). The general freight and intermodal railway corridors struggle to compete with the road freight transport sector which holds an 87.5% market share (Department of Environmental Affairs 2015).
Transnet's Market Demand Strategy (MDS)
The MDS was compiled by Transnet in 2012 to curb the loss of the freight transportation market share to road. The MDS seeks to spend more than R330 billion over the next 30 years and plans to transport 350 million tonnes of freight in the year 2020 (Transnet 2012). Barradas (2014 Engineering News) states that the MDS intends creating a modal shift from road to rail.
DoT's National Rail Policy (NRP) White Paper
The NRP was compiled by the DoT and made public in 2017. Figure 1 displays an essential South African core railway network presented by Van der Meulen (2010) which is similar to the one presented by the DoT in 2017. The line consists of the following:
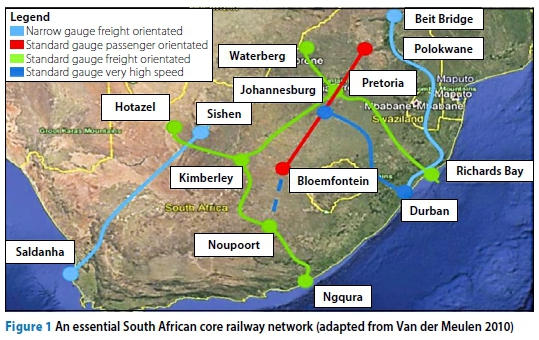
■ 744 km of high-speed standard-gauge rail (in excess of 250 km/h)
■ 2 691 km of freight-orientated standard-gauge
■ 900 km of passenger-orientated standard-gauge.
Bridge, tunnel and track structure costs
Railway construction often incorporates bridges and tunnels to avoid steep gradients; however, a premium is added onto the normal track construction costs.
Rostami et al (2013) indicate that the cost to tunnel is driven by the uncertainty of the material being tunnelled through, as well as the bore diameter and type of tunnel being constructed. Hadi et al (2016) indicate that the price to construct a bridge approximately doubles the cost per kilometre of track constructed, depending on the location's topography.
The DoT (2009) and Lombard (2017) indicate that the cost to construct a standard-gauge railway line from new is in the range of 7% more expensive than constructing a narrow-gauge railway line. Transnet (2016) published the values of various projects planned in the Long-Term Planning Framework (LTPF) which reveals the expected rates per kilometre of narrow-gauge railway. Lombard (2017) compared the costs of constructing a coal line as either a narrow- or standard-gauge line in Mozambique.
Rolling stock costs
Railway rolling stock prices vary depending on the intended function of the rolling stock. The Railway Gazette (2018) revealed that wagon prices vary depending on their purpose and are similar in price regardless of the gauge that they run on. The Railway Gazette (2018) and Lombard (2017) both indicate that standard-gauge locomotives can cost around 50% of the price of a narrow-gauge diesel or electric locomotive.
Railway operating costs
Harris (1977) developed a relationship between operational cost and the density of a railway line, which displayed that the greater the density the lower the operating costs incurred due to economies of scale.
Havenga et al (2012) used the relationship postulated by Harris (1977) to establish the operating costs of rail operations in order to identify the cost differences between road and rail transport. Havenga et al (2012) were also able to establish the externality costs associated with road and rail transport modes to carry freight.
Railway revenue calculation
Revenue is generated through the transportation of freight along a railway line for clients. Transnet (2018) indicates that the coal line and the iron ore lines generate R0.279 per tonne-kilometre and R0.122 per tonne-kilometre respectively. The outcomes of Transnet's 2017 and 2018 financial reports indicate that the average rate per tonne is between R174.95 and R186.75, which varies depending on the type of commodity and the distance required for it to be transported.
Infrastructure economic evaluation techniques
Three commonly used project evaluation techniques include the present worth method, the internal rate of return (IRR) method and the benefit/cost ratio (Remer & Nieto 1995). The present worth method is described as a net present value technique and is limited by the fact that it assumes that each year the investment is reinvested at the same rate, which is not always true when growth is related to gross domestic product (GDP) (Blank & Tarquin 1989).
The IRR method is a rate-of-return technique and is used to calculate the interest rate for which the present worth of a project will equal zero. The term internal indicates that it only considers internal factors (Park & Sharp-Bette 1990).
The benefit/cost ratio is a ratio technique and works well as long as the benefits can be converted to monetary values. A project is viewed negatively if the costs outweigh the benefits and vice versa (Remer & Nieto 1995).
Simulation of railway corridors
Simulation is the imitation of the operation of the real-world process or system over time and therefore generates artificial history of a system (Banks et al 2005). The observation of that artificial history is used to infer on the operating characteristics of the real system.
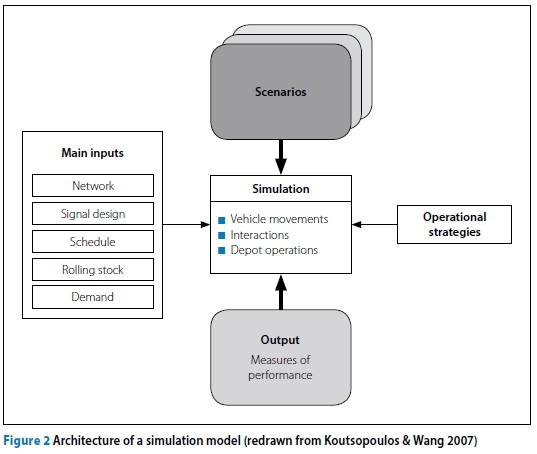
Figure 2 displays the architecture of a simulation model, which indicates its inputs, scenarios, operating strategies and outputs, as postulated by Koutsopoulos and Wang (2007). The main inputs have been summarised in the figure, with each input having a further set of inputs and parameters required, such as various rolling stock characteristics and depot/station spacing. The operational strategies represent the real-time control operations aiming at service restoration. The simulation outputs a large set of performance measures relating to the simulation operations.
Dessouky and Leachman (1995) indicate that a good method of evaluating railway alternatives is through the use of simulation which focuses on the difference in total delay accumulated in an alternative, and a proposed status quo alternative. Sogin et al (2013) simulated a single-line railway with sidings every 24 km and were able to transport up to 40 freight trains per day with zero passenger train trips per day.
METHODOLOGY
This section discusses the method of analysing the freight growth along a corridor as predicted by Transnet (2016) before the review and identification of the various relevant standard-gauge intervention alternatives for each corridor are conducted.
The methodology also assesses how the various projects will be evaluated using different economic evaluation methods that have been described by Remer & Nieto (1995).
AnyLogic agent-based simulation modelling was used to model the operations of the standard-gauge alternatives that outperformed the base case.
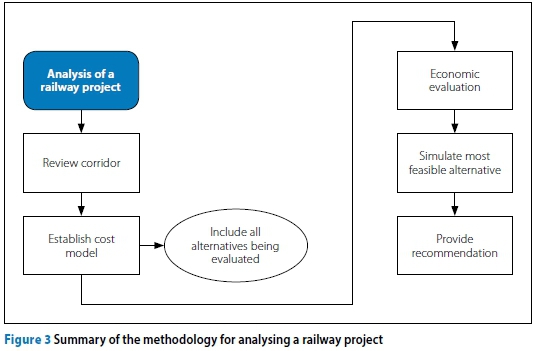
Figure 3 displays the summary of the methodology for analysing a railway project. The procedure displayed was followed for the analysis of each of the corridors.
Identification of corridors for intervention
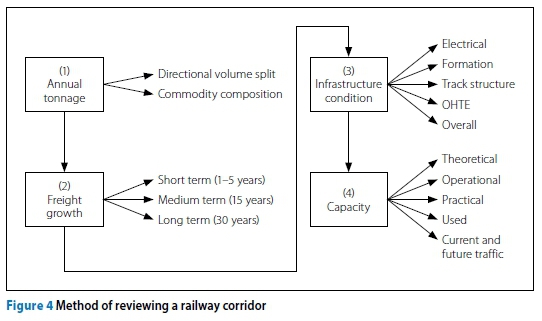
The four principal factors that were used to determine how a corridor was operating were annual tonnage, freight growth, infrastructure condition and capacity. Figure 4 displays the various parameters analysed for each of the four principles.
Annual tonnage for a corridor
The annual tonnage is the key driver of revenue generation along a corridor. Figure 5 displays the present worth of hypothetical railway corridors to consider whether a corridor would have a positive or negative present worth if a narrow- to standard-gauge conversion were performed on a double-lined track.
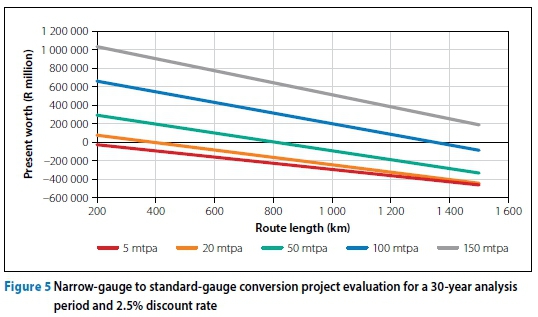
The calculation was influenced by the amount of tonnage transported per year for a 30-year analysis period on corridors of varying length with all possible operational and capital expenditure costs included. The present worth reduces as the line length increases, due to increased capital expenditure of the associated infrastructure for the same amount of tonnage being transported. This allows corridors in the core network to be evaluated by comparing their expected tonnage transported per year and line length of the corridor with the data in the figure. The present worth can then be estimated from the figure. For example, a corridor that transports 50 mtpa and is 400 km in length, would be expected to have a present worth of approximately R200 000 million if it were converted to standard gauge. Hudson et al (1997) indicate that the discount rate is the interest rate less the inflation rate, ultimately giving the true return of the investment.
Tonnage growth
Transnet (2016) indicates that a key driver of the freight growth rate is GDP and predicts the following forecasted overall freight growth rates per annum: a likely scenario of 3%, a high scenario of 4.1% and a low scenario of 2.1%. It is likely that the growth rates may vary from year to year and from corridor to corridor; therefore, a sensitivity analysis on each corridor's predicted freight growth rates was conducted to ensure that the best alternative is selected per analysed corridor (Remer & Nieto 1995).
Infrastructure condition
The condition of the infrastructure on a rail corridor is a good indicator of when maintenance or upgrades are likely to take place, as well as to what level this would be required. Transnet (2016) provided a summary of the rail network's condition, which could be used to identify which lines would require maintenance or an upgrade.
Line capacity
The practical capacity utilisation, which is 65% of the theoretical capacity, could be used to assess how congested a corridor is and if it has capacity available to meet demand increases on the corridor over time (Transnet 2016). The practical capacity utilisation was used to evaluate how long a line would be able to operate before upgrades are required.
Economic evaluation of railway projects
The key factor in determining whether an alternative can be selected is the cost that is associated with the alternative compared to the base case. Therefore, a base comparison case was selected (Stanford University 2005). Transnet's MDS was selected as the base case, since the MDS is the published plan Transnet intends on following and implementing over the next 30 years. If any of the alternatives evaluated produced a more profitable outcome than the base case, they were deemed to be more beneficial than the base case.
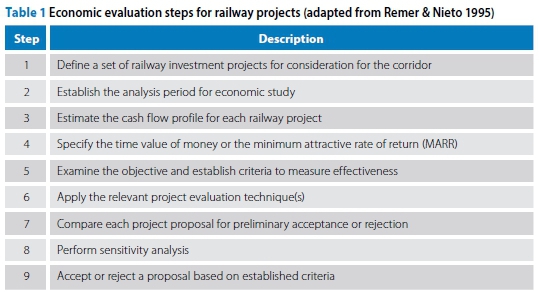
The economic evaluation of each of the projects was conducted using the procedure provided in Table 1, which has been adapted from Remer and Nieto (1995).
Cost model
To determine whether a line could benefit from a standard-gauge intervention, an economic method of evaluation was used over the life of the project. Benefits include increased profitability, increased line capacity to meet long-term traffic demands, infrastructure condition improvements and improved rolling stock condition. However, the main criteria used was the comparison of the various projects' profitability.
Table 2 displays the economic assumptions which were required for the various alternatives to be compared to the base case. The assumptions were similar to the assumptions made by the DoT (2009), Lombard (2017) and Joubert et al (2001).
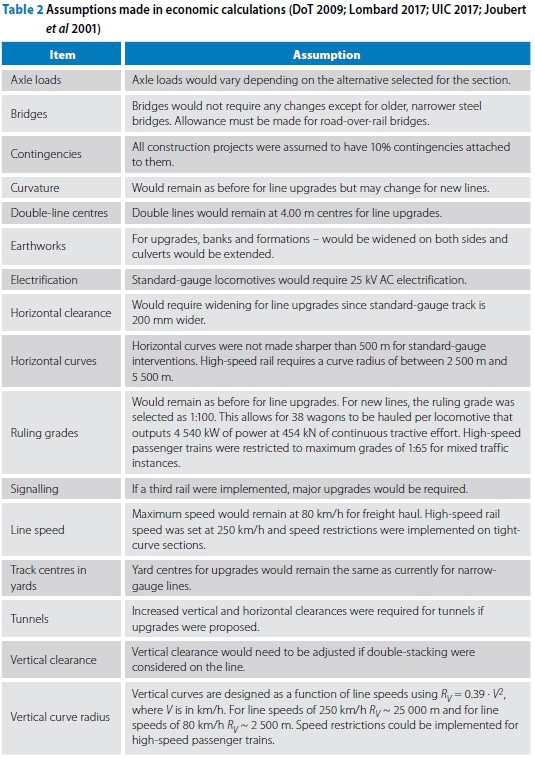
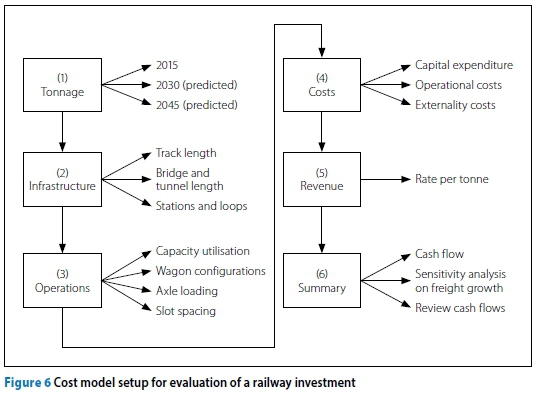
Figure 6 displays the methodology used to produce the cost model that was used to evaluate each of the alternatives for a corridor. The base case and the alternatives were all assessed in the same manner to allow for uncomplicated comparison between all the cases.
Revenue
Revenue was used in the analysis for the true return of the various investments to be compared.
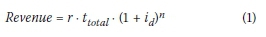
Where:
r is the average rate per tonne,
idis the discount rate, equal to the interest rate less the inflation rate and is the true return of an investment (Hudson et al 1997),
ttotalis the total tonnage for the entire analysis period, and
n is the analysis period in years.
Stats SA (2019) indicates that South Africa has achieved an inflation rate of 4.5% per annum since 2010, and this was selected as the inflation rate. The interest rate was set at 7% (South African Reserve Bank 2019).
Costs
Costs can be broken down into operational, capital expenditure (CAPEX) and rolling stock costs. Maintenance was assumed to be equivalent for all alternatives per kilometre, which is the same assumption that was made by Lombard (2017) and DoT (2009).
Operational costs were calculated using the Harris relationship, which is calculated by dividing the tonne route kilometres by the track kilometres (Harris 1977). An externality cost, which accounts for rail's impact on the environment, was also included in the operational costs. The factor calculated by Havenga (2012) and the Department of Environmental Affairs (2015) came to R 0.0129/tonne-km. The operating costs obtained from Transnet's Integrated Report from 2017 for the Natal corridor, Transnet's Integrated Report from 2018 for the coal line and Lombard's (2017) study were used to verify the Harris relationship and were plotted on Figure 7.
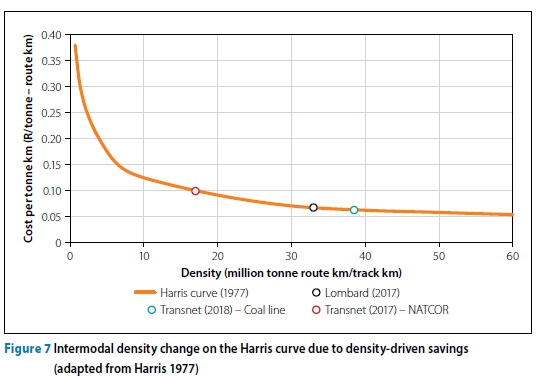
Table 3 displays the costs to construct ballasted track, railway bridges and tunnels. The cost of constructing ballasted railway track was obtained from a recent project completed by Transnet (2017) and a study conducted by Lombard (2017). The cost of constructing a railway bridge was acquired from a study conducted by Hadi et al (2016) on numerous bridge construction projects. The rate per metre of tunnel is related to the tunnel's bore diameter. These rates were gathered from a study conducted by Rostami et al (2013). Table 3 also displays the variation in costs between narrow- and standard-gauge locomotives which operate on either diesel or electricity. Lastly, the table summarises the costs of purchasing the two types of wagons, and it was noted that standard- and narrow-gauge wagons could be bought for similar prices (Lombard 2017; Transnet 2018).
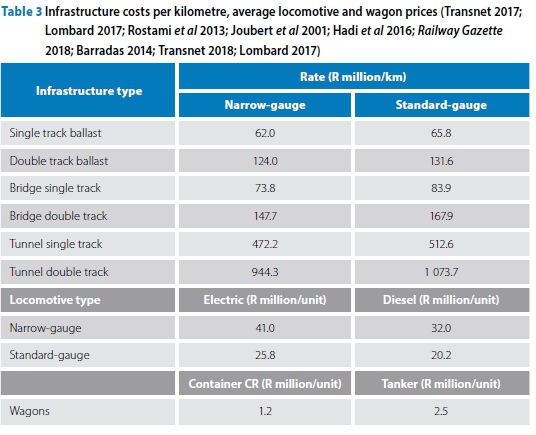
Lombard (2017) states that the number of wagons per locomotive is a function of the ruling grade, while Dutton (2014) indicates that, to prevent damage to the wheels of a train due to heat, the heat input per wheel should not exceed 12 kW in South African conditions. These checks were therefore performed when determining the number of wagons per locomotive for the various railway corridors.
Alternatives for a gauge conversion
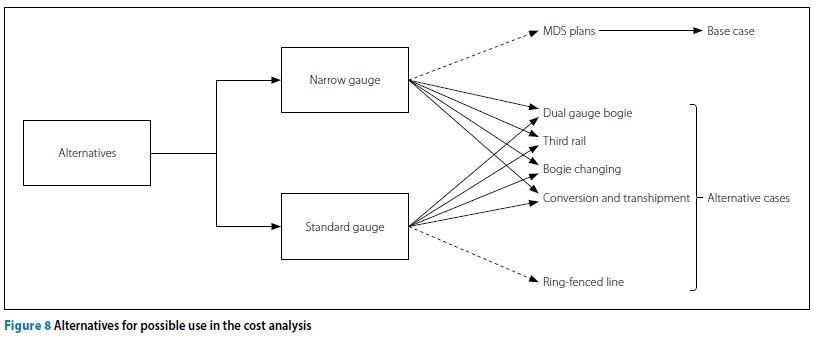
Figure 8 displays the various alternatives which could be implemented along the different corridors. As each corridor would be better suited to specific alternatives (and not to others), the relevant alternative was selected for each corridor.
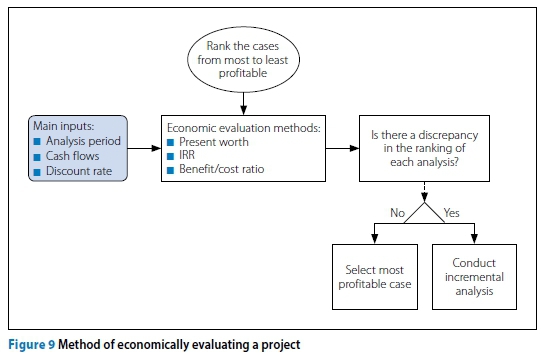
Cashflow and economic evaluation techniques
For each alternative evaluated on a corridor, the total cost, including operational costs and CAPEX, revenue generation per year and cash flow, was calculated. The cash flow was taken as the amount of revenue less the total costs per year before taxation, interest, amortisation and depreciation, therefore providing the net profit or cashflow (Hudson et al 1997).
The present worth method was used in conjunction with the benefit/cost ratio and IRR methods. Figure 9 displays the method used to economically evaluate a set of railway projects.
Simulation model setup
Simulation was used to assess the effects of performing a standard-gauge intervention on a corridor if the standard-gauge intervention was the most economical alternative for the corridor.
Identification of line properties
To simulate a railway corridor, various line property, rolling stock parameters and operational information are required. Table 4 displays the critical properties required to simulate a railway. These properties vary depending on which corridor is being simulated.
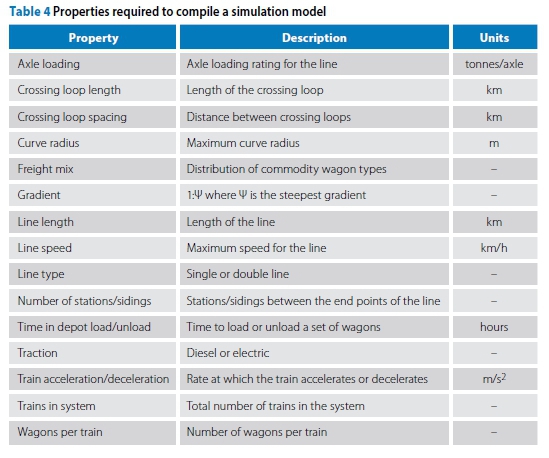
The simulation was conducted using AnyLogic because of the software's diversity and ability to perform simulations at a microlevel. The model utilised AnyLogic's rail library, as well as the process modelling library.
Simulation model parameter calibration, validation and optimisation
Data inputs for a simulation model can either be measured directly, or if the inputs are unknown, they can be calibrated (Koutsopoulos & Wang 2007).
The root mean square percentage error (RMSPE) was used to observe the differences between the simulated and observed values, and an acceptable RMSPE was within 10% of the observed true mean (Balakrishna et al 2007). Since a freight-orientated standard-gauge railway does not exist within South Africa, the observed values were calculated using first principles, or were in other instances collected from known standards and documents.
Optimisation of the network was performed with the main aim of reducing delay, which is the additional time it takes a train to travel on a route due to conflicts with other traffic (Dingler et al 2010). Two parameters were varied to optimise the proposed standard-gauge intervention, which included varying the crossing loop spacing of single lines and varying the number of wagons per train.
RESULTS AND DISCUSSION
This section firstly summarises the core network and identifies which corridors would potentially benefit from a standard-gauge intervention. A discussion then follows on whether it would be economically feasible to construct a standard-gauge intervention on any of the South African railway corridors. Lastly, the outcomes of the simulation model are discussed.
Review of the core network corridors
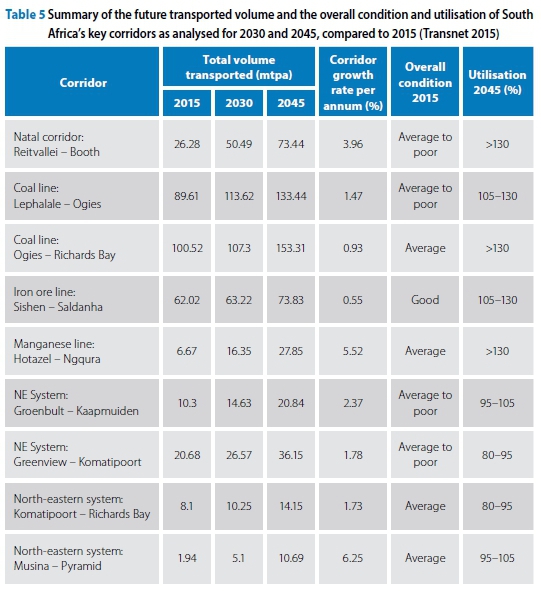
Table 5 displays the corridors identified for analysis. The nine corridors in the table form part of the following five systems:
■ Natal corridor
■ Coal line
■ Iron ore line
■ Manganese line
■ North-eastern system.
Table 5 indicates that as of 2015, only the coal export line and the iron ore line exceed freight volumes of 30 mtpa. The Natal corridor is predicted to grow in the years to follow and to exceed 50 mtpa by 2030. By observing the overall line condition, it was also noted that the only line in good condition is the iron ore line. Most of the network would reach a state of collapse if no upgrades are performed as indicated by the utilisation percentage of each corridor in the year 2045.
Results of the economic evaluation of railway projects
The analysis period was set at 30 years, the discount rate at 2.5% and the freight growth rate was varied depending on the corridor's predicted growth rate. A sensitivity analysis was conducted on the freight growth rates for each of the corridors identified and the construction duration was also varied for the alternative cases. The analysis results were not sensitive to the discount rate.
Table 6 displays the results of the economic analysis conducted on the north-eastern, manganese and Gauteng to Cape systems. The results in all cases indicate that following the plans described in the MDS would be the most profitable since their standard-gauge project's construction cost is too high for the volumes transported on these lines.
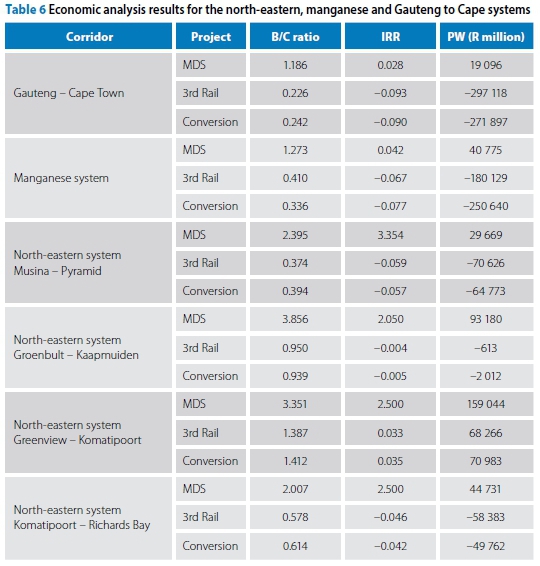
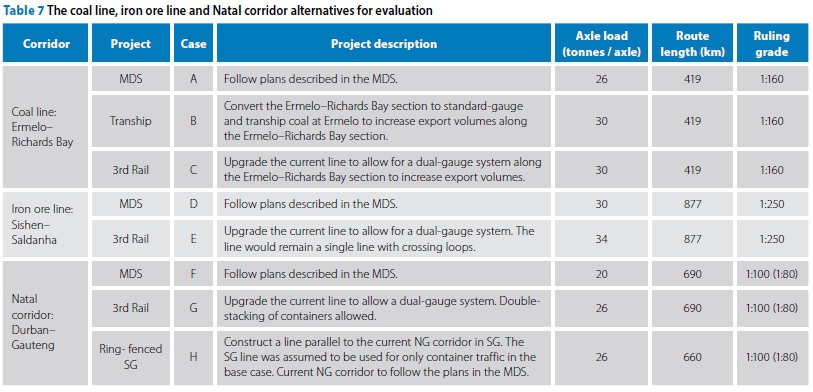
Table 7 displays the various alternatives that were evaluated to determine which case would result in the most economically beneficial project for the coal line, iron ore line and the Natal corridor. Ruling gradients, route lengths and axle loads for each alternative have been included in the table. The Natal corridor cannot have a ruling gradient of less than 1:80 between Durban and Pietermaritzburg; therefore, train reconfiguration is required once the train has traversed this section of the corridor.
Table 8 displays the outcomes of the economic analysis for the three railway corridors. From the analysis the MDS is the most profitable project for all the corridors. Both the coal and iron ore lines operate near capacity and are highly valued by Transnet. The Natal corridor transports intermodal freight; however, despite being able to double-stack containers on a standard-gauge line, none of the standard-gauge alternatives would be profitable.
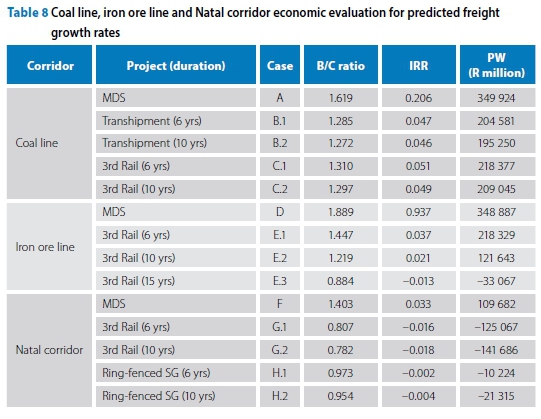
Figure 10 displays the present worth values of the cases F, G.2 and H.2 for varying freight growth rates. This was only conducted for a ten-year construction period since it is the more likely situation. For Case H, it was noted that an opportunity exists along the Natal corridor because the line would be highly underutilised. Rail held a market share of 15% of the freight transported along the Natal corridor in 2016 and it is predicted that in 2045 the Natal corridor, including both road and rail, could transport 223 million tonnes of freight between Gauteng and Durban (Naidoo 2015).
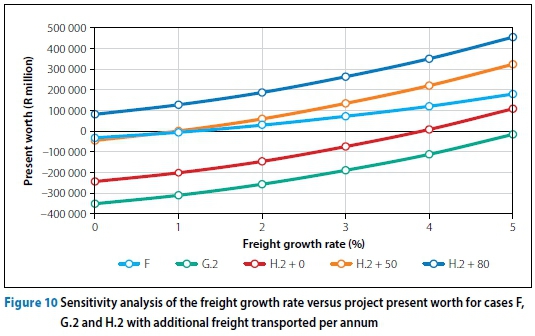
In Case H, the single-line standard-gauge railway could be used to transport a large portion of the freight along the corridor. From the initial operational analysis, it was noted that the standard-gauge line could carry an additional 80 mtpa on top of the current 18.1 mtpa of containers, which the line would carry from the predicted rail traffic.
Figure 11 displays the present worths of Cases F and H, where Case H carries a varying amount of additional tonnage on the standard-gauge single line along the Natal corridor. The freight growth rate was set at the predicted rate of 3.96% per annum as per Transnet's expected growth rate. Under these conditions, if the standard-gauge line were to carry an additional 37.5 mtpa, Cases F and H would have the same present worth values. Only Case H would be able to carry additional tonnage without jeopardising the future operations on the corridor due to its low utilisation without the prescribed additional tonnage.
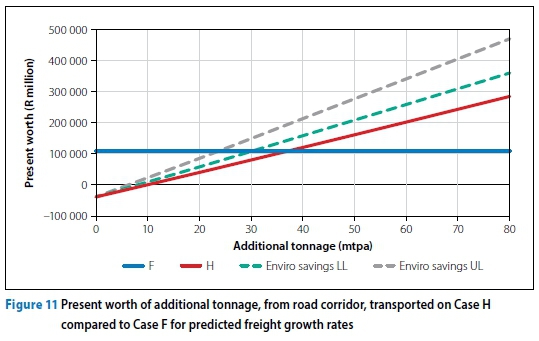
Transporting commodities with rail would also induce an environmental benefit due to the reduced externality costs such as accidents, noise, congestion and emissions. A confidence interval has been included in Figure 11 for a 95% confidence level with upper and lower limits. The average externality cost savings of rail over road transport were obtained from Havenga et al (2012). This additional benefit of transporting the commodities on road, as opposed to rail, indicates that Cases F and H have equal present worth values between an additional 24 and 30 mtpa.
Ruling grade check, simulation and optimisation of the standard-gauge line
From the economic analysis conducted, the only feasible standard-gauge intervention which may be possible to implement realistically, was the ring-fenced standard-gauge single line operating concurrently with the narrow-gauge line between Durban and Gauteng.
Ruling grade check
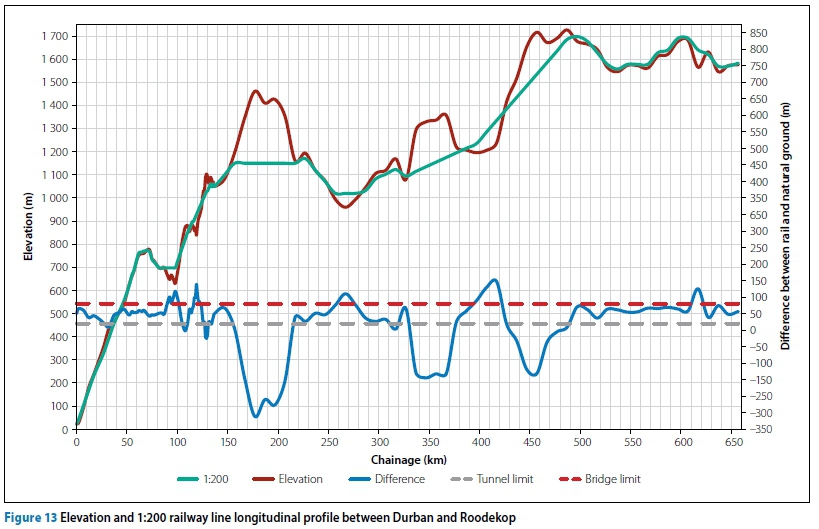
Figure 12 displays the 1:100 railway line and ground elevation longitudinal profile between Durban and Roodekop, Gauteng. The 110 km between Durban and Pietermaritzburg had to be designed at a ruling grade of 1:80 to avoid a long tunnel being constructed between these two points. Each locomotive would be able to haul 25 wagons along this section. The tunnel and bridge limits were set at -30 m and 30 m respectively; therefore, any cutting deeper than 30 m would require a tunnel to be constructed and any fill higher than 30 m would require a bridge to be constructed. The section between Pietermaritzburg and Roodekop was designed at 1:100. Five tunnels, totalling 30 km in length, would be required to be constructed for the 1:100 ruling grade, as well as 25 km of bridges.
Figure 13 displays a railway line designed at a ruling grade of 1:200; however, the extra tunnelling results in an additional R84.6 billion construction costs. The reduced grade would allow more wagons to be hauled per locomotive, ultimately increasing the throughput per locomotive per annum. High-speed passenger trains would be able to operate on either of the profiles since the maximum grade is less than 1:65.
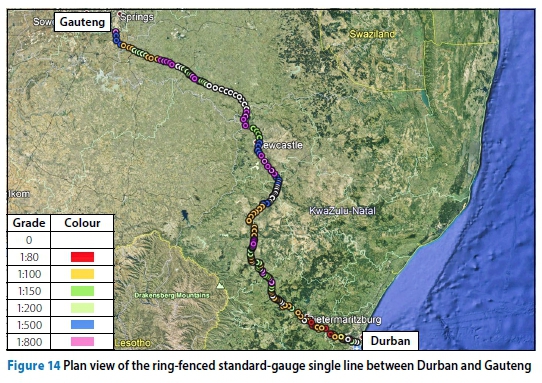
Figure 14 displays the plan layout of the standard-gauge single line between Durban and Roodekop, Gauteng at a ruling grade of 1:100. The line closely follows the current narrow-gauge line. The colour of the points indicates the grade at which the line would be constructed.
Simulation and optimisation of the standard-gauge line
Table 9 displays the scenarios evaluated in the simulation. Five crossing loop spacing distances were evaluated to establish how the number of crossing loops affected the number of trains that could pass through the system per day. It was noted that, as the number of crossing loops on the line increased, the average number of trains per day that could pass through the system increased. The Scott formula was used to verify the results of the agent-based simulation and these results have been included in Table 9 (Parkinson 1996).
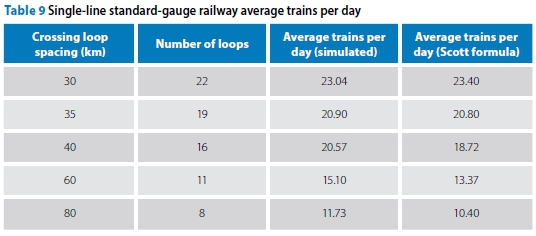
Figure 15 indicates the average delay for the varying number of crossing loops. It is noted that, as the number of crossing loops on the line increased, the delay experienced per train is reduced. Less time is spent waiting at crossing loops when there are more loops, which leads to reduced interaction between trains. Despite the costs associated with constructing additional loops, the system can operate more efficiently, and more loops will lead to greater throughput per annum.
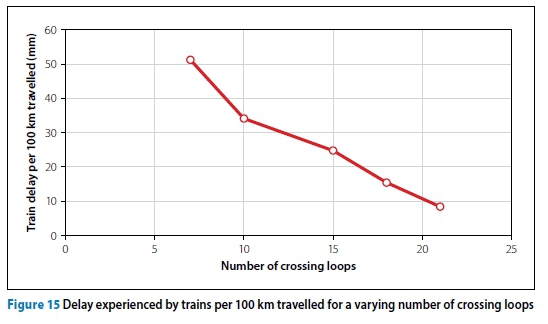
Figure 16 displays the number of tonnes transported for varying crossing loop spacing and train lengths. The figure indicates that running longer trains will lead to more tonnage being transported by the standard-gauge line. It is therefore most beneficial to run 210-wagon trains.
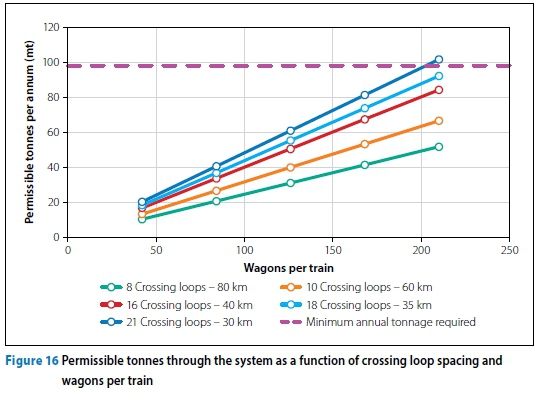
As the number of crossing loops increases, so does the permissible annual tonnage along the line. In Figure 10 it was required that the line be able to transport 98.1 mtpa if the line were used to transport the 80 mtpa of additional freight from the road. To meet the 98.1 mtpa, a minimum of 21 crossing loops should be constructed at spacings of 30 km, and train sets should transport, on average, at least 203 wagons per trip.
CONCLUSIONS
For this study the following conclusions can be made after the analysis and discussion of the results:
Corridors that could benefit from a standard-gauge intervention
It was noted from the analysis that corridors would be required to transport a large amount of tonnage to economically warrant an intervention. Three corridors were identified that could economically benefit from a standard-gauge intervention, namely the coal export line, the iron ore line and the Natal corridor. The other corridors within South Africa are not expected to transport enough tonnage to warrant a standard-gauge intervention that is economically viable with current freight growth projections.
The best suited interventions for the corridors identified
From the economic analysis of the coal line, iron ore line and the Natal corridor it was identified that none of the corridors would be able to outperform the base case. It was, however, determined that, for the Natal corridor, the standard-gauge line would be highly underutilised in the base case analysis and that an opportunity existed to transport additional freight, which would otherwise be transported by road. If an additional 37.5 mtpa were transported on the standard-gauge line, Transnet's Market Demand Strategy would not be the most economical option.
The standard-gauge intervention's effect on operations
A ring-fenced standard-gauge line along the Natal corridor would have very limited interaction with the narrow-gauge network, therefore the break-of-gauge issue is avoided. From the simulation it was observed that a standard-gauge single line would be able to transport in excess of 100 mtpa if 21 or more crossing loops are constructed. The delay experienced from train interactions was reduced as the number of crossing loops was increased. If the line were to be constructed, 21 crossing loops should therefore be constructed to relieve operational stress on the system when the line begins to reach the expected capacity.
ACKNOWLEDGEMENT
The authors would like to acknowledge and thank Transnet Freight Rail for their financial support.
REFERENCES
Balakrishna, R, Antoniou, C, Ben-Akiva, M, Koutsopoulos, H & Wen, Y.2007. Calibration of microscopic traffic simulation models. Transportation Research Record, 1999: 198-207. [ Links ]
Banks, J, Carson I I, J S, Nelson, B L & Nicol, D M 2005. Discrete-Event System Simulation. 4th ed. India: Pearson Education. [ Links ]
Barradas, S. 2014. Transnet's market demand strategy, South Africa. Engineering News, 21 March 2014. [ Links ]
Blank, L T & Tarquin, A J 1989. Engineering Economy. 3rd ed. New York: McGraw-Hill. [ Links ]
Department of Environmental Affairs (DEA) 2015. Freight shift from road to rail. Pretoria: DEA. [ Links ]
Department of Transport (DoT) 2009. National Transport Master Plan. NATMAP 2050 - Rail gauge study report. Pretoria: DoT. [ Links ]
Department of Transport 2017. National Rail Policy. Draft White Paper. Pretoria: DoT. [ Links ]
Dessouky, M M & Leachman, R C 1995. A simulation modelling methodology for analysing large complex rail networks. Simulation, 65: 131-142. [ Links ]
Dingler, M, Koenig, A, Sogin, S & Barkan, C P 2010. Determining the causes of train delay. Proceedings, 2010 Annual AREMA Conference, Orlando, FL. [ Links ]
Dutton, C J 2014. Rolling stock: Train consist design theory. Technical Note. Johannesburg: Transnet Engineering Services. [ Links ]
Hadi, M, Orabi, W, Xiao, Y & Jia, J 2016. Estimating total cost of bridge construction using Accelerated Bridge Construction (ABC) and conventional methods of construction. Miami, FL: Florida International University, Department of Civil and Environmental Engineering. [ Links ]
Harris, R 1977. Economics of traffic density in the rail freight industry. The Bell Journal of Economics, 8(2): 556-564. [ Links ]
Havenga, J, Simpson, Z & De Bod, A 2012. South Africa's domestic intermodal imperative. Research in Transportation Business and Management, 5: 38-47. [ Links ]
Hudson, W R, Haas, R & Uddin, W 1997. Infrastructure Management, New York: McGraw-Hill. [ Links ]
Joubert, H S, Pretorius, C, Morgan, J & Mntonintshi, U 2001. Gautrain: Route determination. Proceedings, 20th South African Transport Conference, 16-20 July 2001, Pretoria. [ Links ]
Koutsopoulos, H N & Wang, Z 2007. Simulation of urban rail operations: Application framework. Transportation Research Record, 2006(1): 84-91. [ Links ]
Lombard, P C 2017. Composing a heavy haul engineering symphony in differential life cycle costing. Cape Town: International Heavy Haul Association. [ Links ]
McNaught, M D 2015. A risk-reliability comparison of track sections in the passenger railway industry. MSc Dissertation, Stellenbosch University. [ Links ]
Naidoo, I 2015. SIP2 Logistics and industrial corridor. Proceedings, Edge Seminar, 19 February 2015, Durban. [ Links ]
Park, C S & Sharp-Bette, G P 1990. Advanced Engineering Economics. 1st ed. New York: Wiley. [ Links ]
Parkinson, T 1996. Rail transit capacity. TCRP Report 13. Washington, DC: Transportation Research Board, National Research Council. [ Links ]
Railway Gazette 2018. World rolling stock market. April 2018. Available at: https://www.railwaygazette.com/traction-and-rolling-stock/world-rolling-stock-market-april-2018/46257.article. [ Links ]
Remer, D S & Nieto, A P 1995. A compendium and comparison of 25 project evaluation techniques. Part 1: Net present value and rate of return methods. International Journal of Production Economics, 42(1): 79-96. [ Links ]
Rostami, J, Sepehrmanesh, M, Gharahbagh, E A & Mojtabai, N 2013. Planning level tunnel cost estimation based on statistical analysis of historical data. Tunnelling and Underground Space Technology, 33(2013), 22-33. [ Links ]
Sogin, S L, Lai, Y C, Dick, C T & Barkan, C P L 2013. Comparison of capacity of single- and double-track rail lines. Transportation Research Record, 2374(1): 111-118. [ Links ]
South African Reserve Bank (SARB) 2019. Rates. Pretoria: SARB. [ Links ]
Stanford University 2005. Guidelines for Life Cycle Cost Analysis (LCCA). Land and buildings. Stanford, CA: Stanford University. [ Links ]
Stats SA 2019. Falling fuel prices dragging inflation down. Pretoria: Statistics South Africa. [ Links ]
Transnet 2012. Market demand strategy. Johannesburg: Transnet Freight Rail. [ Links ]
Transnet 2015. Integrated Report 2015. Johannesburg: Transnet Freight Rail. [ Links ]
Transnet 2016. Long-term planning framework. In: Freight demand plan. Johannesburg: Transnet, pp 13-47. [ Links ]
Transnet 2017. Integrated Report 2017. Johannesburg: Transnet Freight Rail. [ Links ]
Transnet 2018. Freight rail 2018. Johannesburg: Transnet Freight Rail. [ Links ]
UIC (International Union of Railways) 2017. High-speed rail - Fast track to sustainable mobility. Paris: UIC. [ Links ]
Van der Meulen, R D 2010. How might the railway renaissance evolve in South Africa? Proceedings, 29th Southern African Transport Conference, Pretoria, pp 630-639. [ Links ]
 Correspondence:
Christian Demmerez De Charmoy
Department of Civil Engineering, University of Pretoria
Pretoria 0002
T: +27 82 265 5805
E: cdecharmoy@gmail.com
Hannes Gräbe
Department of Civil Engineering, University of Pretoria
Pretoria 0002
T: +27 420 4723 / 083 286 5305 E: hannes.grabe@up.ac.za

CHRISTIAN DEMMEREZ DE CHARMOY completed his MEng (Transportation Engineering) studies at the University of Pretoria earlier this year and is currently working for Hatch in its rail and transit business unit as a civil perway engineer. He is also registered as a candidate engineer and is looking forward to adding value to the railway engineering industry.

PROF HANNES GRÄBE (Pr Eng, FSAICE), is a civil engineer with experience in the fields of track technology, geotechnology, advanced laboratory testing, field investigations, maintenance models and numerical analysis of track structures. He is Associate Professor: Transnet Freight Rail Chair in Railway Engineering at the University of Pretoria, where he lectures under- and post-graduate courses in railway engineering. He is also responsible for railway research, as well as for continuing professional development in the form of short courses presented to industry. He holds a PhD degree from the University of Southampton (UK) and is a Fellow of the South African Institution of Civil Engineering (SAICE) and is registered with the Engineering Council of South Africa (ECSA) as a professional engineer.

