


Services on Demand
Article
 English (pdf)
 Article in xml format
 Article references
Indicators

Related links
-
 Cited by Google
 -
 Similars in Google
Share

 Permalink
Journal of the South African Institution of Civil Engineering
On-line version ISSN 2309-8775
Print version ISSN 1021-2019
J. S. Afr. Inst. Civ. Eng. vol.62 n.3 Midrand Sep. 2020
http://dx.doi.org/10.17159/2309-8775/2020/v62n3a1
TECHNICAL PAPER
Water meter replacement and its impact on water consumption, utility revenue and payback periods
M Brinkley; A A Ilemobade; M Ncube
ABSTRACT
Mechanical water meter accuracy degrades over time due to wear and tear. Based on this premise, many water utilities around the world undertake meter replacement projects. In many instances, these projects neither assess the potential or actual impacts of meter replacement on consumption and utility revenue, nor undertake meter replacement based on a best practice, customised metering policy. From 2013 to 2015, Johannesburg Water (SOC) Limited embarked on a project to replace more than 50 000 mechanical water meters that had not been read over a period of 180 days due to technical faults. This study obtained and analysed two databases of these meters and arrived at a sorted and validated database comprising 3 679 meter replacements. For each meter replacement, twelve months of water consumption data was obtained for the period prior to and after replacement. This study then investigated the impact of replacement on water consumption, utility revenue and payback periods. Some high-level highlights from the study include the following: (i) a metering policy that addresses such issues as efficient meter database management, and the optimum meter replacement age and/or volumetric reading, is critical for any water utility if it is to obtain the best results from meter replacement; (ii) in order to guarantee the highest returns on investment, bulk meters (40 mm and larger) should be prioritised for meter replacement over single-stand residential meters; (iii) the replacement of 20 mm and 25 mm meters with 15 mm meters resulted in more accurate metering of consumption by virtue of increased consumption; and (iv) payback of the 15 mm replacement mechanical meters was achieved within 12 months, with the replacement of 20 mm and 25 mm meters resulting in average monthly revenue increases per property of R266.70 and R203.08 respectively.
Keywords: water meter replacement, consumption, revenue, payback
INTRODUCTION
Water meters are considered a water utility's "cash register" (van Zyl 2011), and in many instances they are the primary source of income for many utilities and municipalities around the world. In South Africa, revenue from water sales is one of the primary sources of income for Water Services Authorities, with water sales being, on average, 20% of all tradable services and as high as 100% in some municipalities (National Treasury 2017; Ncube & Taigbenu 2019). Average non-revenue water in South Africa is, however, estimated to be as high as 1.580 billion m3/annum (Bhagwan et al 2014), which is approximately one third of water being supplied. This translates to a loss of over R7 billion per year based on an average bulk water tariff of approximately R5/m3. It was estimated that, reducing these losses by about 4.6% through technical interventions (such as water meter management), could make up for the R300 million reduction in the local government equitable share in 2016/17 (National Treasury 2016).
Large-scale water meter replacement or installation projects are thus widely recognised as an effective means of reducing water wastage and usage (Masia & Erasmus 2013). Water metering provides a fair and equitable basis for charging for services, and thereby facilitates the means by which cost recovery can be achieved as required by the Water Services Act 108 of 1997 (RSA 1997). Only a few studies have, however, articulated the impacts of meter replacement on a utility's revenue (Selsky 2001).
Mechanical water meters, which constitute the majority of meters used in South Africa and many jurisdictions around the world, experience a degradation of accuracy over time (Stoker et al 2012), mainly due to wear and tear of the moving parts. This degradation is a function of several factors, such as poor water quality, abnormal water velocities, excessive throughput volumes or flow rates, sub-optimal installation and poor meter handling. The assumption that meter ageing, on its own, makes water meters less accurate, leads to the erroneous hypothesis that revenues are lost because the consumption of water is not accurately recorded by ageing meters (Arregui et al 2006; Shields et al 2012; Couvelis & Van Zyl 2015; Arregui et al 2016).
Based on the degradation premise above, several water utilities have, in more recent times, implemented large-scale meter replacement projects. Replacing water meters that are still providing reasonably accurate recordings is, however, wasteful and futile. According to several authors (including Allender 1996; Davis 2005; Arregui et al 2006; Fantozzi 2009; Viyakesparan 2010; Shields et al 2012; Couvelis & Van Zyl 2015; Fontanazza et al 2015; Moahloli et al 2019), there is a point that economically justifies the cost of meter replacement. Prior to that point, meter replacement is unwarranted and would qualify as wasteful expenditure. In many of the above studies the age of meters and the total volume of water through the meters were parameters that determined meter replacement. Table 1 summarises some of the studies in literature and their recommendations on optimum meter replacement periods and/ or volumes.
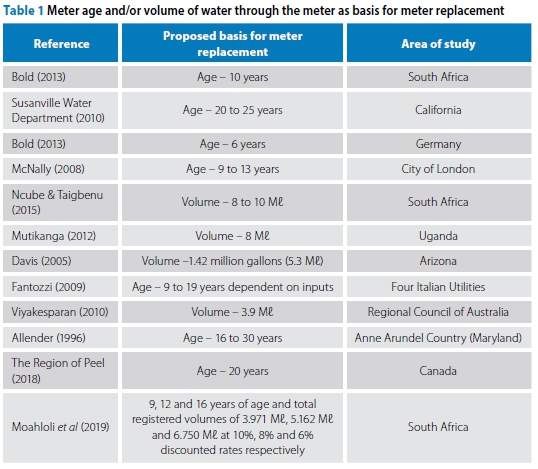
The above studies recommend that water utilities undertake investigations to determine the parameter(s) most influential to optimum meter replacement, based on prevailing site conditions and water tariff structures. Taking into consideration studies related specifically to revenue generation and meter replacements, it should be noted that Davis (2005) further quantified the optimum replacement point by utilising revenue generation and replacement cost (i.e. payback period) as the basis for comparison (i.e. when the lost revenue exceeds the replacement cost), but this is utility specific.
In Moahloli et al (2019), the average volume of apparent losses due to meter inaccuracies was calculated to be 1.8 kl per meter per month. As shown in Table 1, Moahloli et al (2019) also found that, by using the Net Present Value Chain (NPVCn) method, the optimum period for meter replacement was 9, 12 and 16 years at the total registered volumes of 3.971 Ml, 5.162 Ml and 6.750 Ml, and at 10%, 8% and 6% real discount rates, respectively. The above is based on the premise that meters are read accurately from the date of installation.
Mukheibir et al (2012) was able to quantify the volume of non-registered flow to be 1% of the average daily registered consumption for a new meter and 3.5% of the average daily registered consumption for an aged meter. Mukheibir et al (2012) further computed the average under-registration to be between -0.4% and +0.1%, changing from over-registration to under-registration as the meter aged.
From their study, Mukheibir et al (2012) concluded that, based on the unregistered percentages, it was not cost-effective to replace water meters if they registered less than 250 kl/yr.
In tandem with many of the above highlighted studies that investigated the parameters impacting on optimum meter replacement, this study investigated a large-scale water meter replacement project undertaken by Johannesburg Water (SOC) Limited (JW). The impact that water meter replacement has had on water consumption, with a particular focus on revenue and the payback periods for the investment, was also evaluated. Based on results from the study, recommendations regarding optimum meter replacement are proffered.
LARGE-SCALE WATER METER REPLACEMENT PROJECT
JW is a City of Johannesburg Municipality Owned Entity with the mandate to supply potable water and sanitation services. In accordance with the City of Johannesburg Metropolitan Municipality Bylaws (City of Johannesburg 2018b), all water consumers on a Level of Service 3 (i.e. municipal piped water supply to a stand) must be metered. Furthermore, all consumer meters within the jurisdiction of JW must always be fully operational and accessible for the recording of consumers' consumption. The Bylaws, however, allow for the estimation of water consumption for a period of up to 180 days.
In keeping with the above requirements, JW implemented a project that replaced more than 50 000 meters throughout its area of jurisdiction between 2013 and 2015. These meter replacements were aimed at addressing the backlog of water meter estimations (for billing purposes) in excesses of the required maximum of 180 days. The replaced meters included:
■ meters that could no longer be located
■ meters with faded or frosted dials
■ inaccessible meters
■ meters requiring maintenance, including damaged meter boxes and lids
■ meters suspected to have stopped. Two databases formed the basis for the analysis undertaken in this study. The first database (D1) contained a list of residential water meters obtained from the JW Meter Information System (Ncube 2019). The consumption records in D1 were from July 2003 to July 2015. The second database (D2) was collated by the contractors who undertook the JW large-scale meter replacement project between 2013 and 2015.
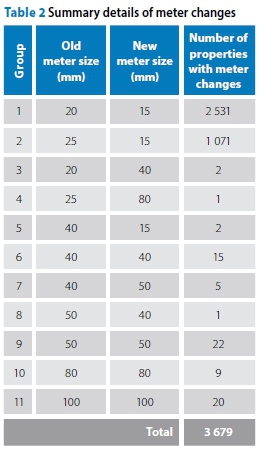
D1 and D2 were sorted and validated (i.e. the records used in the analysis were those where the old and new meter serial numbers were exact matches on both databases). From the 50 000 meter replacements, the sorting and validation exercise produced a third database (D3) comprising 3 679 meter changes (see Table 2). This low percentage (7.4%) of validated meter replacements highlights a significant challenge experienced by JW and many water utilities in the management of meter information to allow rigorous analysis and the drawing of relevant conclusions.
The following parametric relationships were investigated using data in D3:
■ Replaced meter sizes and their impact on consumption and utility revenue
■ Change in average monthly consumption against meter age
■ Payback periods of replacement meters. While it was the initial intention of JW
to replace meters size-for-size (i.e. a new 50 mm meter replaces an old 50 mm meter), a subsequent decision was taken to replace all 20 mm and 25 mm meters with 15 mm meters, which the city had recently adopted. It should be noted that the majority of the meters replaced were below-ground installations, which were changed for above-ground installations, for ease of location by meter readers. While the change in design or layout was not taken into consideration when comparing pre- and post-intervention consumption, it is not expected to have any impact on the consumption figures.
Groups 1 and 2 of Table 2 comprise a significant percentage (98%) of the meters changed, and are the focus of this study, as the numbers of the rest of the meters were insignificant. Meter class could not be considered, as meter class information was unknown for the majority of the meters. For each of the 3 679 meter changes in D3, twelve months of water consumption data before and after the meter change was obtained from D1. For each group of meter changes, the variation in consumption after the meter change was determined together with the resulting change in revenue. Revenue was calculated using the City of Johannesburg's 2017/18 block water tariffs (City of Johannesburg 2018a).
ANALYSES AND DISCUSSION
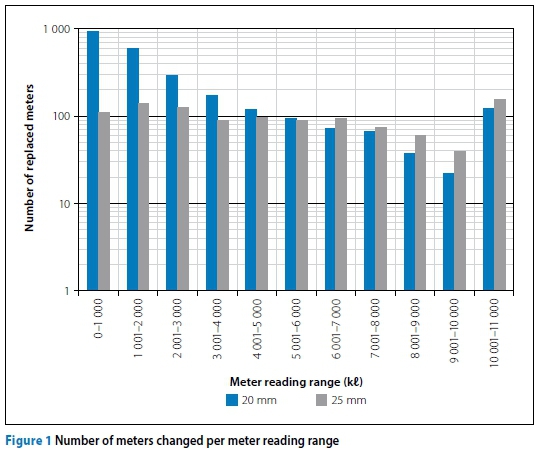
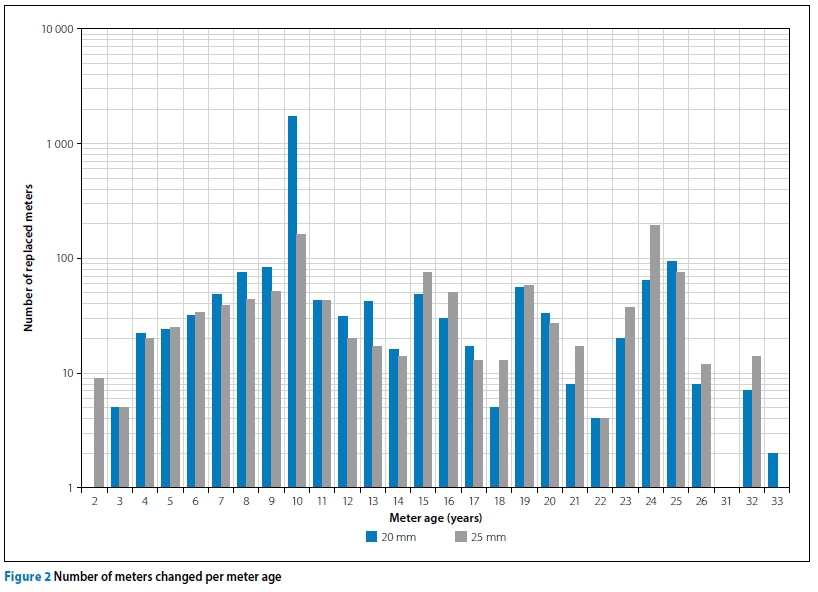
Figures 1 and 2 show the number of meters changed per meter reading range and meter age respectively for Group 1 (20 mm) and Group 2 (25 mm) meters. In Figure 2, meters aged 10 years comprised 51% (1 873) of D3, while meters with volumetric readings between 0 and 1 000 kl comprised 28% (1 042) of D3. In total therefore, 14% of the meters in D3 were 10 years old and had a reading less than or equal to 1 000 kl. This translates to an average consumption of 8.33 kl per month and differs significantly from the average monthly consumption of 30 kl of Johannesburg residential properties (Ncube 2019). It is likely that these meters clocked over during their 10-year existence and thus introduced certain biases into subsequent analyses. If the meters had clocked over, this would imply that the overall cumulative volume that had passed through the meter was significantly higher than the last reading recorded, potentially including an additional 10 000 kl onto the recorded volume, depending on meter type and number of dials on the meter. This would therefore significantly alter the average monthly consumptions, based on the age of the meter. Due to the non-recording of meter clock-over data, this study is thus unable to validate and correct these in D3.
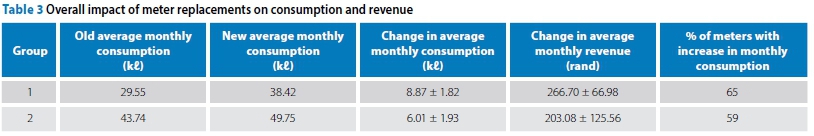
Replaced meter sizes and their impact on consumption and utility revenue
Table 3 summarises the overall impact of meter replacements on consumption and revenue. The replacement of 20 mm meters with 15 mm meters resulted in a net increase in average monthly consumption (8.87 kl) and revenue (R266.70) per meter. This is an outcome observed in Ncube and Taigbenu (2019) who published profiles for the typical Johannesburg residential consumer showing that 15 mm meters were ideal for this user category. The replaced 20 mm meters were, therefore, over-sized, and hence under-registered consumption. Similarly, the replacement of 25 mm meters with 15 mm meters resulted in a net increase in average monthly consumption (6.01 kl) and revenue (R203.08) per meter, indicating that the 25 mm meters were also over-sized, and hence under-registered consumption.
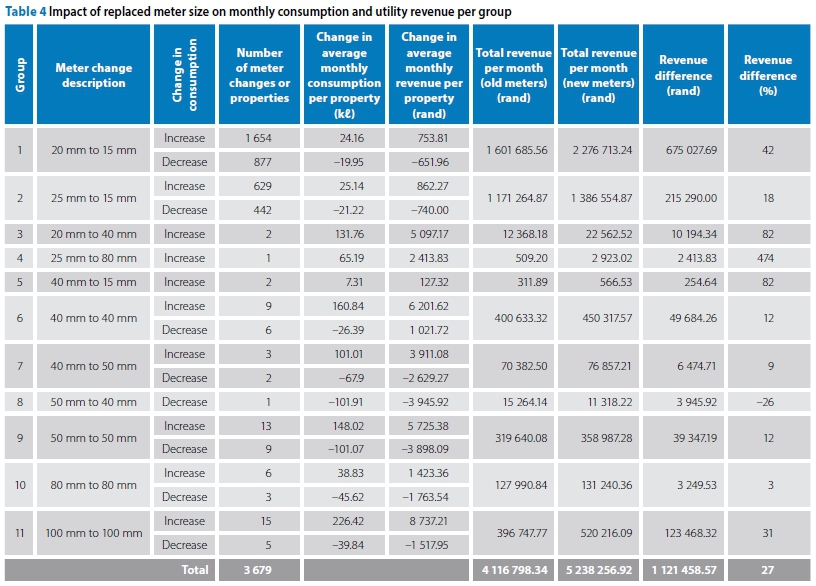
Table 4 presents the impact of replaced meter sizes on consumption and utility revenue for each group within D3. The table shows that there is generally a net increase in consumption, and consequently increased revenue across all meter groups except Group 8. While Groups 3
to 11 had a statistically insignificant number of meter changes, it is important to note that the replacement of meters larger than 25 mm resulted in notably larger changes in average consumption per meter change per month (and therefore revenue generated or lost) in comparison to meters in Groups 1 and 2. It therefore makes sense for water utilities to prioritise bulk meter replacement, when appropriate, over meters servicing single residential properties.
Change in average monthly consumption against meter age
As mechanical meters degrade with time, it is financially wise for a water utility to determine the optimum age and/or volumetric reading when mechanical meters should be replaced. Replacing meters before that optimum would negatively impact a water utility's revenues and would not result in marked improvements in the accuracy of recorded consumption.
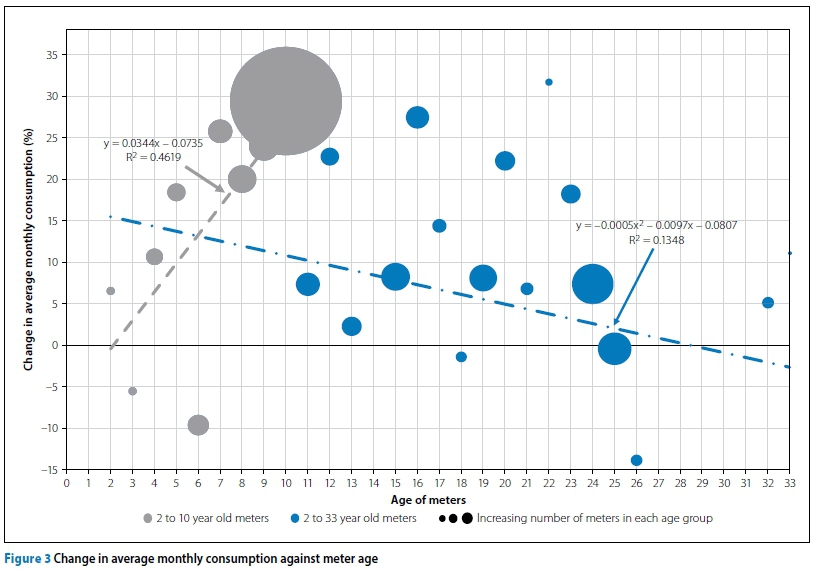
Based on mechanical meter degradation over time, and after meter replacement, it is expected that the change in average monthly consumption would be larger for older meters or meters with larger volumetric readings. This trend should occur up to a turning point where no appreciable increase is evident. The turning point indicates the optimum point at which a meter should be replaced.
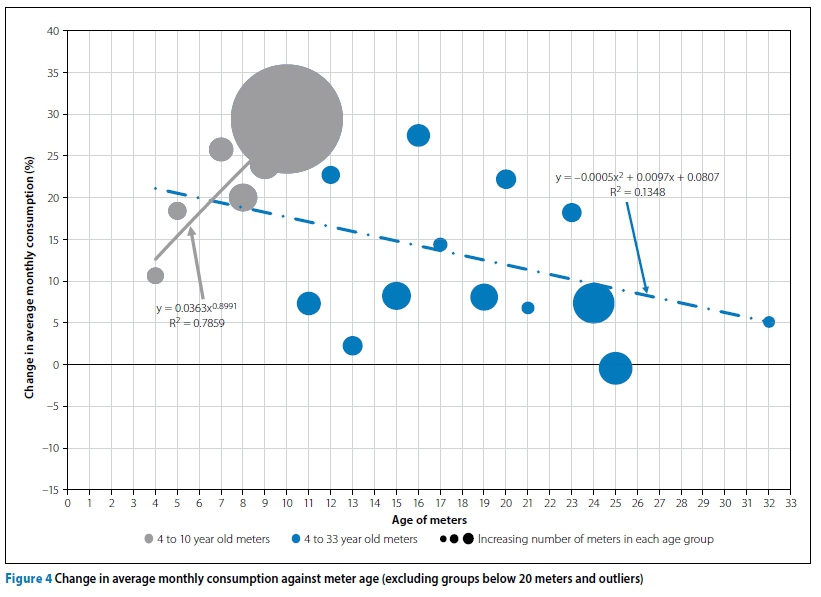
Figure 3 shows the change in average monthly consumption after meter replacement for meters aged 2 to 33 years. Figure 3 may have provided the answer to the question: At what age should residential meters be replaced? Sadly, it does not, due to the poor R2 value of 0.1348, which may be influenced by the very likely possibility of meter clock-overs after 10 years of age. As can be seen in Figure 3, after 10 years of meter age, the data for average monthly consumption is disordered. There is, however, a notable increase in average monthly consumption for replaced meters aged 2 to 10 years with an R2 value of 0.4619. This is further confirmed when meter age groups with less than 20 meters and outliers (i.e. groups with negative changes in average monthly consumption) are excluded from the graph. The result is an R2 value of 0.7859 as can be seen in Figure 4. While inconclusive, due to the negative change in average monthly consumption values at 3 and 6 years of meter age, the best fit line for replaced 2 to 10-year old meters lends itself to the earlier explanation of how the accuracy of meters degrade over time.
Payback periods of replacement meters
Payback periods (using 2018 meter replacement costs) were calculated for 15 mm meters, which comprised 98% of meter replacements within D3, aged 2 to 10 years. Payback period represents the length of time (in this instance, in months) required for the investment in meter replacement to be recovered, and was calculated using Equation 1 (Khan 1999):
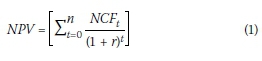
Where:
n = number of months/periods
r = discount rate (taken as 5.3%)
NCFt= net cash flow (i.e. inflows minus outflows) during a single period of time, t.
Table 5 shows the payback period results against meter age for all the 15 mm meters installed. All calculated negative payback period values (specifically for 3 and 6-year old meters) were converted to zero, as it is impossible to have negative payback periods, but rather implies that there was immediate recouping of meter replacement investments.
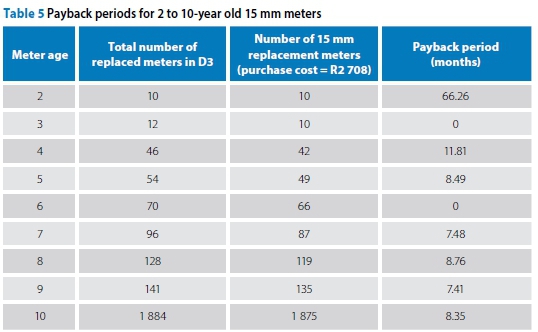
Excluding the zero payback period values and plotting payback period (Y) against meter age (X) results in a best fit power graph of Y = 98.723 X-1.231 with an R2 value = 0.78. The relatively high R2 value implies that, as meters aged (from 2 to 10 years), higher meter reading inaccuracies resulted, and this led to the under-registration of consumption. As a result of the new replacement meters being more accurate in registering consumption, there would be increased revenues, and consequently shorter payback periods. Excluding 2-year old meters in Table 5 and meters with immediate payback, payback for 15 mm replacement meters was achieved within 12 months.
Payback periods were also calculated and plotted for volumetric ranges as shown in Table 6. The best fit line shows a weak exponential (Y = 7.6696e-0.1239X with an R2 value = 0.41) increase in payback period with increasing volumetric range. This is counter-intuitive, i.e. replaced meters with readings of less than 1 000 kl resulted in lower payback periods than higher volumetric ranges immediately adjacent. As was explained previously, this is likely attributed to meter clock-overs, where the recorded meter readings were not actual, but rather readings subsequent to the meter registering its maximum value.
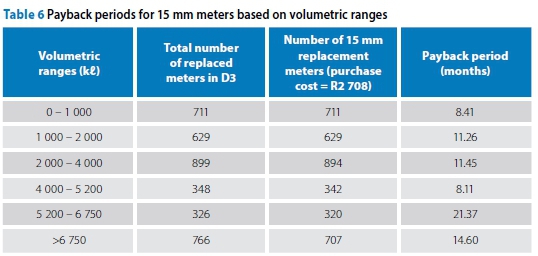
The longest payback period was expected to occur in the higher volumetric regions (volumetric readings >5 200 kl). However, a comparison was done between chronological age and volumetric age, and a large number of the meters which were 10 years and older recorded low volumetric readings (<1 000 kl). This indicates that the chronological age of the meter may be contributing to the increase in total consumption, rather than the volumetric age of the meter. This is contrary to the results of other studies and may be explained by the meter clock-over and should therefore be used with caution.
HIGHLIGHTS AND RECOMMENDATIONS
This paper evaluated a Johannesburg Water (SOC) Limited large-scale meter replacement project that was implemented between 2013 and 2015. While over 50 000 meters were replaced during the two-year project, the final database employed in this study only contained 3 679 validated meter replacements. Some distinct findings and conclusions from this study are noted below and can assist in meter management:
■ While in general the meter replacement project yielded positive benefits in terms of accurate consumption readings, and therefore increased revenue, there is a need for JW, and indeed for all water utilities, to develop or evaluate their metering policies, as there were several meter replacements in this study which resulted in negative revenues. Replacement of meters at the optimum replacement age and/or volumetric reading is beneficial in the long run. Also, the storing of validated meter information (e.g. identity, class, clock-over, installation and/or replacement details) by water utilities enables critical evaluation and research that would produce invaluable strategic and operational information. Unfortunately, due to suspected meter clock-overs, conclusive answers could not be obtained regarding the parameter(s) best suited to determine optimal meter replacement.
■ Calculated revenue due to the replacement of bulk meters (meters larger than 25 mm) was higher, on average, than for residential meters on a single stand. Therefore, bulk meters should be prioritised for meter replacement over single stand residential meters.
■ Meter-sizing impacts the overall performance of the meter. The replacement of 20 mm and 25 mm meters with 15 mm meters in this study, in general, resulted in more accurate metering of consumption by virtue of increased consumption. The better suitability of 15 mm meters for Johannesburg residential stands is confirmed by Ncube and Taigbenu (2019).
■ There was a general increase in revenue from the replacement of older meters. Therefore, by replacing meters of which the ages are close to the determined optimum, higher revenues are envisaged.
■ In general, for 15 mm meter replacement, payback was achieved within 12 months.
ACKNOWLEDGEMENT
The authors are grateful to Johannesburg Water (SOC) Limited for permission to use their data in this study.
REFERENCES
Allender, H D 1996. Determining the economical optimum life of residential water meters. Water Engineering and Management, 143(9): 20-24. [ Links ]
Arregui, F, Cabrera, E, Cobacho, R & García-Serra, J 2006. Reducing apparent losses caused by meters inaccuracies. Water Practice and Technology, 1(4). [ Links ]
Arregui, F, Balaguer, M, Soriano, J & García-Serra, J 2016. Quantifying measuring errors of new residential water meters considering different customer consumption patterns. Urban Water Journal, 13(5): 463-475. [ Links ]
Bhagwan, J, Wegelin, W, Mckenzie, R & Wensley, A 2014. Counting the lost drops: South African's study into non-revenue water. Water Practice and Technology, 9(502): 52-508. [ Links ]
Bold, B 2013. Metering specialist offers local municipalities water loss solution. Engineering News, 8 November 2013. Available at: http://www.engineeringnews.co.za/article/metering-specialist-offers-local-municipalities-water-loss-solution-2013-11-08 (accessed on 27 March 2019). [ Links ]
City of Johannesburg 2018a. Approved tariffs. Available at: https://www.joburg.org.za/documents_/Documents/Other/traffifs/Approved%20tarrifs.compressed.pdf (accessed on 29 September 2019). [ Links ]
City of Johannesburg 2018b. City of Johannesburg Metropolitan Municipality Water Services By-laws. Available at: https://www.joburg.org.za/documents_/By-Laws/Documents/bylaws/water%20services%20bylwas.pdf (accessed on 9 March 2019). [ Links ]
Couvelis, F & Van Zyl, J 2015. Apparent losses due to domestic water meter under-registration in South Africa. Water SA, 41(5): 698-703. [ Links ]
Davis, S 2005. Residential water meter replacement economics. Available at: http://rash.apanela.com/tf/leakage/Residential%20Water%20Meter%20Replacement%20Economics.pdf (accessed on 8 February 2018). [ Links ]
Fantozzi, M 2009. Reduction of customer meters under-registration by optimal economic replacement based on meter accuracy testing programme and unmeasured flow reducers. Proceedings, 5th IWA Water Loss Reduction Specialist Conference, Cape Town, pp 233-239. [ Links ]
Fontanazza, C, Notaro, V, Puleo, V & Freni, G 2015. The apparent losses due to metering errors: A proactive approach to predict losses and schedule maintenance. Urban Water Journal, 12(3): 229-239. [ Links ]
Khan, M Y 1999. Theory and Problems in Financial Management. Boston, MA: McGraw Hill Higher Education. [ Links ]
Masia, O A & Erasmus, L D 2013. Smart metering implementation for enabling water conservation and water demand management: An Investigation in Gauteng, South Africa. Proceedings, AFRICON 2013: IEEE African Conference on Sustainable Engineering for a Better Future, Mauritius, pp 1-5. [ Links ]
McNally P 2008. Water meter and meter reading strategy 2008 recommendation report. Report of the Environment and Transportation Committee 2008. London. [ Links ]
Moahloli, A, Marnewick, A & Pretorius J H C 2019. Domestic water meter optimal replacement period to minimize water revenue loss. Water SA, 45(2): 165-173. Available at: https://doi.org/10.4314/wsa.v45i2.02 (accessed on 21 May 2019). [ Links ]
Mukheibir, P, Stewart R, Giurco, D, O'Halloran, K 2012. Understanding non-registration in domestic water meters: Implications for meter replacement strategies. Water (December): 95-100. [ Links ]
Mutikanga, H 2012. Water loss management: Tools and methods for developing countries. PhD Thesis. Leiden, The Netherlands. [ Links ]
National Treasury (South Africa) 2016. Budget Review 2016. Division of revenue and spending by provinces and municipalities. Chapter 6. Available at: http://www.treasury.gov.za/documents/national%20budget/2016/review/Chapter%206.pdf (accessed on 21 June 2016). [ Links ]
National Treasury (South Africa) 2017. Local government revenue and expenditure: First Quarter Local Government Section 71 report for the period 1 July 2017-30 September 2017. Press Release. Available at: http://www.treasury.gov.za/comm_media/press/2017/2017120801°%20Press%20Statement%20-%201st%20Q%20S71%20Publication%20-%2005%20December%202017.pdf (accessed on 16 May 2018). [ Links ]
Ncube, M 2019. Decision enhancement for the management of apparent water losses. PhD Thesis, Johannesburg, University of the Witwatersrand. [ Links ]
Ncube, M & Taigbenu, A 2015. Meter accuracy degradation and failure probability based on meter tests and meter change data. Proceedings, 4th YWP-ZA Biennial Conference and 1st African YWP (Young Water Professionals) Conference, 16-18 November, Pretoria. [ Links ]
Ncube, M & Taigbenu, A 2019. Assessment of apparent losses due to meter inaccuracy: A comparative approach. Water SA, 45(2): 174-182. [ Links ]
RSA (Republic of South Africa) 1997. Water Services Act, 108 of1997. [ Links ]
Selsky, P 2001. Meter retrofit yields water savings. Journal of the American Water Works Association, 93(3): 36-120. [ Links ]
Shields, D, Barfuss, S & Johnson, M 2012. Revenue recovery through meter replacement. Journal of the American Water Works Association, 104(4): E252-E259. [ Links ]
Stoker, D, Barfuss, S & Johnson, M 2012. Flow measurement accuracies of in-service residential water meters. Journal of the American Water Works Association, 104(12): E637-E642. [ Links ]
Susanville (California) Water Department 2010. Available at: http://susanvillepublicworks.org/files/65865553.pdf (accessed on 15 Jul. 2015). [ Links ]
The Region of Peel (Canada) 2018. Peel's 2018 Water meter replacement program starts today. Available at: http://www.peelregion.ca/news/archiveitem.asp?year=2018&month=3&day=10&file=2018310.xml (accessed on 16 May 2019). [ Links ]
Van Zyl, J 2011. Introduction to integrated water meter management, 1st edition. Report TT 490/11, Water Research Commission, Pretoria. [ Links ]
Viyakesparan, J 2010. Maximizing revenue for meter replacement strategy. Hamilton, New Zealand. Available at: https://www.waternz.org.nz/Attachment?Action=Download&Attachment_id=1778 (accessed on 27 March 2019). [ Links ]
 Correspondence:
Meghan Brinkley
SMEC South Africa (Pty) Ltd
267 Kent Avenue, Ferndale, Johannesburg 2194, South Africa
T: +27 11 369 0647 E: meghan.brinkley@smec.com
Adeshola Ilemobade
School of Civil and Environmental Engineering, University of the Witwatersrand
Private Bag 3, Wits 2050, South Africa
T: +27 11 717 7153 E: adesola.ilemobade@wits.ac.za
Mthokozisi Ncube
Development Bank of Southern Africa
PO Box 1234, Halfway House 1685 South Africa
T: +27 11 313 3287 E: mthokozisin@dbsa.org

MEGHAN BRINKLEY (MSc, PrEng, PMP, MSAICE) currently works for SMEC South Africa (Pty) Ltd and has over 14 years of experience in the Engineering and Project Management fields. She is currently involved with a number of water demand management and water metering projects. In these projects, her focus is on data capturing and project management to ensure accurate records and trend analysis for clients. This article emanated from her MSc research project at the School of Civil and Environmental Engineering, University of the Witwatersrand, Johannesburg.

PROF ADESHOLA ILEMOBADE (PhD, MAP, AMSAICE, MWISA) is currently an Associate Professor at the School of Civil and Environmental Engineering, University of the Witwatersrand, Johannesburg, where he teaches infrastructure planning and water engineering subjects at undergraduate and postgraduate levels. His research interests are in the areas of water reuse, water demand, water conservation and water supply. He has published extensively, received awards for research conducted and supervised, and led several multi-disciplinary research and consulting teams.

DR MTHOKOZISI NCUBE (PhD, PrEng, PMP, CP3P, MSAICE, FWISA) is currently a Water Specialist with the Development Bank of Southern Africa where he advises, consults, and supports the preparation and financing of water and sanitation projects in sub-Saharan Africa. His research interests include water metering, apparent water losses, water demand and data science in water. He has published several articles and actively participates in research and consulting activities.

