


Services on Demand
Article
 English (pdf)
 Article in xml format
 Article references
Indicators

Related links
-
 Cited by Google
 -
 Similars in Google
Share

 Permalink
Journal of the South African Institution of Civil Engineering
On-line version ISSN 2309-8775
Print version ISSN 1021-2019
J. S. Afr. Inst. Civ. Eng. vol.62 n.2 Midrand Jun. 2020
http://dx.doi.org/10.17159/2309-8775/2020/v62n2a3
TECHNICAL PAPER
http://dx.doi.org/10.17159/2309-8775/2020/v62n2a3
The liquefaction potential of the upper quaternary sands of the Cape Flats, Western Cape, South Africa
N Fouché
ABSTRACT
Liquefaction of saturated cohesionless soils as a result of earthquake-induced ground shaking is a major concern for structures constructed within or on these soils. During an earthquake, shear waves propagate through the ground, generating shear stresses and strains that are cyclic in nature, causing the soil grains to rearrange into a denser state of packing. This process is too rapid for drainage to occur, which results in an increase in pore water pressure and a decrease in effective stress and shear resistance of the soil. The occurrence of a seismic event associated with the Milnerton Fault line extending below the Cape Flats, a low-lying sand-covered area connecting the Cape Peninsula with the southwestern Cape mainland of South Africa, can cause extensive damage to the largely inadequate infrastructure characterising the area. To evaluate the susceptibility of Cape Flats sand to undergo liquefaction during and after a seismic event, the empirical SPT-based method put forth by Idriss & Boulanger (2004) was used to assess the cyclic liquefaction potential of dense, dilative sands, whereas the CPT-based method published by Robertson (2016) was used to assess the volumetric response of the sands during undrained shear. Resistance of the Cape Flats sands to liquefy at probable earthquake moment magnitude and acceleration values of M = 6.0 and amax= 0.15 g respectively, was noted. Robertson's normalised Soil Behaviour Type (SBTn) chart revealed mostly dilative sands and silty sands susceptible to cyclic liquefaction. Loose, contractive sands prone to flow liquefaction are present, although limited in occurrence and extent.
Keywords: Cape Flats sand, cyclic liquefaction, flow liquefaction, standard penetration test, cone penetration test
INTRODUCTION
Liquefaction of saturated cohesionless soils as a result of earthquake-induced ground shaking is a major concern for structures constructed within or on these soils. During an earthquake, shear waves propagate through the ground, generating shear stresses and strains that are cyclic in nature, causing the soil grains to rearrange into a denser state of packing. This process is too rapid for the drainage to occur, which results in an increase in pore water pressure and a decrease in effective stress and shear resistance of the soil. The various forms of unstable behaviour of saturated sands during earthquakes are typically all described by the general term liquefaction. However, a distinction needs to be made between the different forms of liquefaction, namely flow liquefaction, cyclic mobility and cyclic liquefaction.
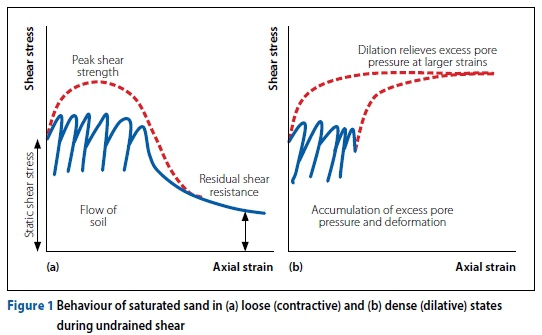
Flow liquefaction describes the undrained flow of saturated, loose contractive sands when the static shear stress surpasses the residual strength of the soil (Rauch 1997). The response of a contractive saturated sand during undrained shear is shown in Figure 1(a). During undrained cyclic shear (with cycles of small shear strains), dense, saturated sands have the tendency to gradually soften as excess pore water pressures are generated. However, when these dense soils are subsequently monotonically loaded without pore water drainage, dilation of the soil occurs as the particles move up and over each other, resulting in a decrease in pore water pressure and an increased shear resistance (Rauch 1997). This behaviour of dense, saturated sands is described as cyclic mobility and is often referred to as limited liquefaction. In addition, Rauch (1997) indicates that a soil which normally tends to dilate during undrained, monotonic shear may temporarily lose its shear resistance when the effective stress becomes zero, thus leading to substantial deformations. This occurrence, described by the term cyclic liquefaction, ensues when cyclic shear stresses become larger than the initial, static shear stress, producing a reversal in the direction of shear stress (stress path passes through a state of zero shear stress). Deformations will, however, stabilise when the cyclic loading ends. The tendency of a dilative soil to produce an increase in shear strength when monotonically sheared, is shown in Figure 1b.
STEADY-STATE CONCEPT
When a soil deforms at a constant volume or void ratio, constant effective stress, constant shear stress or resistance, and constant rate of shear strain, it is said to be in the steady state (Rauch 1997). Steady-state flow can be attained through drained or undrained, and cyclic or monotonic loading. For a specific soil, a plot of possible conditions during steady-state flow gives a single curve (the steady-state line) in the three-dimensional space of void ratio, effective stress and shear stress. When the initial conditions of effective stress and void ratio plot above the steady-state line, the soil is considered contractive, whereas dilative soils will plot below the steady-state line.
SUSCEPTIBILITY OF THE CAPE FLATS SANDS TO LIQUEFACTION
The Cape Flats is a low-lying sand-covered area connecting the Cape Peninsula with the southwestern Cape mainland of South Africa (Hill & Theron 1981). This expansive area of the Cape Town Metropole, covering a surface area of about 630 km2, is home to a substantial portion of the population of the greater Cape Town area. The terrain is flat, densely inhabited and typically characterised by suburban townships and informal settlements. The occurrence of a seismic event, with associated soil liquefaction, can cause extensive damage to the largely inadequate infrastructure, posing a significant risk to residents. The evaluation of liquefaction in the Cape Flats is considered necessary, and an initial assessment of the susceptibility of the upper quaternary sands to liquefaction is given below.
The liquefaction characteristics of a soil are not only affected by the initial density and effective confining stress, but also by factors such as particle cementation, soil fabric and ageing, which will prevent movement and rearrangement of the soil particles and thus increase liquefaction resistance.
Liquefaction is mostly seen in loose, saturated sand and silt deposits that are subjected to strong ground motions induced by earthquakes. Rounded soil particles of uniform gradation are especially prone to liquefaction. It is the more stable interlocking of well-graded sands with angular particle shapes that increases its resistance to liquefaction. Liquefaction is additionally associated with recent deposits in which particle movement is not hindered by age-related cementation. According to Rauch (1997), the presence of large proportions of non-plastic fines in a soil, resulting in lower permeability, will impede drainage of excess pore water pressure, making the soil more likely to liquefy.
The quaternary-aged windblown sands and silty sands of the Witzand and Springfontein Formations of the Cape Flats are typically described as normally consolidated, and fine and medium-grained. The uniform gradation and loose particle packing, without cementation, make these soils prone to liquefaction. In addition, shallow groundwater often occurs widespread across the Cape Flats, especially during the wet winter months, making the sediments susceptible to the accumulation of excess pore water pressures during seismic shearing. Conversely, the consolidated sand of the Langebaan Formation, comprising calcretised layers, will provide significant resistance to grain movement, and thus liquefaction, during shearing.
Although the Western Cape Province of South Africa, and specifically Cape Town, is not located close to a plate boundary, intraplate fault lines present local weaknesses in the earth's crust which are vulnerable to slip in the case of accumulation of sufficient regional tectonic strain. An intraplate fault line known as the Milnerton Fault, extends beneath the Cape Flats in a northwesterly to southeasterly direction. Seismic activity associated with this intraplate fault is considered responsible for the largest earthquake experienced by the City of Cape Town in 1809. During this event, observations of muddy water squirting out of fountains were made, possibly providing evidence of soil liquefaction induced by earthquake vibrations (De la Harpe 2015). In 2003, the Council for Geoscience produced a seismic hazard map showing peak ground accelerations for the whole of South Africa (De la Harpe 2015). According to this map, a gravity acceleration of 0.15 g (1.471 m/s2) - with a 10% probability of exceedance in 50 years - is applicable to the Cape Flats area. The Council for Geoscience additionally produced a seismic intensities map of South Africa showing probabilistic Modified Mercalli Scale (MMS) intensities with a 10% chance of exceedance in 50 years (based on seismological data from 1620 to 1989) (Brandt 2011). Seismic intensity Class VI was assigned to the study area.
EVALUATION OF LIQUEFACTION
When evaluating the susceptibility of a soil to liquefaction, a distinction between cyclic liquefaction, i.e. when deformations occur only during cyclic loading, and liquefaction resulting from strain-softening with a subsequent loss of shear strength, needs to be made.
The triggering of cyclic liquefaction in a given soil deposit is often assessed using empirical methods based on in-situ penetration tests. To develop such an empirical method, sites possibly subjected to earthquake-induced liquefaction in the past are investigated to determine whether liquefaction had occurred, and to measure the in-situ soil strength. The shear stresses induced in the ground by the earthquake are also estimated. By separating conditions where a soil liquefied from those where liquefaction did not occur, a liquefaction assessment criterion is formulated. To evaluate the cyclic liquefaction potential of saturated cohesionless soils during earthquakes, standard penetration test (SPT)-based correlations are the oldest and most widely used methods. Notwithstanding this, the cone penetration test has become increasingly popular in estimating cyclic liquefaction potential.
To estimate the potential for cyclic liquefaction for level ground sites due to an earthquake, the cyclic stress ratio (CSR) profile produced by the design earthquake, demonstrating the seismic demand of a soil layer, and the cyclic resistance ratio (CRR) of the ground, which provides a measure of the soils' resistance to liquefaction, should be known. The CSR is calculated from the maximum horizontal surface acceleration (amax) produced by the earthquake, whereas the CRR depends upon penetration resistance data. When the CRR exceeds the CSR induced by the earthquake ground motions, the soil is considered resistant to cyclic liquefaction. Most empirical liquefaction assessment methods are based on the cyclic resistance ratio and a standardised SPT blow count.
One of the most widely used SPT-based correlations is the deterministic relationship presented by Seed et al (1984 & 1985 - cited in Idriss & Boulanger 2004). This familiar method has been the standard for many years, with only minor modification at low CSR suggested by the National Center for Earthquake Engineering Research (NCEER) Working Group (NCEER 1997). Since the publication of this earlier method, SPT-based correlations have been put forth by numerous authors, including Liao et al (1988; 1998), Youd and Noble (1997), and Toprak et al (1999) - all cited in Seed et al (2003). Seed et al (2003), however, emphasised low data quality and overall uncertainty related to these methods. More recently, Cetin et al (2004), and Idriss and Boulanger (2004) put forth similar relationships between CRR and equivalent clean sand corrected SPT blow count, (N1)60cs. The three liquefaction triggering correlations are compared in Figure 2.
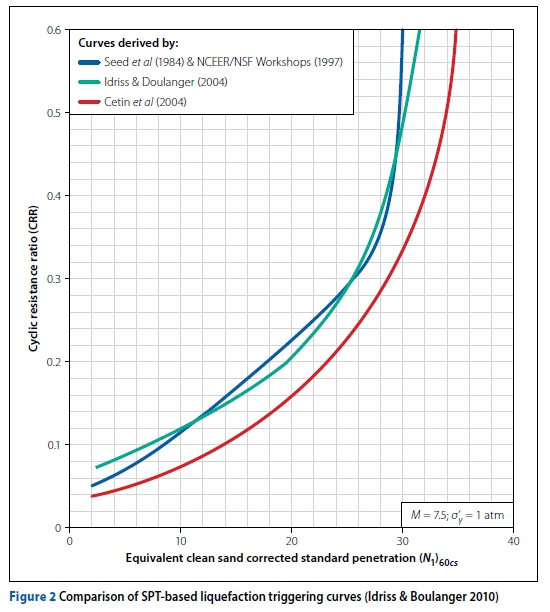
A review of SPT-based liquefaction triggering procedures for cohesionless soils was undertaken by Idriss and Boulanger (2010) whereby the database of case histories was re-examined and updated. During the review it was found that the lower position of the Cetin et al (2004) curve was mainly due to their interpretations of several important case histories at a specific range of effective stresses. In their report, Idriss and Boulanger (2010) concluded that the modified Seed et al (1984), and Idriss and Boulanger (2004) procedures are realistic for depths less than 12 m, and that the Idriss-Boulanger method is well supported by existing data for extrapolation to even greater depths. The Idriss-Boulanger (2004) method is therefore considered superior and was, for this reason, selected for the current study.
To evaluate susceptibility to flow liquefaction, i.e. liquefaction due to strain-softening with a resulting loss of shear strength, the potential for a soil to strain-soften in undrained shear should be evaluated. According to Robertson (2010), experience has indicated that loose sands are prone to abrupt strength loss at small shear strains and, as such, the identification of very loose and loose coarse-grained soils is considered the key component to identify a soil susceptible to flow liquefaction. Robertson (2016) created a CPT-based normalised Soil Behaviour Type (SBTn) chart (plotting normalised cone resistance Qtnagainst normalised friction ratio Fr) whereby an approximate boundary between dilative and contractive soil response is given. This boundary, presented by the solid line marked "CD" in Figure 3, separates dense, dilative soils in which deformations occur only during cyclic loading (plotting above line CD) from loose, contractive soils prone to flow liquefaction (plotting below line CD).
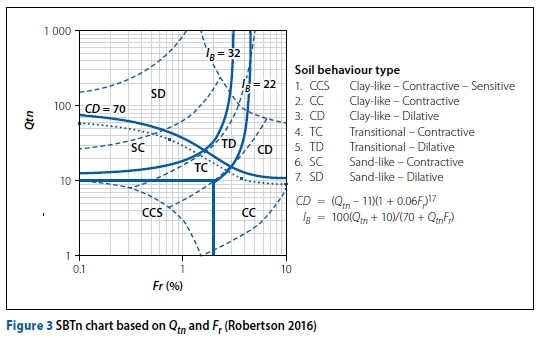
Figure 3 serves as the latest CPT-based SBT classification method following the original SBT chart developed by Robertson in 1990, and later updated by Robertson and Wride (1998), Robertson (1999) and Zhang et al (2002) - all cited in Robertson (2010) - to enable flow liquefaction evaluation. To assess the potential of a soil to strain-soften in undrained shear, Robertson's SBT chart method to distinguish dilative and contractive soils, is considered state-of-the art and was, for this reason, selected by the author to assess the static liquefaction potential of the Cape Flats sands.
According to Robertson (2016), the CPT-based boundary between contractive and dilative soils can be influenced by several variables, such as in-situ stress state and, based on case histories by Robertson (2010), this boundary is considered slightly conservative. As a result, a transitional zone on the SBTn chart is recommended. In this regard, Robertson (2016) suggests an approximate lower boundary based on these case histories, as shown in Figure 3. The suggested boundary line marked "CD" now represents the upper boundary.
METHODOLOGY
The susceptibility of Cape Flats soil to undergo cyclic liquefaction, in which deformations occur only during cyclic loading, and flow liquefaction, in which there is a complete loss of shear strength (soil failure) due to pore pressure increase during cyclic loading, was estimated by the following two approaches:
■ Evaluation of the cyclic liquefaction potential of dense, dilative sands by means of an empirical SPT-based method put forth by Idriss & Boulanger (2004).
■ Evaluating the volumetric response of the Cape Flats sands during shear by means of the CPT-based method published by Robertson (2016), to determine whether flow liquefaction can occur (identification of loose, contractive soils).
SPT-based method for cyclic liquefaction
The cyclic liquefaction potential of the Cape Flats sands was studied in terms of the triggering of liquefaction. The semi-empirical SPT-based procedure proposed by Idriss and Boulanger (2004) was applied to SPT blow count data from 178 boreholes spread across the Cape Flats. The Idriss and Boulanger (2004) boundary curve was expressed using Equations 1 to 3.
All the measured SPT N blow count values (considered N60 values in the current study) were first corrected for overburden stress at the test depths to give the (N1)60values. The clean sand equivalent values of (N1)60were then calculated as follows (Idriss and Boulanger 2004):

Where:
FC = fines content (percentage smaller than 0.075 mm)
Where grading results were available at the SPT depths, the calculated fines contents were inserted into Equation 2. Where the actual fines content at an SPT depth was unknown, an average fines content value of 6.3%, calculated for the sands of the Cape Flats, based on the results of 349 particle size analyses, was applied to Equation 2.
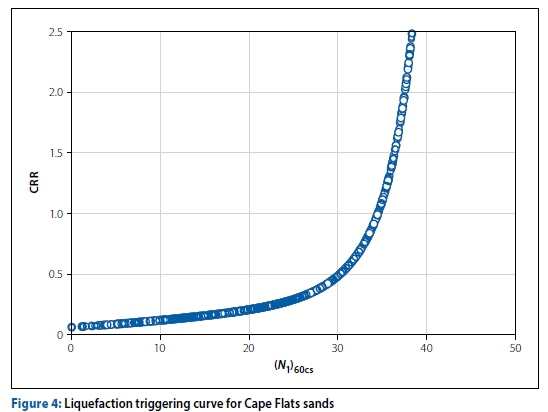
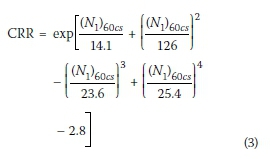
The cyclic resistance ratio (CRR) was subsequently calculated at each of the SPT depths from the clean sand equivalent (N1)60values for a magnitude M = 7.5 earthquake and an effective vertical stress of 1 atmosphere (101.3 kPa), using Equation 3. A total of 1 526 CRR (N1)60csdata pairs were produced from the SPT data. These data pairs are shown graphically in Figure 4, revealing the Idriss and Boulanger liquefaction triggering curve.
To finally separate the liquefiable and non-liquefiable soils, the cyclic stress ratios induced by a design earthquake were calculated at the SPT depths as follows (Seed & Idriss 1971 - cited in Idriss & Boulanger 2004):
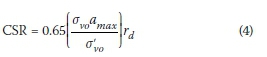
Where:
■ σ'voand σvorepresent the effective and the total vertical stresses respectively. The depth of the groundwater table was assumed at 3.0 m in cases where the actual position of the phreatic surface was unknown at an SPT location. This is deemed realistic for the study area.
■ amax = maximum horizontal acceleration at the ground surface. This value was taken as 0.15 g (1.471 m/s2) for the Cape Flats area, representing the probabilistic peak horizontal ground acceleration for the area with 10% chance of exceedance in 50 years (SANS 2010).
■ rd= stress reduction coefficient accounting for the flexibility of the soil column, and obtained as follows:
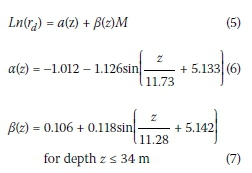
Where: M = design earthquake moment magnitude = 6.0
The earthquake moment magnitude and the local Richter scale magnitude are, for all practical purposes, considered equal. The Richter scale magnitude was acquired from the Modified Mercalli Scale (MMS) intensity which was, in turn, obtained from a seismic intensities map of South Africa showing probabilistic MMS intensities with a 10% chance of exceedance in 50 years (Brandt 2011; De la Harpe 2015).
The CSR requires adjustment for the equivalent number of stress cycles in different magnitude earthquakes. The CSR induced by an earthquake with magnitude M is routinely adjusted to an equivalent CSR for an earthquake magnitude equal to 7.5 (Idriss & Boulanger 2004) as follows:
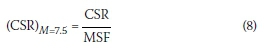
Where:
MSF = magnitude scaling factor, given by:
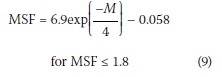
M = earthquake moment magnitude = 6.0, obtained as described above.
The cyclic stress ratios, calculated at each of the SPT depths in the manner described above, were subsequently plotted against the clean sand equivalent (A1)60values on the liquefaction triggering curve (Figure 4).
A total of 1 526 CSR (N1)60csdata pairs were included to reveal the liquefaction potential of the Cape Flats sands.
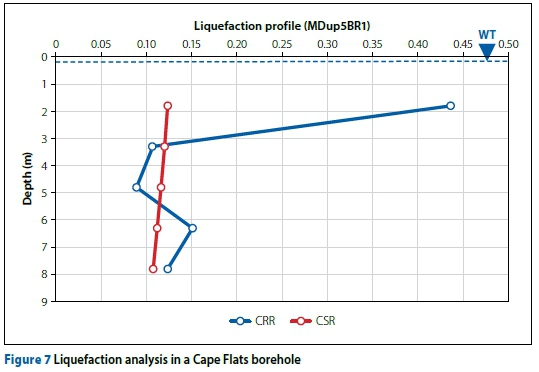
To illustrate the occurrence and thicknesses of liquefiable soil layers, the CRR and CSR values were plotted relative to the SPT depths (with linear interpolation between points), providing continuous profiles of the factor of safety against liquefaction. Liquefaction can only occur below the water table and, as such, the indicated liquefiable zones may vary based on the depth of groundwater.
To illustrate the effects of a larger magnitude earthquake producing higher PGAs on the triggering of cyclic liquefaction in the study area, a design earthquake with moment magnitude M = 7.5 and amax= 0.25 was applied in the calculation of the cyclic stress ratio.
CPT-based method for flow liquefaction
To evaluate the susceptibility of the Cape Flats sands to flow liquefaction, the potential for these soils to strain-soften in undrained shear was evaluated. The results from four
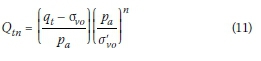
piezocone penetrometer tests undertaken at two locations in the study area were applied to the CPT-based method proposed by Robertson (2016). The CPT parameters of normalised cone resistance Qtnand normalised friction ratio Frwere calculated from the raw CPT parameters of cone tip resistance qc, sleeve frictionfs, and pore water pressure u, continuously recorded from surface to between 9.1 m and 10.98 m depth, using the following equations (Robertson 2010):
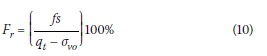
Where:
qt= cone tip resistance corrected for pore pressure
Where:
pa= atmospheric pressure (101.3 kPa) converted to same units as qt and σv
n = stress exponent varying with soil type, defined as:
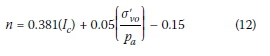
Where:
Ic= soil behaviour type index, defined as:
To obtain the value of n an iterative process involving Equations 11 to 13 was followed.
The depth of the water table at each of the four CPT localities - required for the calculation of the total vertical stress - was calculated from pore water pressure dissipation test results.
The normalised cone resistance and friction ratio values obtained with depth at the four piezocone penetrometer test positions in the manner described, were plotted on the SBTn chart shown in Figure 3 using the CPeT-IT software developed by GeoLogismiki for interpreting CPTu data.
By plotting the normalised parameters on Figure 3, the depths and thicknesses of dilative and contractive soil zones in the profiles are not discernible. For this reason, a contractive-dilative (CD) value was calculated using Equation 14 and plotted against depth to illustrate the volumetric behaviour during shear. When the value of CD exceeds 70, the soils are expected to be dilative at large shear strains, whereas CD values below 60 represent contractive soils. A transitional zone exists between CD values of 60 and 70, which was inserted on the graphs.
RESULTS AND ANALYSIS
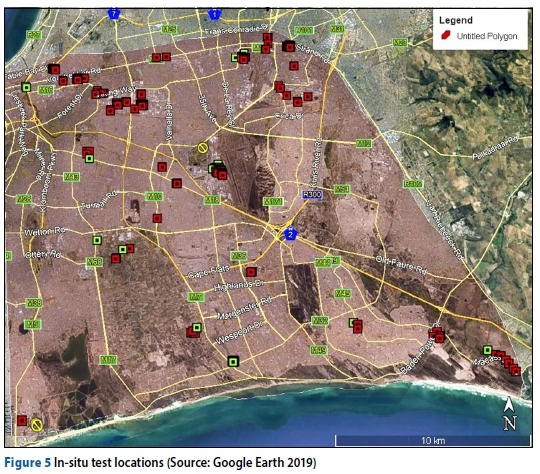
The in-situ test locations are shown on the Google Earth image in Figure 5, showcasing the distribution of the tests and liquefiable soils. It should be noted that, due to the large geographical area shown in the image, test locations near one another plot in an overlapping manner, not clearly showing all the test locations. A total of 182 in-situ test locations, including CPTu's and boreholes with SPTs, were plotted on the Google Earth image. Final standard penetration test depths in the boreholes range between 1.95 m and 42.25 m below ground level (average final test depth of 11.23 m). The four piezocone penetrometer tests were advanced to between 9.5 m and 11 m below ground level. The depth to the water table in the study area, as recorded in the boreholes and from pore water pressure dissipation tests, varied between ground surface level and 6.0 m below ground level (average water table depth of 2.3 m).
Cyclic liquefaction potential
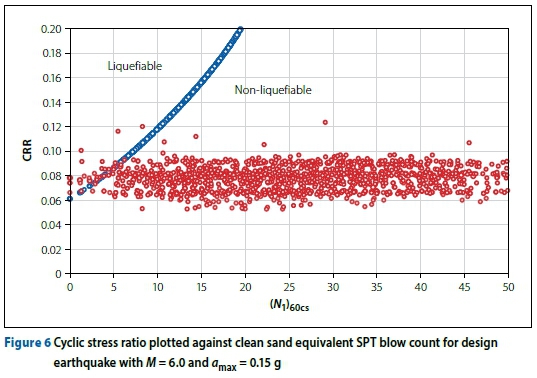
The liquefaction triggering curve with CSR-(N1)60csdata points calculated for a design earthquake with moment magnitude of 6.0 and a PGA of 0.15 g is shown in Figure 6. The liquefiable and non-liquefiable soils are separated, illustrating that the CRR mostly exceeds the CSR, thus providing a factor of safety greater than 1. Of the 1 526 data pairs obtained from 178 boreholes plotted in the figure, only 19 pairs from 14 boreholes showed the potential to liquefy during an earthquake with the above-mentioned magnitude and acceleration (refer to Figure 5). It should be noted that, in calculating the CRR and CSR values, the water table levels at the time of each specific ground investigation were used (investigations undertaken over a period of approximately 30 years). Liquefaction can only occur in saturated soils and, as such, the outcome presented in Figure 6 may vary depending upon the depth of the phreatic surface.
The potential of the Cape Flats soils to liquefy under static conditions at the SPT locations shown in Figure 5 could not be determined, due to the lack of an appropriate SPT-based flow liquefaction method.
To illustrate the occurrence and thicknesses of liquefiable soil layers in the 14 boreholes which showed a likelihood to liquefy, the CRR and CSR values were plotted relative to the SPT depths (with linear interpolation between points). A continuous profile of the factor of safety against liquefaction is shown in Figure 7 for one such borehole. At this position, liquefiable soil occurs between approximately 3 m and 5 m depths. In most cases, only a single CSR value calculated at an individual SPT depth in the soil profile (borehole location) was higher than its corresponding CRR value. Interpolation between SPT depths hinders exact definition of liquefiable soil layers. Liquefiable soils occur between upper and lower depth limits of 3.2 m and 19 m respectively, with layer thicknesses varying from 0.3 m to about 2.0 m. Rauch (1997), however, notes that liquefaction is unlikely at depths exceeding 15 m where confining stresses are large and frictional resistance is likely to prevent liquefaction. Liquefiable soils were identified as fine to coarse-grained sands and silty sands in boreholes in Athlone, Philippi, Khayelitsha, Macassar, and in the vicinities of the Cape Town International Airport in Matroosfontein and the Tygerberg Hospital in Bellville. Liquefiable layers were not intersected at comparable elevations across different sites in the study area.
To illustrate the effects of a larger magnitude earthquake producing higher PGAs, on the triggering of cyclic liquefaction in the study area, the liquefaction triggering curve with CSR-(N1)60CSdata points was generated for a design earthquake with moment magnitude of 7.5 and a PGA of 0.25 g, as shown in Figure 8.
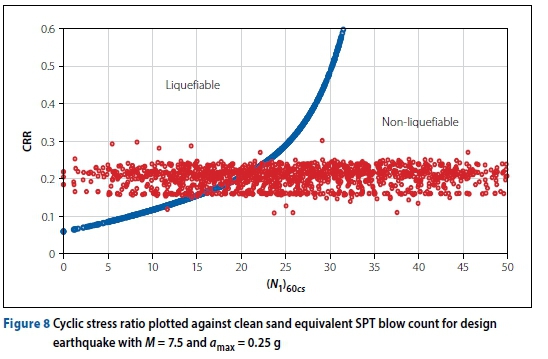
A substantial decrease in liquefaction resistance is associated with the above-mentioned design earthquake, with safety factors at about 35% of SPT locations being less than 1 (CSR > CRR). The possibility of such an occurrence (large seismic event) is, however, improbable considering the seismic hazard maps produced for southern Africa (Brandt 2011; De la Harpe 2015).
Flow liquefaction potential
Robertson's normalised Soil Behaviour Type (SBTn) chart (including contractive-dilative boundary) with Qtn-Frdata points calculated from the field data of four piezocone penetrometer tests (CPTu) undertaken at two locations in the Cape Flats, are shown in Figure 9 (also refer to Figure 5). Figures 9(a) and 9(b) depict the results from Site A: Southwest Cape Flats, and Figures 9(c) and 9(d) from Site B: Northeast Cape Flats. Both localities are underlain by Witsand Formation deposits, although Site B is situated near the Springfontein Formation soil boundary. The soil behaviour types were determined as sand, silty sand and sandy silt with irregular layers of clay and silty clay underlying Site B.
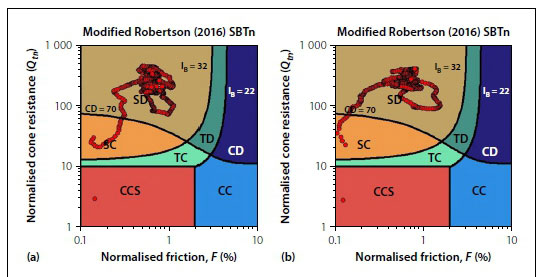
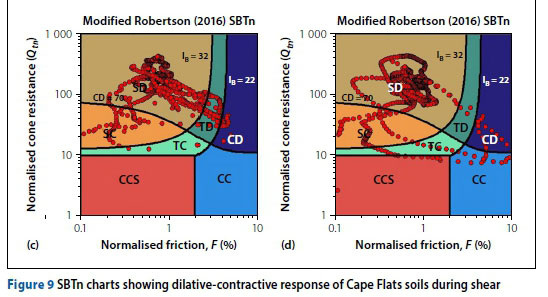
From the SBTn charts it is evident that the sands and silty sands from the Cape Flats mostly dilate during undrained shear. The soils plotting above the contractive-dilative (CD) boundary may be susceptible to cyclic liquefaction, thus substantial
deformations can occur during cyclic loading when a brief loss in shear resistance occurs when the effective stress becomes zero. Deformations will, however, stabilise when the cyclic loading ends.
Loose, contractive sands, in which Qtn-Frdata pairs plot below the CD boundary, are also present at all four locations. A limited number of data points plot within the transitional or clay-like zones (some of which display contractive behaviour). To enable proper interpretation of the results, revealing depths and thicknesses of dilative and contractive soil zones, the contractive-dilative (CD) values were plotted against depth for each of the CPTu's. A typical graph for one CPTu position is shown in Figure 10. Note that the contractive-dilative boundary is transitional, the upper and lower boundaries of this zone being represented by the grey and orange vertical lines respectively.
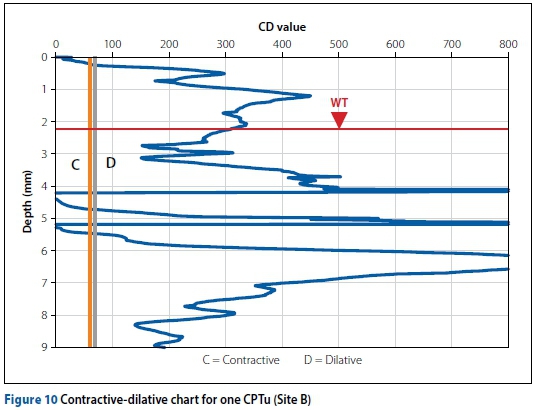
Examination of the four graphs confirms the presence of contractive soils at shallow depths (extending to a maximum depth of 0.6 m), and at depths between 4 m and 5.5 m at the Site B CPTu locations. At between 4 m and 5.5 m depth, liquefiable layers vary in thickness from 0.1 m to 0.5 m. At these depths in the soil profiles, a complete loss of strength leading to flow (under static shear stress exceeding the residual shear strength) can occur during a seismic event. The water table was recorded between 2.45 m and 2.9 m depth in the four CPTu's. It is the build-up of pore water pressure during dynamic loading that leads to strength loss and, as such, flow liquefaction is only likely to occur in the saturated sands below the water table.
CONCLUSIONS
To evaluate the susceptibility of Cape Flats soil to undergo liquefaction during and after a seismic event, the empirical SPT-based method put forth by Idriss and Boulanger (2004) was used to assess the cyclic liquefaction potential of dense, dilative sands, while the CPT-based method published by Robertson (2016) was used to assess the volumetric response of the sands during shear.
The liquefaction triggering curve with CSR-(N1)60CSdata points obtained for a design earthquake with moment magnitude of 6.0 and a PGA of 0.15 g, illustrated the resistance of the Cape Flats sands to liquefy at these probable magnitude and acceleration values (obtained from the seismic hazard map of southern Africa: Brandt 2011). Of the 1 526 data pairs obtained from 178 boreholes, only 19 pairs from 14 boreholes showed the potential to liquefy. Liquefied thicknesses in these boreholes ranged from 0.3 m to about 2.0 m, occurring between depths of 3.2 m and 19 m in the soil profile.
A substantial decrease in liquefaction resistance was observed when the liquefaction triggering curve with CSR-(N1)60cs data points was generated for a design earthquake with moment magnitude of 7.5 and a PGA of 0.25 g. Approximately 35% of the data points plotted above the triggering curve, illustrating the effects of a large ground shaking event on the triggering of liquefaction in the Cape Flats. The possibility of such an occurrence (large seismic event) is deemed unlikely.
The water table levels encountered in the boreholes at the time of each specific ground investigation were used to calculate the values of CSR and CRR. Liquefaction can only occur in saturated soils and, as such, the outcomes presented on the liquefaction triggering curves may vary depending on the depth of the phreatic surface.
Robertson's normalised Soil Behaviour Type (SBTn) chart (including contractive-dilative boundary) revealed mostly dilative sands and silty sands possibly susceptible to cyclic liquefaction at the four CPTu locations. Loose, contractive sands are also present at all four locations, occurring at shallow depths, and between 4 m and 5 m at two CPTu locations. A limited number of data points plot within the transitional or clay-like zones.
These strain-softening soils (prone to strength loss) can also experience cyclic liquefaction depending on ground geometry (Robertson & Cabal 2012). However, the author was unable to assess and compare liquefaction under static and dynamic conditions for the same materials, as there were no sites with both CPT and SPT data available.
In conclusion, it is difficult to assess the risk of earthquake occurrence and magnitude in the study area. Nonetheless, the occurrence of such an event will certainly result in cyclic liquefaction in the Cape Flats area, the extent of which will depend on the magnitude of the seismic event. The limited assessment of static liquefaction in the study area inhibits a true reflection of the volumetric response of sand and claylike soils from the Cape Flats during static or cyclic loading.
ACKNOWLEDGEMENTS
The piezocone penetrometer testing was made possible by Prof Peter Day and Jones & Wagener (Pty) Ltd. Thank you for investing in this liquefaction study. I also thank the following companies for making historic SPT records available for research: Kantey & Templer (Pty) Ltd, Melis & Du Plessis Consulting Engineers (Pty) Ltd, Core Geotechnical Consultants, Fairbrother Geotechnical Engineering, and the Council for Geoscience (Bellville Office).
REFERENCES
Brandt, M 2011. Seismic hazard in South Africa. Council for Geoscience Report 2011-0061. Pretoria: Council for Geoscience. [ Links ]
Cetin, K O, Seed, R B, Der Kiureghian, A, et al 2004. Standard penetration test-based probabilistic and deterministic assessment of seismic soil liquefaction potential. Journal of Geotechnical and GeoenvironmentalEngineering, ASCE, 130(12): 1314-340. [ Links ]
De la Harpe, C W H 2015. The development of a seismic risk reduction procedure for the prioritization of low-cost, load-bearing masonry buildings. MSc Dissertation. Stellenbosch University. [ Links ]
Hill, R S & Theron, J N 1981. Silica sand of the Cape Flats. Bulletin Vol 69. Pretoria: Geological Survey of South Africa. [ Links ]
Idriss, J M & Boulanger, R W 2004. State normalization of penetration resistances and the effect of overburden stress on liquefaction resistance. Proceedings, 11th International Conference on Soil Dynamics and Earthquake Engineering and 3rd International Conference on Earthquake Geotechnical Engineering, Berkeley, California, pp 22-56. [ Links ]
Idriss, J M & Boulanger, RW 2010. SPT-based liquefaction triggering procedures. University of California, Department of Civil Construction and Environmental Engineering, Center for Geotechnical Modeling. [ Links ]
NCEER (National Center for Earthquake Engineering Research) 1997. In Youd, T L & Idriss, I M (Eds). Proceedings, NCEER Workshop on Evaluation of Liquefaction Resistance of Soils.Technical Report NCEER-97-02. New York: NCEER. [ Links ]
Rauch, A F 1997. EPOLLS. An empirical method for predicting surface displacements due to liquefaction-induced lateral spreading in earthquakes. PhD Thesis. Blacksburg, VA: Virginia Polytechnic Institute and State University. [ Links ]
Robertson, P K 2010. Evaluation of flow liquefaction and liquefied strength using the cone penetration test. Journal of Geotechnical and Geoenvironmental Engineering, 136(6): 842-853. [ Links ]
Robertson, P K & Cabal, K L 2012. Guide to Cone Penetration Testing for Geotechnical Engineering, 5th ed. Signal Hill, CA: Gregg Drilling and Testing, Inc. [ Links ]
Robertson, P K 2016. Cone penetration test (CPT)-based soil behaviour type (SBT) classification system - An update. Canadian Geotechnical Journal, 53: 1910-1927. [ Links ]
SANS (South African National Standard) 2010. SANS 10160-4: Basis of Structural Design and Actions for Buildings and Industrial Structures. Part 4: Seismic Actions and General Requirements for Buildings. Pretoria: SABS Standards Division. [ Links ]
Seed, R B, Cetin, K O, Moss, R E S et al 2003. Recent advances in soil liquefaction engineering: A unified and consistent framework. Report No. EERC 2003-06. Oakland, CA: Earthquake Engineering Research Center. [ Links ]
 Correspondence:
Nanine Fouché
Department of Civil Engineering
Stellenbosch University
Private Bag X1
Matieland 7602
South Africa
T: +27 21 808 3816; E: naninef@sun.ac.za

Nanine Fouché graduated in 2008 with a Bachelor's degree in Earth Science from Stellenbosch University. Thereafter she continued her studies and completed a Post-Grad uate Diploma and MSc Eng in Geotechnical Engineering. She gained valuable experience as an engineering geologist at Aurecon South Africa, undertaking geotechnical and foundation investigations for a wide range of projects. Her passion for teaching and the academics led her to a career in teaching and research in the Civil Engineering Department at Stellenbosch University. She currently teaches geotechnical engineering courses and provides support to geotechnical research students, while also completing her PhD.

