


Serviços Personalizados
Artigo
 Inglês (pdf)
 Artigo em XML
 Referências do artigo
Indicadores

Links relacionados
-
 Citado por Google
 -
 Similares em Google
Compartilhar

 Permalink
Journal of the South African Institution of Civil Engineering
versão On-line ISSN 2309-8775
versão impressa ISSN 1021-2019
J. S. Afr. Inst. Civ. Eng. vol.62 no.2 Midrand Jun. 2020
http://dx.doi.org/10.17159/2309-8775/2020/v62n2a2
TECHNICAL PAPER
http://dx.doi.org/10.17159/2309-8775/2020/v62n2a2
Laboratory and field investigations in granular soils to correlate relative density, relative compaction and grain size
H Mujtaba; K Farooq; N Sivakugan; B M Das
ABSTRACT
An attempt has been made to correlate relative density and relative compaction based on laboratory and field test data. In this investigation, 185 sandy soil samples were tested in the laboratory. The experimental investigations include classification tests, maximum and minimum density tests, and standard and modified Proctor and in-situ density tests. The values of the dry unit weight of these samples obtained by performing different tests fall between 14.7 kN/m3 and 20.8 kN/m3. Based on these results, linear and multivariate regression analyses were carried out to (a) relate relative compaction and relative density, (b) relate maximum (emax) and minimum void ratios (emin), and (c) express emax and emin in terms of median grain size (D50) and uniformity coefficient (Cu). Experimental and predicted values varied ± 5%, with a 95% confidence interval for the relation between relative compaction and relative density, and for other relations the variation was ± 10%. The proposed equations were validated using a new data set which had not been used for the development of the correlations. Proposed equations were also compared with equations presented by various other researchers. Validation of the proposed equations suggests that these equations may be used for future prediction of the respective variables.
Keywords: relative density, relative compaction, void ratio, uniformity coefficient, curvature coefficient, effective grain size, median grain size
INTRODUCTION
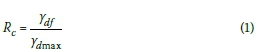
Field compaction is an integral part of every civil engineering construction in general and for the construction of earth structures in particular. Relative compaction and relative density are two parameters which can be used alternately when writing technical specifications for field compaction control. In order to ascertain the degree of compaction in the field, usually relative compaction (Rc) is determined. The concept of relative density (Dr) has been found to be a more convenient basis for correlating many granular soil properties, such as shear strength, compressibility and liquefaction potential of saturated sands (Lee & Singh 1971). Relative compaction is defined as the ratio between the dry unit weight in the field (ydj) and the maximum dry unit weight (Ydmax) that can be obtained in the laboratory for a soil following a specified compaction procedure, and is mathematically given by Equation 1.
Relative density (Dr) represents the degree of compaction of soil with respect to the most dense and loosest states as measured in the laboratory. Dras defined by the American Society for Testing and Materials (ASTM 2007), is evaluated by Equation 2.
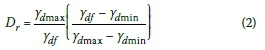
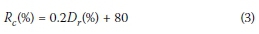
Where:Ydmaxand Ydminare determined through laboratory tests (ASTM D-4253 and ASTM D-4254 respectively) and ydf are applicable to granular soils having fines up to 15%, and is the dry unit weight of the compacted soil in the field. However, Lee and Singh (1971) defined maximum dry unit weight (Ydmax) as the dry unit weight of the material when arranged in the most compact state possible by any practical engineering methods without significantly altering the grain size distribution, and minimum dry unit weight (Ydmin) as the unit weight of the material when arranged in the loosest state possible by any practical engineering methods without the use of natural or artificial methods to increase the adhesion between particles and lead to bulking. Based on these definitions, they assumed that the values Ydmax in Equations 1 and 2 are the same for a granular soil irrespective of the test method being adopted to determine Ydmax. They also proposed a correlation between relative density and relative compaction for granular soils varying from silty sand to coarse gravels as given in Equation 3.
Both relative density and relative compaction theoretically range from 0% to 100%. Zero percent relative compaction refers to zero dry density, which is physically meaningless. Zero percent relative density refers to a real and substantial value of dry unit weight. Thus, the term relative density covers a narrower range of possible numerical values than relative compaction, and is therefore considerably more sensitive to small changes in actual dry densities. Relative compaction is an indicator whether the required degree of field compaction has been achieved or not, as per project specifications. The concept of relative compaction is applicable to both cohesive and non-cohesive soil, while relative density (Dr) is more appropriate for end-product compaction specification for granular soils. Tavenas and Rochelle (1972) suggested that it is difficult to ensure that maximum and minimum dry unit weights (determined by experiments) correspond effectively to the maximum and minimum possible state of compactness of the material considered. If Dr is negative, a collapsible structure may be present, such as can occur with honeycombed soils or loose cemented or calcareous sand where in-situ dry unit weight is smaller than the minimum dry unit weight of the soil encountered (Kulhawy & Mayne 1990).
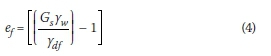
The determination of in-situ void ratio of sandy soils is very difficult, because to obtain undisturbed samples in sandy soils using conventional methods is not possible. Equation 4 can be used to estimate the in-situ void ratio from the results of relative compaction.
Sand has particles varying in size between 4.75 mm to 0.075 mm (ASTM D 2487). The behaviour of sandy soils depends largely on grain size distribution, grain shape, angularity, mineralogy, relative density, mode of deposition and current state of the deposit in which it is present. Cubrinovski and Ishihara (2002) observed that the generalised charts which are used to estimate the response of sandy soils based on material parameters use either fine content (percentage finer than 0.075 mm, ASTM D 2487) present in the sample and/ or median grain size (D50). In these charts, sand with the same amount of fines has been assumed to have similar response to any loading condition, but practically it is not true, as response depends mainly upon grain size distribution, shape, mineralogi-cal composition, etc. However, they showed that void ratio range (emax - emin) may be a better parameter than considering fines, uniformity coefficient, curvature coefficient, etc. The Japanese Geotechnical Society (JGS 2000) procedure can be employed to determine the void ratios for clean sands having less than 5% fines. However, Cubrinovski and Ishihara (2002) revealed that the JGS procedure can be applied to material having fines up to 30%. Lade ei al (1998) summarised the studies of Graton and Fraser (1935), White and Walton (1937) and McGeary (1961), and presented five possible modes of packing single-size spherical particles, along with the void ratio for each type of packing. They concluded that maximum and minimum void ratios are independent of the size of the sphere. Lade ei al (1998) studied the behaviour of poorly graded Cambria sand mixed with non-plastic Nevada fines. They concluded that both emaxand emin decrease as the fines increase from 0% to 20%. Within the range of 20% to 40% fines, the relationships show a shift in pattern indicating a transition from the filling of voids to the replacement of solids. After 40%, the void ratio values tend to increase steadily until they reach the highest value at 100% fines. It should be mentioned that the variation of eminwith fines closely resembles that of the packing of spheres. The reason for this similarity is that a sample consisting of a mixture of sand and fines, and a sample consisting of spheres having large and small diameters are both gap-graded. Cubrinovski and Ishihara (2002) studied the link between void ratio range and fines content. As far as clean sand, or sand with fines, is concerned, there is an increase in void ratio range as fines increase from 0% to 30%. However, after 30% fines, there is a change of pattern in the relationship between the void ratio range (emax- emin) and the fines (Fc). For Fc< 30%,
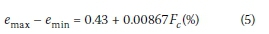
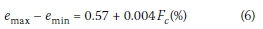
Equation 5 applies to situations where any addition of fines fills the voids. If Fc< 30%, addition of fines leads to replacement of larger particles. Here,
The reasons for the change in the behaviour of sand with 30% fines, compared to sand having 0% to 20% fines, is that, for sands having 30% fines, the fines are controlling the grain fraction in the soil structure, whereas for sands having 0% to 20% fines, the packing is controlled by sand grains. However, the role of fines in the very dense packing state is different from the role of fines in the loosest state of packing.
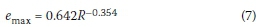
Youd (1973) presented a relationship for emaxand emin as a function of roundness (R), i.e. shape of the particle and uniformity coefficient (Cu). Roundness (R) is the ratio of the average radius of the corners and edges to the radius of the maximum inscribed sphere. These relations are valid for normal to moderately skewed grain size distribution curves. Shimobe and Moreto (1995) determined the variation of emax with (R) for 40 uniform clean sands having a uniformity coefficient less than or equal to 2 (Cu< 2). The experimental range of emaxwith R is given by Equation 7.
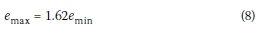
Miura et al (1997) carried out research on the physical characteristics of about 200 samples of granular materials, which included clean sand, glass beads and lightweight aggregates. Based on the data available, linear regression analysis was carried out and the following equation (Equation 8) was proposed:
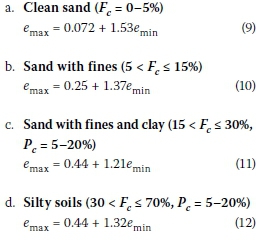
Cubrinovski and Ishihara (2002) collected data consisting of over 300 sandy soil samples including clean sand, clean sand with fines, and silty sands, and divided them based on the amount of fines (Fc) and clay size content (Pc). Fcrepresents grain sizes smaller than 0.075 mm, whereas Pc is the percentage of grains smaller than 0.005 mm. To investigate the effect of fines on emax and emin, regression analysis was carried out on all four groups and equations, i.e. Equations 9 to 12 (one for each group). The strength of relationship between the two variables is specified statistically by the correlation coefficient (r), and its value is .97, .94, .96 and .90 for Equations 9 to 12, respectively.
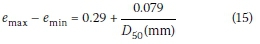
Cubrinovski and Ishihara (2002; 1999), based on a large database, developed a unique relationship between void ratio range (emax - emin) and mean grain size (D50). This relationship is given by Equation 13 as:
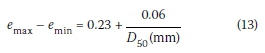
They also proposed the upper and lower limits of (emax - emin) as a function of D50which can be approximated by Equations 14 and 15, respectively.
Upper limit:
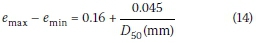
Lower limit:
Patra et al (2010) conducted Proctor compaction tests (standard, modified Proctor following ASTM D 698 and ASTM D 1557 along with reduced standard, reduced modified compaction tests by altering the number of blows per layer using the relevant Proctor hammer) on 55 clean sand samples - most of which were poorly graded. They also determined emax and emin based on ASTM procedures. Compaction tests including standard Proctor (compaction energy = 600 kN-m/m3), reduced Proctor (compaction energy = 360 kN-m/m3), modified Proctor (compaction energy = 2 700 kN-m/m3) and reduced modified Proctor (compaction energy = 1 300 kN m/m3) were also carried out on these samples. Based on the laboratory tests, emax eminand void ratio at maximum dry unit weight determined through respective compaction tests, as mentioned above, are expressed as a function of D50 in Equations 16 to 21. Correlation coefficients of these equations are .87 ~ .92.
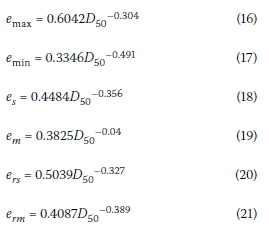
Where: D50is in mm, es= void ratio at maximum dry unit weight from standard Proctor, em= void ratio at maximum dry unit weight from modified Proctor, ers= void ratio at maximum dry unit weight from reduced standard Proctor, erm= void ratio at maximum dry unit weight from reduced modified Proctor.
McCook (1996) developed the correlation between a one-point standard Proctor test performed on air-dry sand and a relative density test for 29 filter sands. The basic purpose was to relate the maximum density test with an easy-to-perform field test to determine the dry densities for clean granular sands. He presented two equations to estimate 50% and 70% relative density from a one- point field test. These equations are presented here by Equations 22 and 23. The correlation coefficient (r) is .97, with a standard error of estimate (SEE), i.e. the square root of average squared deviation is 0.3 kN/m3 for Equation 22, and 0.28 kN/m3 for Equation 23.
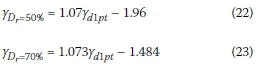
Where: yDr=50% is the dry unit weight at 50% relative density, yDr=70% is the dry unit weight at 70% relative density and Yd1ptis the field air-dry unit weight measured in kN/m3 by compacting air-dry sand in a standard Proctor mould having a volume of 944 cm3, using three lifts, with a 2.5 kg hammer dropped 305 mm for 25 blows per lift.
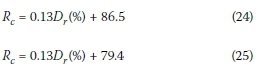
Mujtaba and Farooq (2010) carried out index density tests and compaction tests (both standard Proctor and modified Proctor) on sandy soils. Based on the compaction test results, they calculated relative compaction separately for standard Proctor and modified Proctor, and correlated relative compaction with relative density. The two equations proposed by them for standard Proctor and modified Proctor, respectively, are presented in Equations 24 and 25.
Based on the above preview, it can be inferred that grading parameters including uniformity coefficient, roundness, grain size distribution and fines have a significant influence on the maximum and minimum void ratios of granular soils in combination with mineralogical composition, mode of deposition and origin of the respective soils. Also, there is a need to correlate relative density and relative compaction, irrespective of the errors involved in measuring maximum and minimum dry unit weight for granular soils.
IN-SITU AND LABORATORY TESTS
The test results of the 185 samples, including natural and reconstituted samples belonging to classification groups SP, SP-SM, SW and SW-SM, were used for the development of correlations between relative compaction and relative density, maximum and minimum void ratios, and gradational parameters versus void ratios. The selected sand samples were subjected to the following tests following ASTM standards (ASTM 2007):
■ Grain size analysis (ASTM D-422)
■ Specific gravity test (ASTM D-854)
■ Atterberg's limit test (ASTM D-4318)
■ Standard and modified Proctor compaction test (ASTM D-698 and ASTM D-1557)
■ Index density test (ASTM D-4253 and ASTM D-4254)
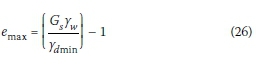
■ In-situ density test (ASTM D- 1556) The void ratios corresponding to maximum and minimum index unit weights (Ydmax and Ydminrespectively) were calculated using Equations 26 and 27.
Test results
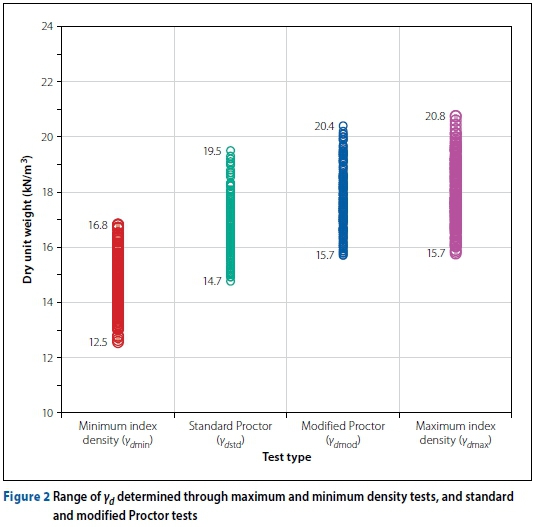
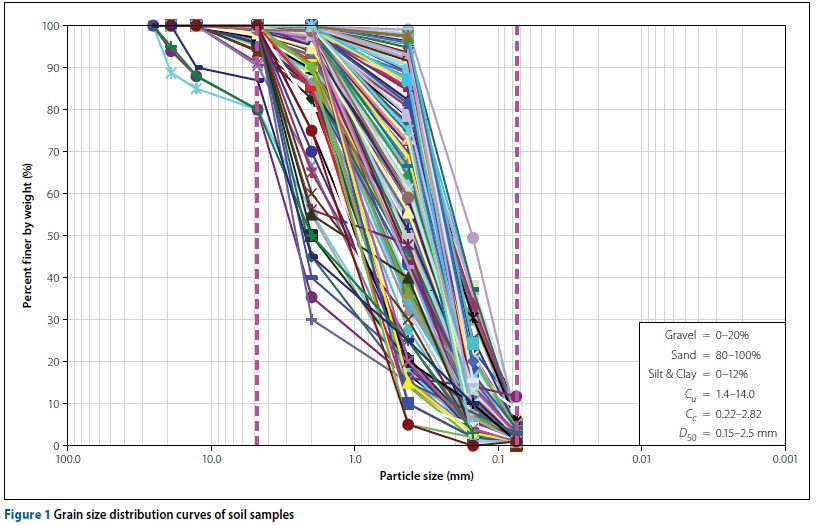
The test data of 165 samples was used for the development of correlations, whereas data of 20 samples was used for validation of the correlation. Figure 1 shows the grain size distribution (GSD) curves for all the samples and Figure 2 shows the range of Ydobtained through index density tests, standard Proctor and modified Proctor. General findings listed below are made on the basis of Figures 1, 2 and 3.
■ All the selected samples are sandy in nature, ranging from coarse to fine sand. The median grain size (D50) of all samples is in the range of 2.5 mm to 0.15 mm, with an average of 0.6 mm, and the standard deviation, which is the amount of dispersion within the D50dataset, is 0.49. The effective grain size (D10) varies from 0.5 mm to 0.075 mm, with an average of 0.13 mm and a standard deviation of 0.05 mm.
■ The sand content is between 80% and 100% in the samples used in this study, whereas gravel (percent retained on US # 4, R4) varies from 0% to 20% and fines (percent passing US # 200, F200) present in the samples are in the range of 0% to 12% according to ASTM D 2487.
■ Based on the results of grain size distribution curves, grain sizes corresponding to 60%, 30% and 10% passing (D60, D30 and respectively) were determined.
The uniformity coefficient  varies from 1.42 to 14.0. The average value of Cuis 4.5 and its standard deviation is 6.1%. The curvature coefficient
  is in the range of 0.22 to 2.82, with a standard deviation of 1.0 and an average of 1.1.
■ Fines in all the samples are less than 12% and are non-plastic in nature.
■ Specific gravity of the samples is in the range of 2.50 ~ 2.76, with an average value of 2.65.
■ All the samples are classified according to the Unified Soil Classification System (USCS) as described in ASTM D-2487. These samples are classified as well-graded sand (SW), poorly graded sand (SP), poorly graded sand with silt (SP-SM), and well graded sand with silt (SW-SM). Of the total samples tested 48% belong to the SP classification group, 40% are SP-SM samples, while representation of SW and SW-SM groups is 6% each in the tested samples.
■ The maximum dry unit weight (Ydmax) corresponding to modified compaction tests is in the range of 15.7 ~ 20.4 kN/m3 as shown in Figure 2, whereas optimum moisture content (OMC) ranges from 9% to 12%. Similarly, for standard compaction tests, compaction parameters, i.e. Ydmax, are in the range of 14.7 ~ 19.5 kN/m3, and OMC between 12 ~ 15.5%.
■ The value of minimum dry unit weight (Ydmin) determined through minimum density tests (ASTM D-4254) varied between 12.5 ~ 16.5 kN/m3, and the value of maximum dry unit weight (Ydmax) determined through maximum density tests (ASTM D-4253) varied between 15.7 ~ 20.8 kN/m3 as presented in Figure 2. Maximum and minimum density tests were repeated thrice on each sample, and average values of Ydmin and Ydmaxwere reported. However, variation in the values of Ydminand Ydmaxare of the order of ± 0.5 kN/m3 and ± 0.3 kN/m3, respectively. The values of maximum and minimum void ratios (emax and emin) are determined through Equations 26 and 27. The value of emax varies from 0.47 to 1.08 and emin from 0.67 to 0.24.
■ Field density tests (FDT) were performed in the bed of River Ravi (Pakistan) using the sand-cone method with a 10.16 cm diameter cone. Uniformly graded sand, passing from sieve # 25 and retained on sieve # 52 and having a dry unit weight of 13 kN/m3, was used in performing the tests. Five test pits were excavated up to a depth of 1.0 ~ 1.5 m. The water table was encountered at a depth of 1.2 ~ 1.6 m in these test pits. FDT was performed at 0.3 m intervals in each test pit, the depth of the test hole for each FDT point was 10 cm, and the diameter of the hole was 10.16 cm. The in-situ densities thus determined varied between 13.6 ~ 19.2 kN/m3 and the natural moisture content varied between 5% and 22%.
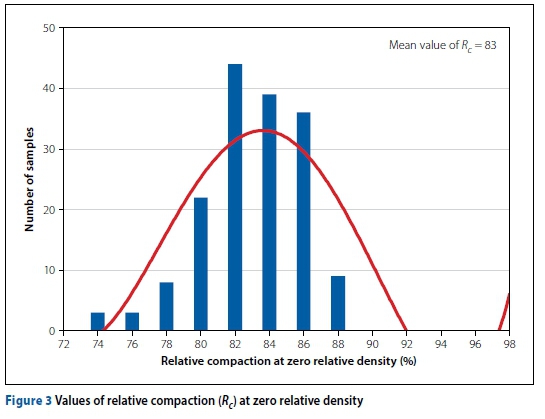
■ Values of relative compaction at zero relative density, i.e. ratio of minimum dry unit weight (Ydmin) and maximum dry unit weight (Ydmax), determined through index density tests, were computed for each data set and are presented graphically in Figure 3. The mean value of relative compaction at zero relative density for this data set is 83.
DEVELOPMENT OF CORRELATIONS
Data analyses were carried out, and based on this, correlations between relative density and relative compaction, maximum and minimum void ratios, material parameters and void ratios have been proposed, which are presented in the following section.
Correlation between relative density and relative compaction
Relative compaction and relative density were calculated by Equations 1 and 2 respectively, and correlation between them is proposed. The value of Ydmaxin Equations 1 and 2 was determined by performing maximum index density tests following the procedure given in ASTM D 4253, whereas Ydmin was determined by minimum index density tests adopting ASTM D 4254. The approach to determine dry unit weight is based on the findings of Tavenas and Rochelle (1972). They reported that the limiting state of compactness can be defined either by measuring the real maximum and minimum densities of a given material by experimenting with every possible compaction technique, or be selecting one particular compaction procedure and declaring the state of compactness as limiting even if they are not necessarily limiting. The second approach is adopted here to determine the dry unit weight of the samples, and using these values, correlation is proposed. Parameter Ydfin Equations 1 and 2 is in-situ dry unit weight and is not measured practically at this stage; its value is rather taken as equal to dry unit weight, as determined by performing the Proctor test (standard and modified) in the laboratory on all samples, and corresponding relative compaction and relative density are calculated. Similarly, Rcand Drare also calculated by taking Ydfequal to 95% of standard and modified Proctor density for each test sample. Also, it is considered that if the soil is in its loosest state, Ydfwill be equal to minimum dry unit weight (Ydmin) and its ej will be equal to maximum void ratio (emax) For this loosest state of the in-situ soil, both relative density (Dr, i.e. zero at loosest state) and relative compaction (Rc) have been calculated. Linear regression analysis was performed on this data set, and the equation between relative density and relative compaction was formulated. Regression analysis technique was used to calibrate the correlation, and the values of coefficients for input and output parameters were determined. Analysis of variance (ANOVA) was also carried out to determine F-statistics for output parameters and i-statistics for input parameters. F-statistics represent the overall predictive capability of the model by considering the combined effect of all the variables present within the model, and i-statistics is the ratio between the difference between two groups and the difference within the group, and is accompanied by a p-value which shows the probability that the results of the dataset occurred by chance. Low p-values indicate that the results do not occur by chance. Coefficient of determination (R2) is equal to the percentage of variation in the dependent variable that can be explained by the independent variable. The final best fit correlation is given by Equations 28.
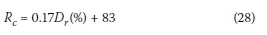
The regression statistics for Equation 28 are: r (824) = .94; t (824) = 681; p < .001. A significant regression equation was found: (F (1), 824) = 5818, p < .001 with R2 = .88, as well as true difference between the means, with a 95% confidence interval = (16.85, 17.20) for relative density and (82.9, 83.45) for intercept. The r value of .94 and R2of .88 for Equation 28 is rated as a reasonable correlation coefficient in geotechnical engineering. The variation between experimental and predicted values of the output parameter is a standard error of estimate (SEE) and its value is 2.11 for Equation 28, which is quite low, indicating the good prediction capability of the model. The model F value for Rcis greater than critical F, indicating that Equation 28 is significant. Similarly, absolute i-statistics for input parameters is greater than the i-significance of the model. Equation 28 is presented in graphical form in Figure 4. From Figure 4 it is clear that when relative density (Dr = 0) is zero, the relative compaction (Rc) varies between 74% ~ 88% with an average of 83%. This larger spread in values of relative compaction at zero relative density may be due to errors, as explained by Tavenas and Rochelle (1972), in determining the values of Ydminand Ydmaxand their correspondingeffect on relative compaction, plus change in the gradation and different specific gravity values of the tested samples. However, it is difficult to fix the real contribution of each above-mentioned fact (i.e. dry unit weight, change in gradation and specific gravity) in the variation of Rccorresponding to zero Dr . This implies that when the soil is placed in its loosest state, its relative density is zero, whereas its average value of relative compaction is 83%. This finding is in good agreement with Lee and Singh (1971) who noted that when Dr is zero, then Rcis equal to 80%. It is also inferred from Equation 28 that a one-point variation in relative compaction is equivalent to a six-point variation in relative density, whereas a 1 percent change in relative compaction value is equivalent to a 5 percent change in relative density in the Lee and Singh (1971) equation, indicating that Equation 28 is more sensitive. The major advantage of writing a technical specification in terms of Dr rather than Rcis that it magnifies the values and thus automatically emphasises the importance of small variations from the specified values. A small variation in the value of Dr may be significant when studying the liquefaction potential of granular soil during earthquakes. The limitation of the proposed Equation 28 is in line with the Tavenas and Rochelle (1972) observation that an error in computing Dr is a function of errors in measuring Ydmin' Ydmaxand Ydf Most of the varying errors occurring during measurement of the desired parameters (Ydmin' Ydmaxand Ydf) are due to the measuring technique being used by different persons performing the experiments. Although these errors may be small, they have a significant effect on the Dr values.
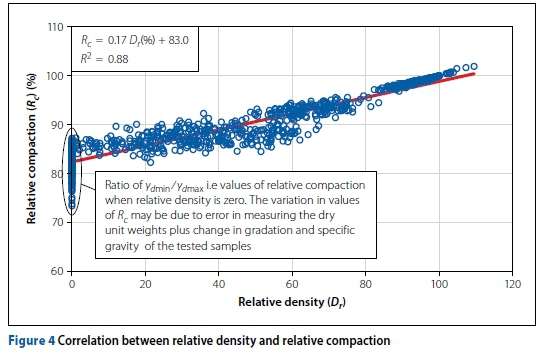
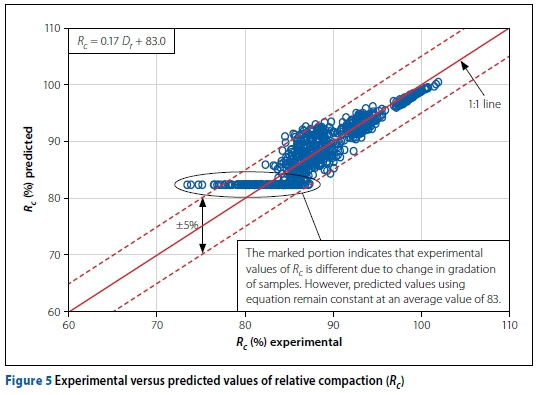
Figure 5 represents the extent of difference between experimental data and predicted values, using Equation 28. These plots show that the prediction accuracy of the relation is within ± 5% for Rc(%) with a 95% confidence interval. It can also be observed from Figure 5 that, when soil is in the loosest state, the predicted value of relative compaction value is 83.0, as calculated using Equation 28, but practically experimental values of relative compaction at the loosest state are different due to changes in grain size distribution and errors in measuring the unit weights, indicating the non-applicability of Equation 28 when the soil is in its loose state. However, when the in-situ density of soil is more than its loosest state, the variation between experimental versus predicted values is quite reasonable, justifying the use of this equation for practical purposes.
Validation of relation between relative density and relative compaction (Equation 28)
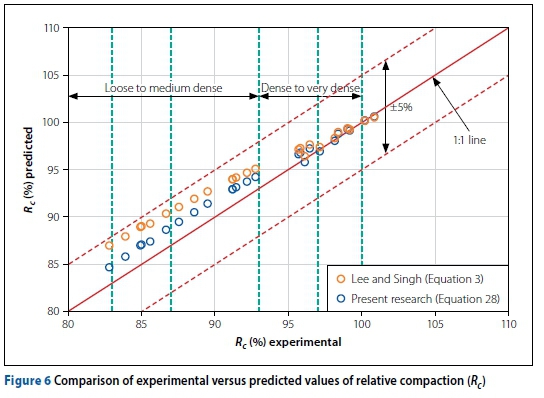
Development of any predictive model is followed by its validation by some independent data that had not been used for the development of the model. In this study, subsequent to the model formulation, five test pits were excavated in the bed of River Ravi (Pakistan) and field density tests were performed using the sand replacement technique. The in-situ density at various depths in each test pit was determined. Samples were also collected from each test point and brought to the geotechnical engineering laboratory, where index density tests were conducted on these samples. This test data was used for the validation of Equation 28. The experimental values of Rcof these samples were plotted against the predicted values using Equation 28 and are shown in Figure 6. A variation of ± 5% was observed between the predicted and experimental values of Rc. The empirical relationship developed by the Lee and Singh (1971) equation was also used to predict relative compaction and plotted against experimental values of Rc. It was observed that both equations overestimated relative compaction values, as they were plotted above the 1:1 line in Figure 6. However, all the predictions by the Lee and Singh (1971) equation and Equation 28 fall within the limits of ± 5%. By careful scrutiny of Figure 6, it can be observed that when soil is between the loose to medium dense state, i.e. relative compaction of the soil is between 80% ~ 93%, the difference in the predicted values of Rcby both the equations is within 2% ~ 3%. However, this difference diminishes when the subsoil conditions are dense to very dense, or when the relative compaction value is between 93% and 100%. The probable reasons for this difference in predicted values of relative compaction are errors in measuring dry unit weights plus the difference in the intercept of these equations, which is more dominating when the soil is between loose to medium dense. This indicates that Equation 28, as proposed in this research, and the Lee and Singh (1971) relation can be used effectively to correlate relative density and relative compaction.
Correlation between maximum and minimum void ratios
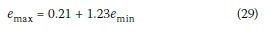
Regression analysis was carried out on the test data to relate the maximum and minimum void ratios. It was observed that linear correlation exists between maximum and minimum void ratios, and is given by Equation 29. Experimental and predicted values of emin by Equation 29 are plotted in Figure 7 using the data set. It is observed that variation in measured and predicted values of void ratios is within ± 10%.
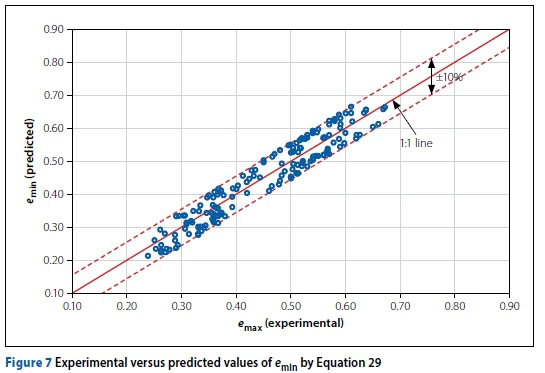
The regression statistics for Equation 29 are: r (164) =.95; t (164) = 13.2; p < .001. A significant regression equation was found: (F (1), 164) = 1665, p < .001 with R2= .91. The lower and upper limit of intercept at a 95% confidence interval is .16 ~ .22 for intercept, and that of emin is between 1.20 ~ 1.32. These regression statistics indicate that the correlation between maximum and minimum void ratio is significant. R2for Equation 29 is .91, indicating that only 9% of the variation in the values of emaxwas not accounted for by the regression.
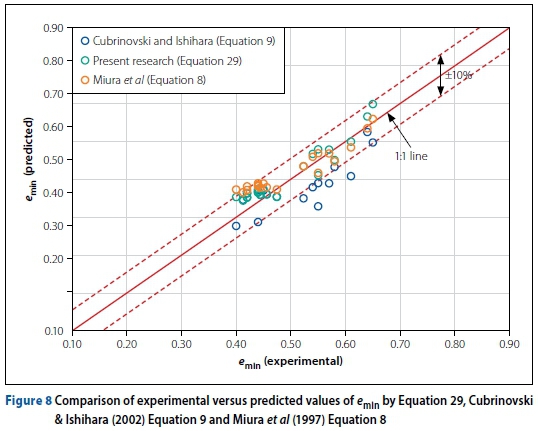
Validation of the relation between maximum and minimum void ratios (Equation 29)
In this study, after the formulation of correlation between maximum and minimum void ratios, a new set of twenty soil samples which had not been used in the model development, were tested in the laboratory for the validation of the correlation.
Experimental values of minimum void ratio (emin) are plotted against the values predicted by Equation 29 and are shown in Figure 8. It is observed that all the predicted values fall within ± 10% of the measured values. The empirical relationship developed by Cubrinovski and Ishihara (2002) and Miura et al (1997) are also used to predict minimum void ratios of these twenty samples, and are also presented in Figure 8. For emin, six out of 20 observations fall outside the limit of ± 10% by using Cubrinovski and Ishihara (Equations 9 and 10), while predictions using the Miura et al equation falls within the ± 10% limit. The probable reason for this variation in prediction by the Cubrinovski and Ishihara equation is that the test procedure being employed in the present research (Equation 29) in determining eminis based on the ASTM standard, whereas the Cubrinovski and Ishihara equation is based on the Japanese Geotechnical Standard. Therefore, caution is needed when applying their equations (Equations 9 to 12) to estimate eminoremax.
Correlation between gradational parameters and void ratios
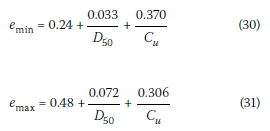
Multivariate regression analysis was carried out using Statistical Product and Service Solution (SPSS) software on the data to develop a predictive model between gradational parameters and voids. The input parameters used for regression were median grain size (D50), effective grain size (D10), uniformity coefficient (Cu), curvature coefficient (Cc) and specific gravity (Gs). Stepwise regression analysis was carried out, and out of the five above-mentioned parameters, median grain size (D50) and uniformity coefficient (Cu) passed the F-test and t-test with a 95% confidence interval. These relations are presented in Equations 30 and 31 respectively. The experimental versus predicted values of void ratios are presented in Figure 9. The variation between experimental versus predicted values falls within ± 10%.
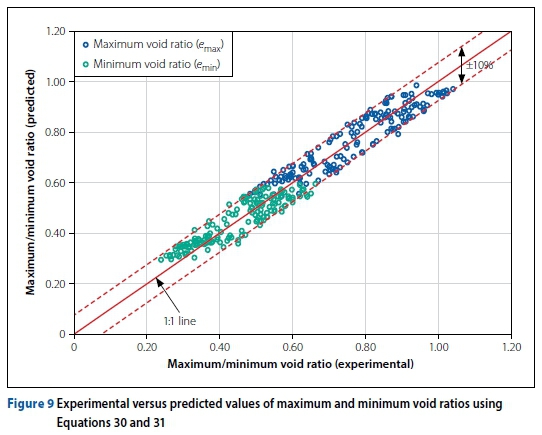
The R values of 0.90 and 0.92 for Equations 30 and 31 thus obtained as a result of regression analysis by SPSS are rated as reasonable correlation coefficients in geotechnical engineering. SEE values of 0.06 and 0.06 for Equations 30 and 31 are very low, representing good prediction capability of the models. Analysis of variance (ANOVA) was also carried out by SPSS software.
Regression statistics for Equation 30 are (F (2 162) = 339.70; p < .000; with R2 = .81; t (162) = 13.05, 14.75; p < .000 for  and
and  , respectively. Similarly, for Equation 31 regression statistics are (F (2 162) = 438.03; p < .000 with R2= .85; t (162) = 20.64, 10.27; p < .000 for
  and
and  , respectively. Based on these statistical results, it is evident that both independent variables (Cuand D50) are significant predictors of emaxand emin. Furthermore, this suggests that a slight change in Cuand D50values have a marked effect on emaxand emin. Also, it can be inferred from Equations 30 and 31 that emaxand eminare inversely proportional to median grain size and Cu. Void ratios predicted using Equations 30 and 31 decrease as the median grain size increases and density increases. However, it is known that, as median grain size increases, it leads to segregation of the aggregates, resulting in looser packing compared to a smaller median size, which would lead to denser packing. This is the limitation of these equations, and it may be catered for by the fact that these equations are valid for median grain sizes ranging between 0.2 mm and 2.8 mm. These equations would not be reliable to estimate void ratios for samples comprising bigger-sized particles (D50> 3 mm). Secondly, fractions of the material bigger than the diameter of the soil at 60% passing (D60) have no role in the prediction of emax and eminusing Equations 30 and 31, but in practice bigger-sized particles may lead to more voids if not properly packed, resulting in lesser densities compared to medium or smaller-sized particles which may have uniform packing.
Validation of correlation between grain size parameters and void ratios (Equations 30 and 31)
After the formulation of correlations between gradational parameter and void ratios, a new set of 20 soil samples were tested in the laboratory, and their results were utilised for the validation of the correlations. Experimental values of void ratios were plotted against predicted values using Equations 30 and 31. It was observed that all the estimations fell within ± 10% limits and are shown in Figure 10. The empirical relationship developed by Patra et al (2010) was also used to predict void ratios for these 20 samples. The comparison of experimental versus predicted values is also presented in Figure 10. It can be inferred from Figure 10 that the Patra et al (2010) equation overestimates eminby about 15%. However, for emax five out of 20 predictions fall outside the ± 10% limits.
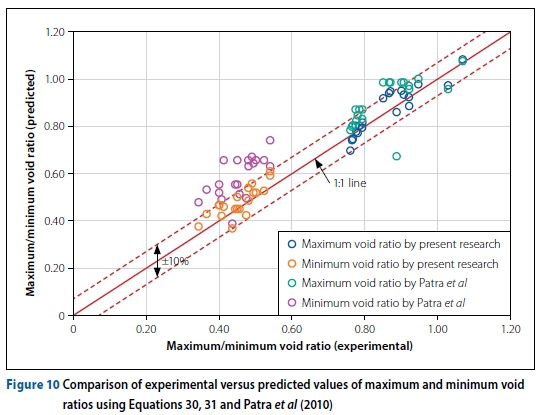
The probable reason for the estimation variation by Patra et al (2010) may be that it depends on only one parameter (median grain size), and therefore does not reflect the full representation of the grain size distribution curve.
FIELD IMPLICATION OF THE PROPOSED MODELS
Three models (relations between relative density and relative compaction, maximum versus minimum void ratio, and gradation-al parameters versus maximum and minimum void ratios) have been presented in this research. These models are very useful in estimating various properties based on grain size or index density tests for granular soils, which are normally recommended to be used in road construction or as a backfill material. However, these equations have a few limitations and cannot be used for soil possessing more than 20% gravels, or soils with fines greater than 15%. The estimation in this case may be misleading. Secondly, the uniformity coefficient is the ratio of two grain sizes, and different soils with different grain sizes may have the same Cuvalues, but their corresponding void ratios may be different, which could be misleading. However, for prediction purposes and for the sake of simplicity, the proposed models may be very appealing.
CONCLUSIONS
A simple linear correlation between relative density and relative compaction has been proposed, based on a large amount of experimental data, followed by proper validation. Linear and multiple regression analyses were carried out on the same data set to relate emaxand emin and to the parameters Cuand D50. The validity of these correlations was verified using an independent data set along with the comparison of the proposed models with similar correlations presented by other researchers. The following conclusions were made from the research.
■ Based on extensive data of compaction tests including both standard and modified Proctor and relative density tests, correlation between relative density and relative compaction has been developed as given below:
■ It is inferred from the results of relative density and relative compaction that, when sandy soil is in its loosest state, its relative density is zero, whereas its relative compaction is 83%. Also, it can be concluded that Rcpredicted by the proposed equation and Lee and Singh (1971) fall within ± 50% with a 95°% confidence interval indicating the applicability of both these equations for Pakistan's local sands having non-plastic fines up to 10%.
■ There is a linear relationship between the maximum and minimum void ratio of sandy soils. The maximum void ratio can be estimated using the correlation emax = 0.21 + 1.23emin with a 95% confidence interval. The experimental versus predicted values of emin fall within ± 10% with a 95% confidence interval.
■ Based on the grain size data of the test specimens and the index density test data, maximum and minimum void ratios can be predicted using the following relations:
The prediction accuracy of the above-mentioned correlations is within ± 10% with a 95% confidence interval.
REFERENCES
ASTM (American Society for Testing and Materials) 2007. ASTM Book of Standards, Section 4, vol. 04.08, West Conshohocken, PA: ASTM International. [ Links ]
Cubrinovski, M & Ishihara, K 1999. Empirical correlation between SPT N-value and relative density for sandy soils. Soils and Foundations, 39(3): 6l-7l. doi.org/10.3208/sandf.39.5_61. [ Links ]
Cubrinovski, M & Ishihara, K 2002. Maximum and minimum void ratio characteristics of sands. Soils and Foundations, 42(6): 65-78. doi.org/10.3208/sandf.42.6_65. [ Links ]
Graton, L C & Fraser, H J 1935. Systematic packing of spheres - with particular relation to porosity and permeability. Journal of Geology, 43(8): 785-909. [ Links ]
JGS (Japanese Geotechnical Society) 2000. JGS 0161. Test Method for Minimum and Maximum Densities of Sand. Soil Testing Standard, pp 136-138. [ Links ]
Kulhawy, F H & Mayne, P W 1990. Manual on estimating soil properties for foundation design. Report EL-9800 to the Electronic Power Research Institute. Ithaca, NY: Cornell University. [ Links ]
Lade, P V, Liggio, C D & Yamamuro, J A 1998. Effect of non-plastic fines on minimum and maximum void ratios of sand. Geotechnical Testing Journal, ASTM, 21(4): 336-347. [ Links ]
Lee, K L & Singh. A 1971. Relative density and relative compaction. Journal of the Soil Mechanics and Foundations Division, ASCE, 97(7): 1049-1052. [ Links ]
McCook, D K 1996. Correlations between simple field test and relative density test values. Journal of Geotechnical Engineering, 122(10): 860-862. doi: 10.1061/(ASCE)0733-9410(1996)122:10(860). [ Links ]
McGeary, R K 1961. Mechanical packing of spherical particles. Journal of the American Ceramic Society, 44(10): 513-522. [ Links ]
Miura, K, Maeda, K, Furukawa, M & Toki, S 1997. Physical characteristics of sands with different primary properties. Soils and Foundations, 37(3): 53-64. [ Links ]
Mujtaba, H & Farooq, K 2010. Experimental study on relative compaction and relative density of sandy soils. Proceedings, International Conference on Geotechnical Engineering (ICGE 2010), Lahore, Pakistan, pp 67-74. [ Links ]
Patra, C R, Sivakugan, N, Das, B M & Rout, S K 2010. Correlations for relative density of clean sand with median grain size and compaction energy. International Journal of Geotechnical Engineering, 4(2): 195-203. doi: 10.3328/IJGE.2010.04.02.195-203. [ Links ]
Shimobe, S & Moreto, N 1995. A new classification for sand liquefaction. Proceedings, 1st International Conference on Earthquake Geotechnical Engineering, Tokyo, Japan, pp 315-320. [ Links ]
Tavenas, F & Rochelle, P 1972. Accuracy of relative density measurements. Geotechnique, 22(4): 549-562. [ Links ]
White, H E & Walton, S F 1937. Particle packing and particle shape. Journal of the American Ceramic Society, 20(5): 155-166. [ Links ]
Youd, T L 1973. Factors controlling maximum and minimum densities of sands. Evaluation of relative density and its role in geotechnical projects involving cohesionless soils. STP 523, West Conshohocken, PA: ASTM, pp 98-122. [ Links ]
 Correspondence:
DR HASSAN MUJTABA
Associate Professor, Department of Civil Engineering University of Engineering and Technology Lahore, Pakistan
T: +92 32 19431303, E: hassanmujtaba@uet.edu.pk
DR KHALID FAROOQ
Professor and Chairperson, Department of Civil Engineering University of Engineering and Technology Lahore, Pakistan
T: +92 42 99029202, E: kfch@uet.edu.pk
NAGARATNAM SIVAKUGAN
Associate Professor, College of Science and Engineering, James Cook University
Townsville, QLD 4811, Australia
T: +61 7 47814431, E: siva.sivakugan@jcu.edu.au
DR BRAJA M DAS
Professor and Dean Emeritus, California State University
2689 Chateau Clermont Street, Henderson, Nevada 89044 United States of America
T: +1 702 616 2161, E: brajamdas@gmail.com

DR HASSAN MUJTABA is serving as Associate Professor in the Civil Engineering Department at the University of Engineering and Technology, Lahore, Pakistan. Dr Mujtaba obtained his BS, MS and PhD in Civil Engineering from the same university. He is a registered Professional Engineer and has more than 15 years' professional experience in the field of geotechnical engineering. He has authored, presented and published more than 30 technical papers in international/ national journals and conferences. His research interests are correlations between cohesive and non-cohesive soils, and problematic soils and their mitigation techniques.

DR KHALID FAROOQ is Professor in the Department of Civil Engineering at the University of Engineering and Technology, Lahore, Pakistan, and also the Chairperson ofthe Department. Dr Farooq completed his Bachelorand Master'satthesameuniversityand obtained his PhD in Civil Engineering from the University of Tokyo, Japan. He is a registered Professional Engineer and has more than 25 years' professional experience in the field of geotechnical engineering. He has published more than 65 technical papers in international/national journals and conferences. His research interests are: rain-induced landslides, problematic soils and mitigation techniques, soil improvement and ground characterisation. He provides substantial consultancy services for geotechnical engineering in Pakistan.

NAGARATNAM SIVAKUGAN is a Chartered Professional Engineer, and a Fellow of both the American Society of Civil Engineers and Engineers Australia. He graduated with First Class Honours from the University of Peradeniya, Sri Lanka, and MSCE and PhD degrees from Purdue University, USA. His writings include eight books, 150 journal papers and 100 conference papers in conference proceedings. He does substantial consulting work for geotechnical and mining companies in Australia and internationally.

DR BRAJA M DAS is Professor and Dean Emeritus at California State University, Sacramento, California, USA. He is a Fellow and Life Member of the American Society of Civil Engineers, Life Member ofthe American Society of Engineering Education, and Emeritus Member of the Committee on Stabilization of Geomaterials and Recycled Materials ofthe Transportation Board, Washington, DC. He has authored several text and reference books in the field of geotechnical engineering, and has published over 300 research papers in journals and conference proceedings.

