


Services on Demand
Article
 English (pdf)
 Article in xml format
 Article references
Indicators

Related links
-
 Cited by Google
 -
 Similars in Google
Share

 Permalink
Journal of the South African Institution of Civil Engineering
On-line version ISSN 2309-8775
Print version ISSN 1021-2019
J. S. Afr. Inst. Civ. Eng. vol.61 n.4 Midrand Dec. 2019
http://dx.doi.org/10.17159/2309-8775/2019/v61n4a6
TECHNICAL PAPER
The development of suitable cyclic loading and boundary conditions for ballast box tests
T C U Jideani; P J Grabe
ABSTRACT
Laboratory tests on ballast give insight into the behaviour and performance of the ballast layer under passenger and heavy-haul traffic. It is important, however, to ensure that the simulation of train loads on the ballast layer in the laboratory represents in-situ loading conditions. Furthermore, the provision of ballast lateral confinement during laboratory tests should model the confinement along the track. With adequate, representative loading patterns and boundary conditions executed during laboratory tests on ballast, the overall response and performance of the ballast layer can be estimated and predicted more accurately. This gives an indication of an ideal response of the ballast layer in the field, as well as its impact on track structure deterioration.
The objective of this study was to develop suitable cyclic loading and boundary conditions for ballast box tests in the laboratory to represent similar conditions in the field. By conducting box tests, the ballast deformation results revealed the suitable loading pattern that produced a similar rate of ballast strain accumulation as the Field Loading (FL) pattern. Furthermore, boundary condition results showed that decreasing the Level of Lateral Confinement (LoLC) increased the permanent deformation of the ballast layer and the breakage of ballast. The laboratory loading pattern developed in this research, as well as comparable laboratory and field boundary conditions, could provide accurate predictions of the long-term behaviour of ballast and support the planning for subsequent ballast maintenance interventions based on realistic and accurate laboratory test results.
Keywords: loading pattern, box testing, lateral confinement, ballast deformation, ballast breakage
INTRODUCTION
Although ballastless track does exist, the conventional track to date is by far the most common and economical track utilised. The design of railway track is commonly based on axle load and wheel spacing. Reducing the wheel spacing causes the influence lines from each wheel load to overlap, causing higher stresses, thus increasing the vertical deflection of the track. Therefore, the length of a train and its wheel configuration are important factors to consider when determining the cumulative effect of cyclic loading on a track structure, especially when conducting laboratory test simulations.
Most laboratory box tests on ballast employ haversine loads to simulate train wheel loads. However, the effect of wheel spacing, loading impulse (the area under the load curve) and wheel load overlap is not considered when choosing a loading pattern. Furthermore, simulated train loads and boundary conditions as used in ballast box tests often do not correlate well with real train loading. It is therefore important to ensure that reasonable and practical conclusions are drawn based on realistic loading and boundary conditions employed in the laboratory.
LITERATURE REVIEW
Cyclic loading, from a railway point of view, is characterised by the shape, duration, magnitude of loading (stress) pulse, time interval between consecutive load pulses (a reflection of wheel spacing) and the total number of load pulses. Powrie et al (2007) and Li et al (2015) suggest that, to determine the number of cyclic loading applications for a laboratory test, common practice is to assume that two axle loads from a bogie are considered to produce one load cycle for the ballast layer, and four axles from two bogies are considered to produce a single load cycle for the subgrade layer. Selig and Waters (1994) presented a conversion factor to convert the number of load cycles to gross tonnage as follows:
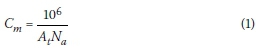
Where:
Cm= the number of load cycles per million gross tonne (MGT)
At= the axle load in tonnes
Na= the number of axles per load cycle.
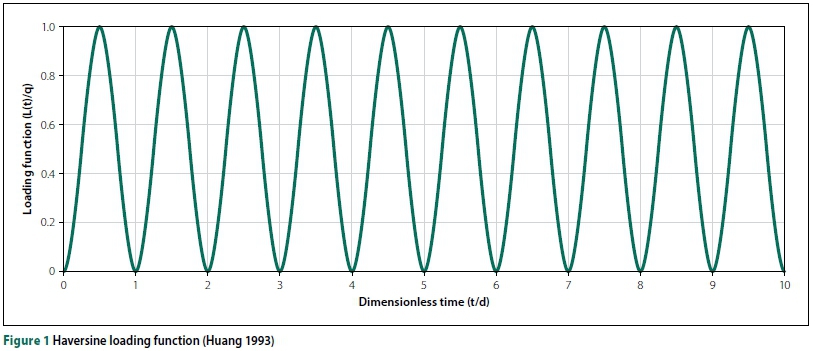
However, the above practice and equation vary depending on the coupler/axle spacing of the train under consideration. Huang (1993) and Li (1994) suggest that the type and duration of cyclic loading should simulate the actual occurring loading pattern in the field, and recommended the use of a stress pulse in the form of haversine (Figure 1), triangular or trapezoidal loading. Most laboratory tests on ballast, either box or triaxial tests, employ haversine loads (comparable to pavement loading) to simulate train wheel loads (Indraratna & Ionescu 2000; Ebrahimi et al 2012). However, the effect of wheel spacing, loading impulse (area under loaded curve) and wheel load overlap is not considered when choosing a loading pattern. This loading condition for ballast laboratory testing needs to be evaluated and compared with multiple load pulses per load cycle which is identical to field loading conditions.
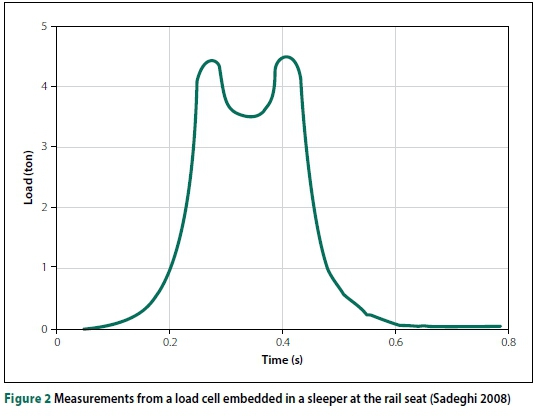
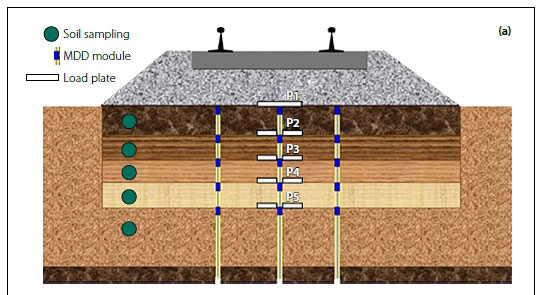
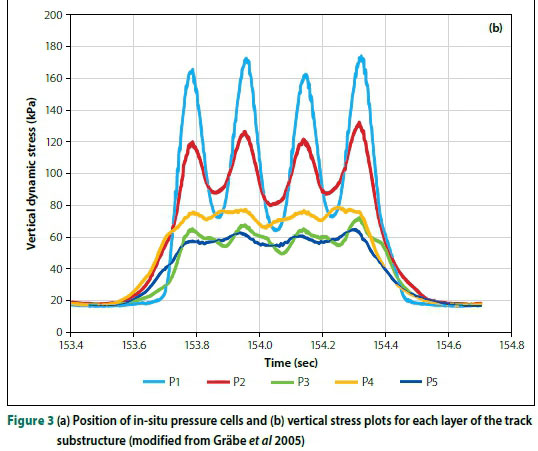
Field investigations using load cells (Zakeri & Sadeghi 2007; Sadeghi 2008; Sadeghi & Shoja 2012) and pressure cells (Grabe et al 2005) reveal the loading pattern of a train (comprising 1 800 mm wheel spacing per bogie) at the rail seat of a concrete sleeper and the changes in vertical dynamic stress pulses at each layer with depth, respectively (Figures 2 and 3(a)(b)).
Many field and numerical studies conclude that stress pulses decrease with depth - where each passing axle is apparent in the subballast layer, while the effect of each adjoining pair of bogies is evident on the surface of the natural ground. These studies further conclude that haversine loading is appropriate for subgrade tests in the laboratory (Li & Selig 1996; Liu & Xiao 2010; Priest et al 2010; Razouki & Schanz 2011; Li et al 2015).
The frequency of loading is dependent on the train speed, with typical track loading frequency between 8 Hz and 10 Hz (depending on the specified design speed of the railway line and the wheel spacing), according to Aursudkij et al (2009). Rest periods in field train loading is a function of axle wheel spacing and train speed, which have a major influence on ballast settlement (Qian et al 2011). Several studies conclude that continuous increase in loading frequency yields an increase in particle breakage, ballast axial and volumetric strains, stress and the deflection of individual track layers (Sun et al 2014; Yang et al 2009; Powrie & Priest 2011). Loading amplitude also has a major effect on ballast performance, where ballast permanent strain increases with an increase in wheel load (Stewart 1986; Selig & Waters 1994). However, the rate of ballast deformation is negligible at low cyclic stress levels, where the response of ballast below this stress level becomes almost elastic (Suiker 2002).
Although a continuous haversine load pulse is commonly applied in cyclic box and triaxial tests, the actual dynamic loading may have a loading pattern of varying pulse shapes, with rest periods (according to the wheel spacing, wagon length, and train speed) which may directly affect the vibration and deformation of the track structure (Huang et al 2009).
Permanent deformation of ballast in railway tracks is in the form of settlement, with the ballast layer being the main contributor to track settlement. Ballast settlement occurs due to particle rearrangement, abrasion, and particle breakage. Factors that affect ballast settlement (among others) include stress level, principal stress rotation, number of load applications, moisture content, stress history, density and load frequency (Knutson 1976; Selig & Waters 1994; Lekarp et al 2000; Barksdale 1972; Shenton 1984; Lekarp & Dawson 1998; Indraratna et al 2010a; Sun et al 2014). Several ballast deformation models have been established based on the relationship between the number of load applications and settlement of ballast. However, these models do not consider sleeper properties, ballast type, ballast depth or shoulder dimensions (Abadi et al 2016).
Ballast breakage is a common phenomenon that occurs during load application. Some factors influencing ballast breakage include macroscopic (external) stresses, size of the particle, coordination number (i.e. number of contacts with neighbouring particles), ballast properties (such as grain texture, mineral composition, internal bonding, etc) and loading conditions (McDowell et al 1996; Hardin 1985; Lade et al 1996; Shahin et al 2007). Lade et al (1996) summarised commonly used breakage indices which quantify the extent of ballast breakage. Marsal's breakage index, Ba, is represented by the sum of positive values AWkwhich are based on the difference in percentage retained on each sieve before and after a test. Indraratna's Ballast Breakage Index (BBI), specifically for railway ballast, is used to quantify the extent of ballast degradation by evaluating the change in area of the particle size distribution before and after testing (Indraratna et al 2005; Lackenby et al 2007).
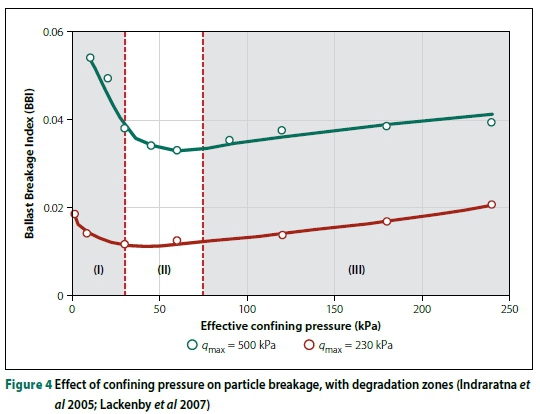
The influence of confining pressure on the behaviour of ballast is not considered a significant factor in rail track design. Figure 4 shows the effect of confining pressure on particle degradation using the ballast breakage index (BBI). Indraratna et al (2005) and Lackenby et al (2007) divide the ballast degradation behaviour into three zones (see Figure 4) following a series of triaxial tests. These zones are (I) Dilatant Unstable Degradation Zone (DUDZ), (II) Optimum Degradation Zone (ODZ), and (III) Compressive Stable Degradation Zone (CSDZ). Most ballast degradation is due to the breakage of angular corners in DUDZ, attrition of asperities in ODZ and particle splitting due to microcracks, particle flaws and fatigue in CSDZ. Furthermore, ballast axial strain decreases with increasing confining pressure.
Although researchers have performed numerous tests using the box test technique, the effect of different loading patterns and load impulse on the rate of ballast degradation is not fully understood. In addition, assessing the effect of confining pressure on ballast breakage from a ballast box test perspective under field loading and boundary conditions has not yet been investigated. This study therefore, seeks to provide a suitable loading pattern and boundary condition for laboratory ballast box testing to accurately reflect field conditions. To achieve these objectives:
■ A suitable loading pattern was developed to reproduce an approximate rate of ballast strain accumulation as experienced in the field. This was done by comparing different haversine loading patterns with an FL (Field Loading) pattern.
■ The effect of varying LoLC (Level of Lateral Confinement) on the permanent strain and particle breakage of the ballast layer was investigated.
CHARACTERISING AND MODELLING OF THE FIELD LOADING PATTERN
A typical FL pulse (pattern) at the rail seat, expressed as a load-time relationship, was recorded by Sadeghi (2008) with a wheel spacing of 1 800 mm (Figure 2). Comparing the shape of this load pulse with the stress pulse obtained from in-situ pressure plate readings at the subballast layer, recorded by Grabe et al (2005) (Figure 3(b)) with a wagon wheel spacing of 1 830 mm, reveals some similarities in the pulse shapes -especially in the upper region. Other track and train details from the above-mentioned publications are outlined in Table 1.
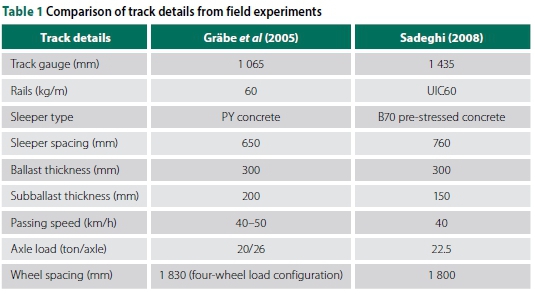
The stress pulse shape recorded by Grabe et al (2005) was used as a reference, because the focus of this study was on replicating the loading pulse of a 4-axle train configuration (South African Coal Line) in laboratory box tests. Hence, the FL pulse used for the experiment takes the shape of the stress pulse at the subballast (Figure 3(b)). Although wheel load data from strain gauges was readily available, the load on the ballast was assumed to be equivalent to the rail seat load due to the load distribution. Therefore, for all experiments conducted, a maximum load equal to the rail seat load was used.
To convert the stress pulse values to rail seat loads, the equivalent force, fnfrom the in-situ pressure plate, was calculated by multiplying the pressure plate readings, σn, by the circular area of the pressure plate, a (Equation 2).
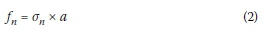
Where: n is the data point number and the pressure plate radius is 30 cm.
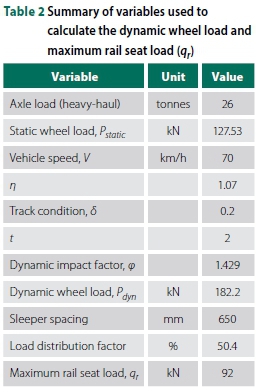
To obtain the FL pattern (load-time relationship), the ratio of maximum rail seat load (qr) to maximum equivalent force (max (fn)) was multiplied by each fnvalue. The maximum rail seat load (qr) was obtained by multiplying the dynamic wheel load (P^yn) by a load distribution factor of 0.5 (Sadeghi 2008). The dynamic wheel load (Pdym) was calculated using the dynamic impact factor developed by Eisenmann (1972). Table 2 provides a summary of the dynamic wheel load and maximum rail seat load (qr) calculation, with a maximum rail seat load of 92 kN.
The FL pattern (Figure 5) was simplified to eliminate irregularities. The following aspects of the loading pattern were adjusted:
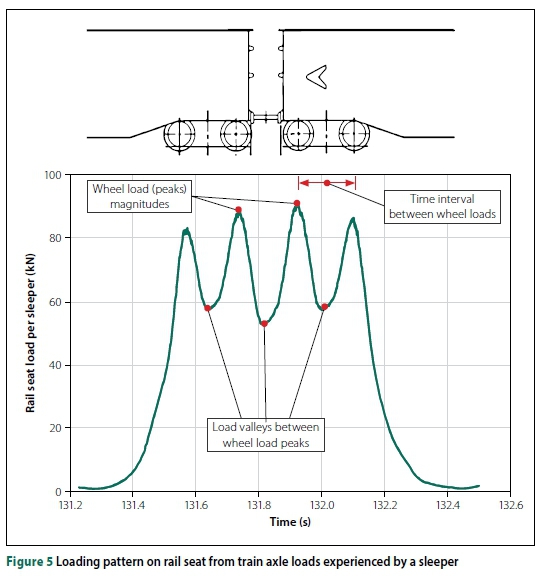
■ Wheel load magnitudes (peaks): an equal maximum wheel load of 92 kN was set for all four-wheel loads represented by the loading pattern.
■ Averaged load valleys between wheel loads were equal.
■ Wheel spacing: equal wheel spacing for a load cycle was assumed, with a negligible effect on the ballast material tested.
The average load valley was calculated as 55.2 kN. A relationship between load amplitude and load valley was established using a factor of 1.667. Therefore, for any minimum applied load (Lmin) and load amplitude(Lampl)the load valleys (LValleys) between wheel load can be obtained using the following expression:

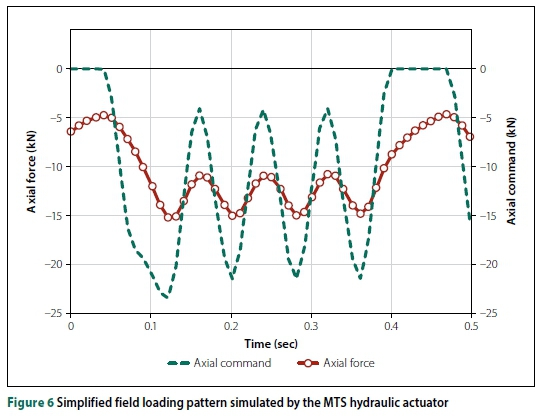
The ability of the hydraulic load frame to simulate this loading pattern was investigated by obtaining a suitable frequency and load amplitude to produce an appropriate loading shape. This was performed using the sleeper block and a 500 mm x 500 mm x 350 mm steel box containing ballast (300 mm depth). Consequently, a scaled-down load was determined. The Axial Command values in the MTS load profile were adjusted to reduce the load amplitude required to achieve the desired simplified FL pattern represented by the Axial Force values as shown in Figure 6. A scaled-down (rail seat) load amplitude, and a minimum and maximum load of 10 kN, 5 kN and 15 kN respectively, at 2.5 Hz, were obtained after the Axial Command values were adjusted.
EXPERIMENTAL SETUPS AND METHODOLOGY
Two experimental setups (1 and 2) were considered. The experiment using Setup 1 was concerned with developing a suitable loading pattern for laboratory box tests with the boundary conditions remaining constant (fully confined). The experiment using Setup 2 was concerned with altering the boundary conditions (decreasing the lateral confinement) of a box test to investigate the effects on ballast settlement and breakage.
Experimental Setup 1 -simulation of loading patterns
This scaled-down model of a railway track consisted of a 25 mm thick steel box (500 x 500 x 350 mm) and a PY sleeper block (228 x 185 x 170 mm). The setup required regular ballast replacement, as four different loading patterns were investigated. Figures 7(a) and (b) show the schematic drawings of the ballast compaction and experimental arrangement for Setup 1 respectively.
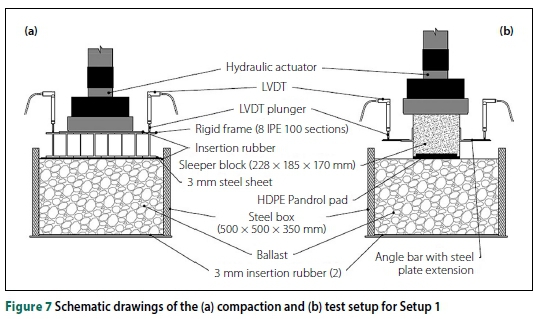
The quartzite ballast used complied with the S406 ballast specification (TFR 1998) for grading. The 450 mm x 440 mm rigid compaction frame was constructed to ensure limited flexural movement. The rubber paddings placed between the actuator piston and the rigid frame, and between the ballast and steel sheet, were used to prevent damage abrasion and reduce ballast abrasion during compaction, respectively. Track subgrade is commonly modelled as a semi-infinite elastic half space, characterised by a soft or stiff foundation. The rubber sheets at the base of the box were used to replicate the slightly compressible effects of the subgrade layer. However, the contribution of the rubber sheets to achieve this subgrade provided by the load unit table in a box setup is always a limitation compared to the proper use of a semi-infinite elastic half-space. After compaction, a high-density polyethylene (HDPE) Pandrol pad was fitted to the base of the sleeper block to prevent progressive sleeper wear. The axial force applied to the ballast sample was generated using a 500 kN hydraulic actuator (MTS component) regulated by servo-valves.
Methodology (Setup 1)
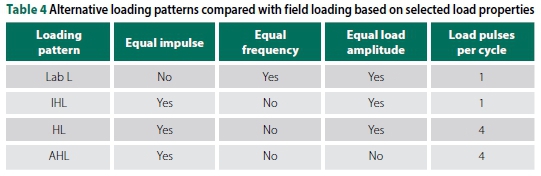
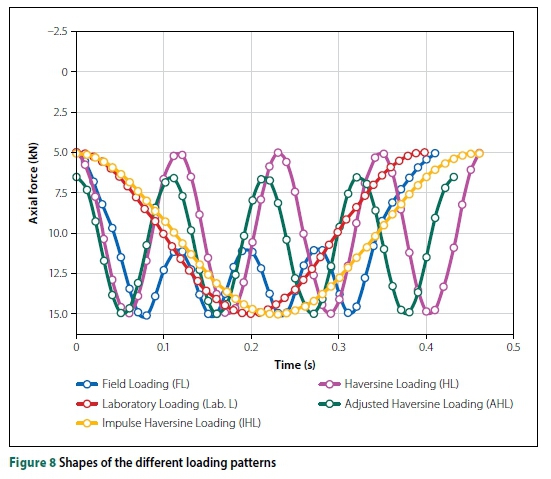
The comparison of alternative loading patterns to the FL pattern was primarily based on the rate of strain accumulation of the ballast layer. Other loading aspects that were investigated were the load cycle impulse and load frequency (rest periods). The FL pattern was compared with the following loading patterns which can be simulated in the laboratory:
■ Conventional haversine loading (or Laboratory Loading - Lab L): frequently used in the laboratory to simulate train loading, where a single load cycle represents four-wheel loads.
■ Impulse Haversine Loading (IHL): modified Lab L, where the impulse of the Lab L pattern is equal to that of the FL pattern, and a single load cycle represents four-wheel loads.
■ Haversine Loading (HL): four loading pulses which represent four-wheel loads, with the load cycle impulse equal to the load cycle of the FL pattern.
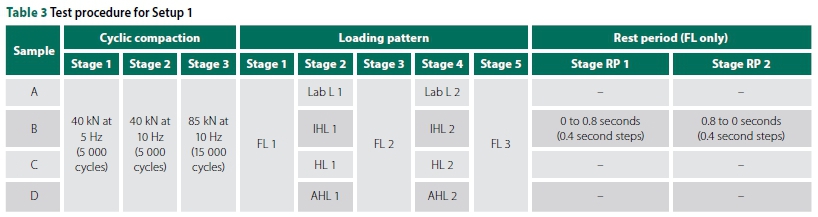
■ Adjusted Haversine Loading (AHL): a modified version of the HL pattern, where the load amplitude was reduced to closely match the ballast deformation caused by the FL pattern. Table 3 shows a summarised methodology for Setup 1. Each ballast sample was compacted in three layers following the rodding procedure outlined in the ASTM C29 standard (ASTM 2017). Further compaction was conducted in stages, yielding a total of 25 000 haversine cyclic loads. A preload of 1 kN was applied, with a compaction load of 85 kN - which was slightly greater than the calculated traffic load to prevent excess ballast deformation while simulating train operations. All samples were compacted to a void ratio of 43% with a target ballast mass of 112.5 kg. Data was captured at 100 Hz for all compaction stages. Table 4 compares each alternative loading pattern with the FL pattern, based on selected load properties. Graphic illustrations of a load cycle for each loading pattern are shown in Figure 8. Load applications (or load pulses), which represent the influence of wheel loads, are contained in a load cycle. Hence, the number of load applications vary for each loading pattern depending on their characteristics. After compaction, 500 000 load cycles were applied to each sample, with 100 000 load cycles applied in each stage (Stages 1 to 5) during the testing of the loading patterns (Table 4). The effect of rest periods (bogie spacing and time interval between trains) on the permanent settlement of the ballast layer was only assessed on Sample B using the FL pattern at 2.5 Hz. The number of cycles for each loading pattern (based on the duration rest period) was kept constant at 300 000 cycles.
Experimental Setup 2 -influence of confinement
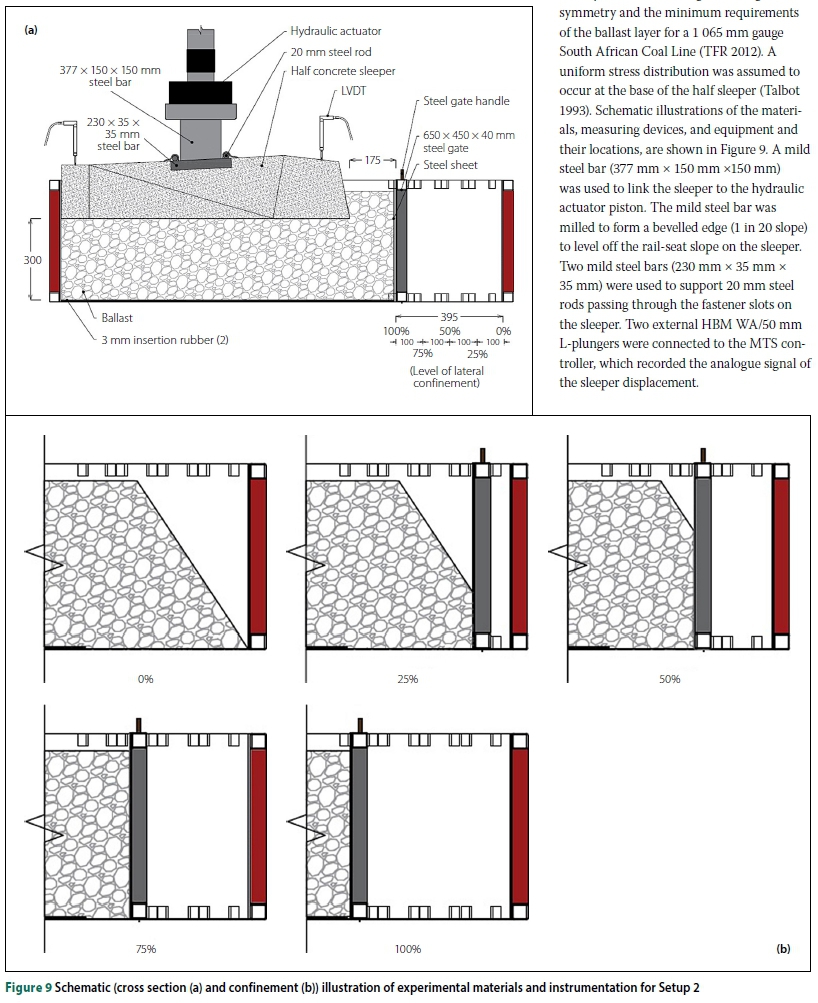
This setup involved a full-scale box test with an adjustable length to investigate the effect of lateral confinement on ballast settlement and breakage. The steel box, 1 630 mm long, 650 mm wide and 450 mm deep, was built to represent a half sleeper bay of a typical railway track, considering track longitudinal symmetry and the minimum requirements of the ballast layer for a 1 065 mm gauge South African Coal Line (TFR 2012). A uniform stress distribution was assumed to occur at the base of the half sleeper (Talbot 1993). Schematic illustrations of the materials, measuring devices, and equipment and their locations, are shown in Figure 9. A mild steel bar (377 mm x 150 mm x150 mm) was used to link the sleeper to the hydraulic actuator piston. The mild steel bar was milled to form a bevelled edge (1 in 20 slope) to level off the rail-seat slope on the sleeper. Two mild steel bars (230 mm x 35 mm x 35 mm) were used to support 20 mm steel rods passing through the fastener slots on the sleeper. Two external HBM WA/50 mm L-plungers were connected to the MTS controller, which recorded the analogue signal of the sleeper displacement.
Methodology (Setup 2)
The experimental procedures for setup were employed to quantify the breakage of ballast and to measure the settlement of the ballast layer while varying the Level of Lateral Confinement (LoLC). The term LoLC refers to the percentage of the ballast shoulder that is being confined in the lateral direction in the ballast box. The large steel box was designed to accommodate five levels of lateral confinement, namely 100% (fully confined), 75°%, 50%, 25°% and 0% (full ballast shoulder), as shown in Figure 9.
Fresh ballast samples were used for each LoLC. Ballast breakage was assessed at two locations in the ballast layer - at 100 mm and at 300 mm from the base of the box. Ten kilograms of ballast were painted sparingly with red and gold paint at 100 mm and 300 mm depths respectively, for each sample, to retain the surface friction of the ballast. The painted ballast was placed unconfined in the region below the sleeper loaded area, with the painted ballast at 300 mm, overlaid with normal ballast to achieve ballast breakage due to interparticle contact forces. Each sample was compacted in three layers following the rodding procedure outlined in the ASTM C29 (ASTM 2017) standard. Further compaction was conducted by applying 5 000 and 20 000 cyclic loads of 45 kN and 90 kN respectively, at 10 Hz using the MTS hydraulic actuator.
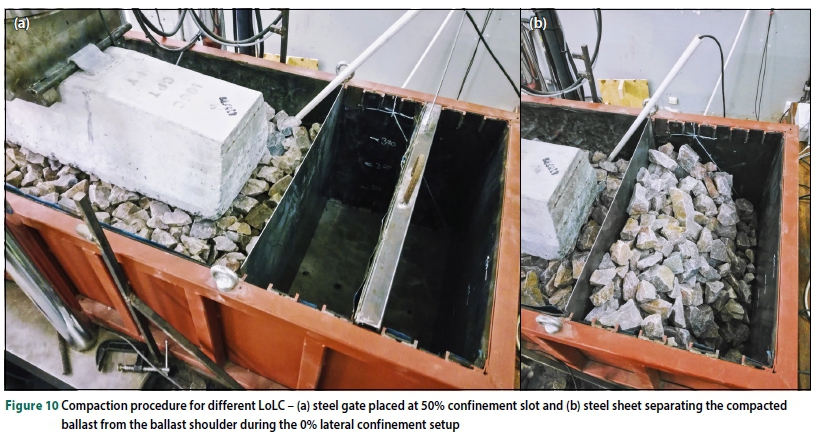
For a 75%, 50%, 25% and 0% lateral confinement, a 2.5 mm steel sheet (630 mm x 460 mm) was placed against the gate prior to compaction to maintain the compacted state of the ballast layer at 100% confinement. After compaction, the gate was removed and placed at the required confinement slot as shown in Figure 10(a). Figure 10(b) shows the steel sheet separating the compacted ballast and the ballast shoulder for 0% lateral confinement. The crib ballast was placed around the sleeper and rod compacted. The AHL pattern was applied at 10 Hz with a load range from 2.5 to 91 kN. The number of wheel load applications was 1 300 000 cycles (325 000 load cycles). Sieve analyses were conducted on the painted ballast at 100 mm and 300 mm at the beginning and end of the cyclic loading.
RESULTS AND DISCUSSION
Ballast compaction
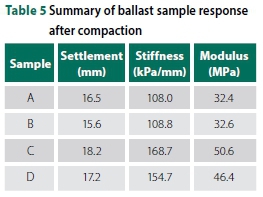
A summary of the ballast response for each sample after compaction is shown in Table 5. Possible factors affecting the changes in ballast response include varying particle shape and sizes and particle arrangement, among others. It is clear from the results that, even though the compaction resulted in similar total settlement, the final stiffness values differed too much to regard the samples as identical for comparative testing, hence the loading procedure in Table 3.
Loading conditions
Axial strain of ballast layer under different loading patterns
Figure 11 shows the percentage strain of each ballast sample subjected to alternating loading patterns of FL and the other loading patterns. Samples A and B exhibited similar strain behaviour comprising a significant increase in the rate of strain accumulation after 400 000 cycles. Possible reasons for this observation are:
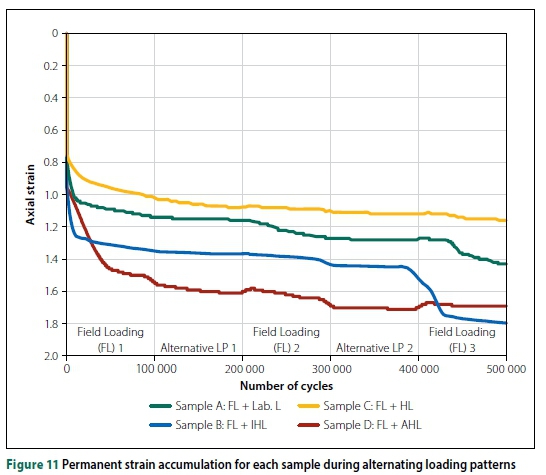
■ Both the Lab L and IHL patterns do not have the same quantity of load pulses per cycle when compared with the FL pattern.
■ Particle rearrangement or ballast breakage. Considering the degradation zones established by Indraratna et al (2005) (Figure 4), the zone that best describes the deformation behaviour of each ballast sample is the com-pressive stable degradation zone (CSDZ). In this zone, the particle movements are restricted with a high coordination number due to the high level of confinement.
To compare the rates of strain accumulation between the FL pattern and each alternative loading pattern after 100 000 cycles, linear relationships between the percentage axial strain and traffic in million gross tonnes (MGT) were expressed. The number of cycles can be expressed in terms of MGT using Equation 1. Plots of percentage axial strain against traffic for every 10.4 MGT (100 000 load cycles) were created to observe the strain accumulation rate between the FL and alternative loading patterns in Figure 12.
Two pairs of axial strains were compared for each plot, namely: Lab L 1 -FL 2 and Lab L 2 - FL 3 as shown in Figure 12(a). Linear regression lines were fitted to obtain the rate of strain accumulation (denoted as m - percentage strain/ MGT). For plots that indicate possible particle breakage or rearrangement (such as plot FL 3 after 4 MGT - Figure 12(a)), the rate of strain accumulation for the gradual portion, after breakage, was computed.
Sample A - field loading (FL) and laboratory loading (Lab L) patterns
Common properties of the FL and Lab L patterns include load amplitude and frequency. Dissimilar properties of these loading patterns include impulse and number of load pulses per load cycle (Table 4). The Lab L pattern is a generic sinusoidal waveform used to simulate train loading on ballast in the laboratory.
Figure 12(a) shows the plots of percentage axial strains of the ballast layer induced by the FL and Lab L patterns. It is expected that the rate of strain accumulation would decrease with traffic (number of cycles) for ideal situations, except in the event of weak spots in a track structure. However, there is a significant increase in strain rate after the transition from Lab L to FL for both pairs of axial strain, as FL yields a higher plastic strain of the ballast layer than Lab L. It is evident that the Lab L pattern is not capable of reproducing the strain under field conditions on the ballast layer. A major aspect of the loading pattern influencing the rate of plastic strain is the number of load pulses (or load applications). In this study, the number of load pulses refers to the number of load peaks within a load cycle as illustrated in Figure 5. Therefore, for a single load cycle, the FL pattern has four load pulses, while the Lab L pattern has one load pulse (which can also be referred to as one load cycle). Therefore, the amount of plastic strain produced per FL load cycle is significantly more than the amount of plastic strain produced per Lab L cycle.
Sample B - field loading (FL) and impulse haversine loading (IHL) patterns
Common properties of the FL and IHL patterns include load amplitude and load impulse. Dissimilar properties of these loading patterns include frequency and number of load pulses per load cycle. IHL is a modified loading pattern from the Lab L pattern, where the load impulse of the Lab L was increased to match the FL impulse per cycle.
Figure 12(b) shows the percentage axial strain plots of the ballast layer generated by the FL and IHL patterns. The FL pattern applied more load pulses than the IHL pattern; therefore the ballast layer deformed more under the FL pattern. Similar ballast strain behaviour is observed with Sample A (with the FL and Lab L patterns - Figure 12(a). However, comparing the plastic strains induced by the IHL and Lab L patterns, there is a notable increase in the rates of plastic strain due to an increase in load impulse.
Sample C - field loading (FL) and haversine loading (HL) patterns
Common properties of the FL and HL patterns include load amplitude, load impulse and number of load pulses per cycle. A dissimilar property of these loading patterns is the load frequency. The HL pattern consists of four load pulses per cycle. Each load pulse has equal load amplitude, as in the case of the FL pattern.
Figure 12(c) shows percentage axial strain plots of the ballast layer generated by the FL and HL patterns. The HL pattern in the first pair caused a higher strain rate than the FL pattern. However, in the second pair, the strain rate caused by the FL pattern was higher than the HL pattern, due to possible particle breakage or rearrangement. The frequency and load amplitude of intermediate load pulses per cycle differentiate these two loading patterns. It is important to note, however, that in a perfect scenario (i.e. absence of possible ballast breakage or rearrangement), the strain rate caused by the HL pattern marginally exceeds the strain rate caused by the FL pattern for the second pair. The driving factor for this behaviour is the effect of the additional load amplitude provided by the second and third load pulse in the HL pattern. This increases the stress level per cycle exhibited by the HL pattern, which generates more strain deformation than the FL pattern. Similar strain responses with these loading patterns were observed in preliminary tests.
Sample D - field loading (FL) and adjusted haversine loading (AHL) patterns
Common properties of the FL and AHL patterns include load impulse and number of load pulses per cycle. Dissimilar properties of these loading patterns include load amplitude and frequency. The AHL pattern consists of four load pulses per cycle. After conducting several preliminary tests with varying load amplitudes of the AHL pattern, a final load amplitude of 8.5 kN was employed. The frequency of this loading pattern was determined based on the changes to the load amplitude and impulse.
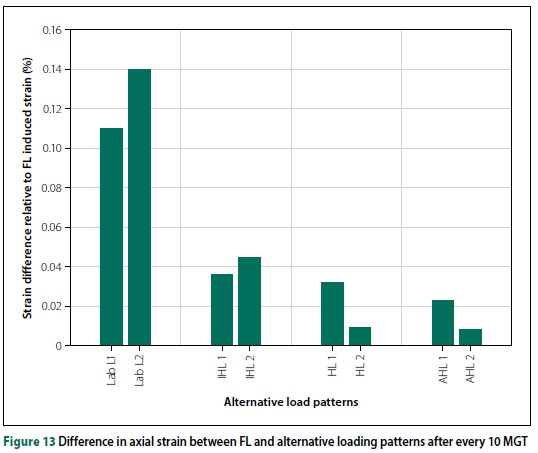
Figure 12(d) shows the plots of percentage axial strain of the ballast layer generated by the FL and AHL patterns. Both pairs of plots have slight differences in the rates of axial strain, with a maximum strain difference of 2.2% per MGT. The absence of a sudden increase in axial strain is possibly due to the absence of ballast breakage or rearrangement, and equal amounts of stress levels applied to the test sample which eliminate potential rearrangement or breakage of ballast particles. All the axial strain plots were zeroed to quantify the extent of axial strain after every 10 MGT. For each axial strain plot pair of the FL and alternative loading pattern, the difference in strain accumulation was computed. Figure 13 shows the percentage axial strain difference between the FL and alternative loading pattern after every 10 MGT. The AHL pattern had the lowest strain difference, while the Lab L had the highest strain difference in relation to the axial strains induced by the FL pattern. Although these results were obtained with a rigid bottom box, the settlement trend across the different loading patterns will be similar under ideal/actual track conditions. Under ideal track conditions, however, the magnitude of settlement will be greater, as there will be settlement of the underlaying layers, unlike the rigid bottom used during the laboratory tests.
Effect of load impulse on plastic strain of ballast layer
Increasing the loaded area of the Lab L pattern to match the FL pattern involved reducing the load frequency of a single Lab L cycle while maintaining a constant load amplitude. The comparison of the strain rates resulting from these loading patterns (Lab L and IHL) is valid, as the initial ballast layer response of each test sample after compaction was relatively similar (Table 5). Referring to Figure 13, the effect of load impulse is clearly observed from the decrease in strain difference between FL-Lab L 1 and FL-IHL 1.
Effect of rest periods on ballast permanent settlement
Figure 14 shows the ballast permanent deformation caused by different loading patterns characterised by varying rest period intervals. Low permanent settlements were obtained due to the nature of the subgrade (rigid bottom of the box - possibly stiff, rocky formation in practice), high levels of confinement and ballast compaction. In practice, ballast settlement can be measured using multi-depth deflectometers placed at each layer below the ballast layer.
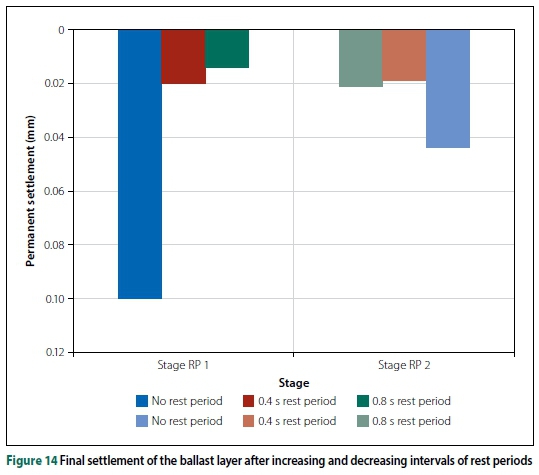
For Stage Rest Period 1 (Stage RP 1), taking the settlement caused by an FL pattern with no rest period as a reference, there was an 83% and 86% reduction in settlement for the FL pattern of 0.4 s and 0.8 s respectively.
For Stage Rest Period 2 (Stage RP 2), taking the settlement caused by an FL pattern with 0.8 s rest period as a reference, there was a 10% reduction in settlement caused by the FL pattern with 0.4 s rest period, while a 110% increase in settlement caused by an FL pattern without rest period was recorded. In summary, increasing the number of load pulses per given time increases the rate of ballast permanent settlement.
Boundary conditions
Permanent strain of ballast layer
Figure 15 shows the axial strain deformation of the ballast layer at each LoLC with a constant deviatoric applied stress across all samples. The term "0%" confinement refers to the percentage of the ballast shoulder that is confined in the lateral direction by the steel gate of the ballast box. It is important to note that the number of cycles (Figure 15) is represented as a quarter of the number of load pulses (which were 1.3 million) due to a four-wheel configuration. This adjustment to the number of cycles agrees with the settlement trends of the ballast layer, as it is expected that, at a million cycles, the settlement trend would have levelled off significantly where gradual degradation occurs with time, as seen from previous research conducted on ballast.
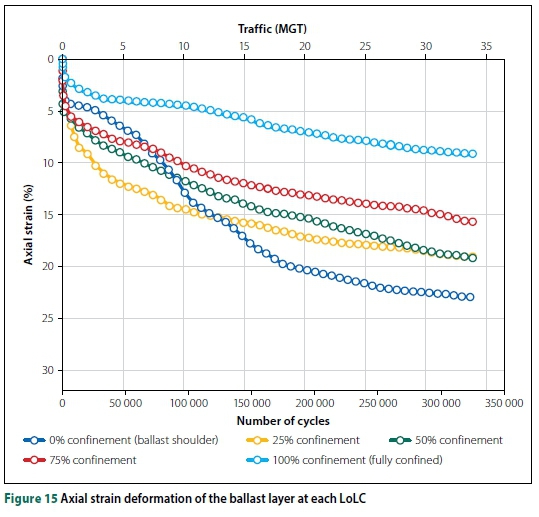
Discrepancies in Figure 15, such as irregular axial strain plot of the ballast layer at 0% confinement and similar final ballast strain for 25% and 50% confinements, could be due to slow deformation response after compaction and uncontrollable variations in ballast layer response (such as stiffness, modulus, etc) respectively.
Ballast degradation behaviour under cyclic loading for the various levels of lateral confinement can be classified into the degradation zones established by Indraratna et al (2005) following the explanations below:
■ Ballast degradation behaviour at 100% confinement can be classified within the compressive stable degradation zone (CSDZ) where a high lateral confinement significantly restricts particle movement, reorientation and rearrangement.
■ Reducing the lateral confinement to 75% increased the final ballast settlement by 19.3 mm - a 70% increase in ballast settlement. This led to increased deflection and permanent settlement per load pulse.
■ For 50% lateral confinement, the ballast layer had a permanent settlement of 57.6 mm - a 10.7 mm settlement difference (22.8% increase in vertical settlement) compared to the 75% confinement case. The permanent settlement of the ballast layer at 25% and 50% lateral confinement was similar at approximately 57 mm. Ballast degradation at 50% and 25% lateral confinement can be described by the particle behaviour and degradation that occur in the optimum degradation zone (ODZ).
■ High levels of ballast settlement were observed and recorded for the ballast layer at 0% confinement, with a vertical settlement of 68.9 mm. The degradation zone that best describes the behaviour of particles under cyclic loading at 0% confinement is the dilatant unstable degradation zone (DUDZ). Ballast particles in this zone are subjected to low confining lateral pressures under high deviatoric stresses which settle significantly with time. Particles had more room to displace, as the LoLC decreases under the influence of constant loading, leading to increased axial deformation and particle breakage.
Figure 16 shows linear and quadratic relationships between final permanent settlement and LoLC after 325 000 cycles (1.3 million load pulses). These relationships clearly indicate a general increase in ballast layer settlement with decreasing lateral confinement from 100% to 0% by 150%. A quadratic relationship has a better fit than a linear relationship.
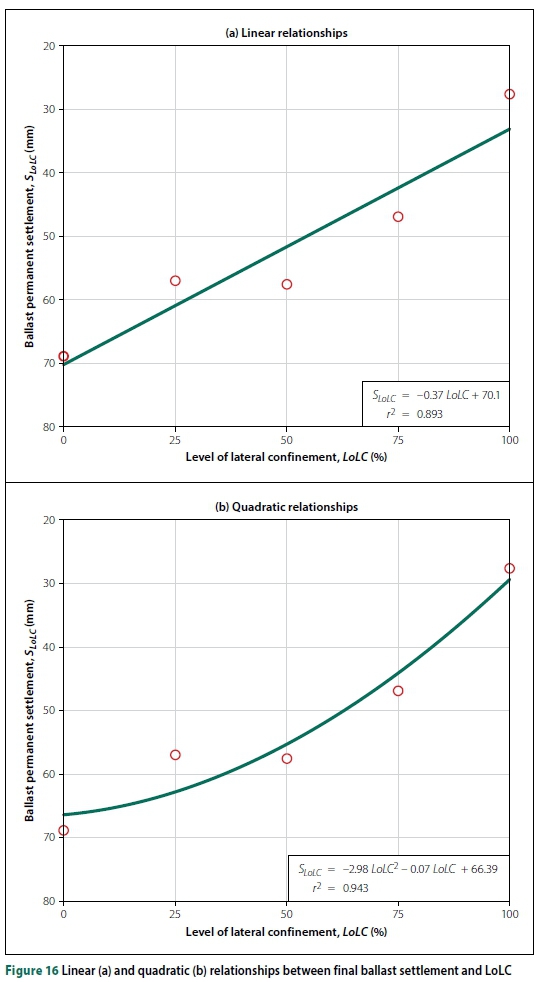
Considering the relationship between BBI and the effective confining pressure developed by Indraratna et al (2005) (Figure 4), the quadratic relationship between the permanent settlement and LoLC matches the BBI at lower vertical applied stress (qmax< 230 kPa).
Ballast breakage
The difference in mass before and after cyclic loading for each lateral confinement at 100 mm and 300 mm were compared as suggested by Abadi et al (2016) (Figure 17). This shows a clear indication that ballast breakage is significant closer to the sleeper, as well as for a ballast layer supported by a ballast shoulder without additional lateral confinement.
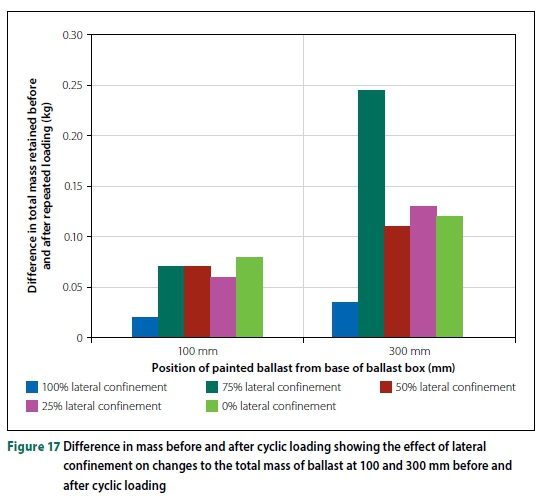
As expected, there was more particle degradation at 300 mm (particles closer to the sleeper) at 100% and 0% lateral confinement than at 100 mm (Table 6). However, for 75% to 25% lateral confinement there was more particle breakage for particles at 100 mm than at 300 mm, contrary to expectation.
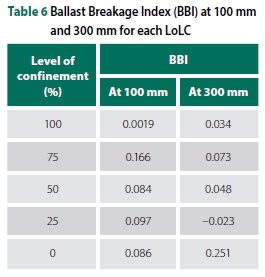
Possible contributing factors to the discrepancies in BBI values between levels of confinement could be:
■ Displaced painted ballast particles that are not within the sleeper loading region due to particle rearrangement during compaction. This movement is assumed to be more significant at 300 mm than at 100 mm, as high inter-particle contact forces decrease with depth (Han 2012).
■ The probability of the same particle passing through the appropriate sieve during sieve analysis after testing might be low in some instances. Furthermore, Abadi et al (2016) stated that the degree of particle breakage was not sufficiently detected by comparing PSDs before and after cyclic loading test.
■ The number of ballast particles (overall sample size) may not be statistically significant and might have contributed to the discrepancies in these results.
The most common forms of ballast breakage, among others, are attrition of asperities and corner breakage. Other forms of breakage are particle splitting along weak planes, and particle fatigue. A major governing factor stimulating ballast breakage is the fracture strength of individual ballast particles. Therefore, to ensure limited degradation of the ballast layer and track structure, obtaining high quality ballast particles on the railway track (especially heavy-haul lines) is necessary.
CONCLUSIONS
Laboratory ballast box tests were conducted on quartzite ballast to develop a suitable cyclic loading pattern which produces similar deformation rates as experienced in the field. The effects of varying lateral confinement on ballast layer strain and ballast breakage were also investigated. The following conclusions can be drawn from this study after the analysis and discussion of results:
■ The FL pattern had more load pulses than the Lab L patterns, which contributed to increased rates of axial deformation. Employing the FL pattern thereafter caused a significant increase in the strain rate due to possible ballast rearrangement or breakage under more load pulses per cycle.
■ Although the Lab L and IHL patterns have a single load pulse, there is a notable increase in the rate of axial strain of the IHL pattern compared to that of the Lab L pattern. This increase in strain rate is due to an increase in the impulse (loaded area) of the Lab L pattern as simulated by the IHL pattern.
■ The rate of strain accumulation of the HL pattern surpasses the FL strain rate marginally because of the increased loading effects of the second and third load pulses in comparison to their corresponding load pulses in the FL pattern.
■ By modifying different aspects of the HL pattern, the AHL pattern was developed. By decreasing the load amplitude of the HL pattern, this loading pattern (AHL) reproduced similar rates of strain compared to the FL pattern considered in this study. The AHL pattern is the most appropriate and suitable loading pattern to be implemented in laboratory tests when considering axial ballast strain. Employing this loading pattern will produce accurate and realistic results to predict ballast layer behaviour and track structure response during field loading.
■ The permanent settlement of the ballast layer decreased with an increase in the rest period interval between load cycles, and increased with a decrease in the rest period interval.
■ Ballast settlement increased by 150% when the lateral confinement in the ballast box tests was reduced from 100% to 0%.
■ A fully confined ballast layer prohibited particle breakage to a large extent, while significant ballast breakage occurred in ballast layers with a shoulder profile.
■ Ballast breakage indices were useful in quantifying the degree of ballast breakage by identifying changes at sieve size levels. Alternatively, obtaining the difference in total mass before and after cyclic loading provided a broad perspective on the degree of ballast breakage.
■ Obtaining high quality ballast particles on the railway track (especially heavy-haul lines) is necessary to limit track structure degradation through ballast breakage.
ACKNOWLEDGEMENTS
The authors would like to acknowledge and thank Transnet Freight Rail for their financial support, AfriSam Aggregate for donating the ballast, and Aveng Infraset for the supply of railway sleepers.
REFERENCES
Abadi, T, Le Pen, L, Zervos, A & Powrie, W 2016. Improving the performance of railway track through ballast interventions. Journal of Rail and Rapid Transit, 232(2): 1-17. [ Links ]
ASTM (American Society of Testing and Materials) 2017. C29/C29M-17a 2017. Standard Test Method for Bulk Density ("Unit Weight") and Voids in Aggregate. West Conshohocken, PA: ASTM International. [ Links ]
Aursudkij, B, McDowell, G R & Collop, A C 2009. Cyclic loading of railway ballast under triaxial conditions and in a railway test facility. Granular Matter, 11(6): 391-401. [ Links ]
Barksdale, R D 1972. Laboratory evaluation of rutting in base course materials. Proceedings, 3rd International Conference on the Structural Design of Asphalt Pavements, London, Vol 1, pp 161-174. [ Links ]
Ebrahimi, A, Tinjum, J M & Edil, T B 2012. Protocol for testing fouled railway ballast in large-scale cyclic triaxial equipment. Geotechnical Testing Journal, 35(5): 796-804. [ Links ]
Eisenmann, J 1972. Germans gain a better understanding of track structure. Railway Gazette International, 128(8): 305. [ Links ]
Grâbe, P J, Clayton, C R I & Shaw, F J 2005. Deformation measurement on a heavy haul track formation. Proceedings, 8th international Heavy Haul Conference, Rio de Janeiro, Brazil, pp 287-295. [ Links ]
Han, X 2012. The role of particle breakage on the permanent deformation of ballast. Master of Engineering, Research Thesis. Department of Civil, Mining and Environmental Engineering, University of Wollongong. [ Links ]
Hardin, B O 1985. Crushing of soil particles. ASCE Journal of GeotechnicalEngineering, 111(10): 1177-1192. [ Links ]
Huang, Y H 1993. Pavement Analysis and Design. Englewood Cliffs, NJ: Prentice Hall. [ Links ]
Huang, H, Shen, S & Tutumluer, E 2009. Sandwich model to evaluate railroad asphalt trackbed performance under moving loads. Transportation Research Record, 2117: 57-65. [ Links ]
Indraratna, B & Ionescu, D J 2000. State of the art large scale testing of ballast. In Railway Technical Society of Australasia (Eds). CORE 2000 Railway Technology for the 21st Century, pp 24.1-24.3. [ Links ]
Indraratna, B, Lackenby, J & Christie, D 2005. Effect of confining pressure on the degradation of ballast under cyclic loading. Geotechnique, 55(4): 325-328. [ Links ]
Indraratna, B, Thakur, P K & Vinod, J S 2010. Experimental and numerical study of railway ballast behaviour under cyclic loading. International Journal of Geomechanics, 10(4): 136-144. [ Links ]
Knutson, R M 1976. Factors influencing the repeated load behaviour of railway ballast. PhD Thesis. University of Illinois at Urbana-Champaign. [ Links ]
Lackenby, J, Indraratna, B & McDowell, G 2007. The role of confining pressure on cyclic triaxial behaviour of ballast. Geotechnique, 57(6): 527-536. [ Links ]
Lade, P V, Yamamuro, J A & Bopp, P A 1996. Significance of particle crushing in granular materials. ASCE Journal of Geotechnical Engineering, 122(4): 309-316. [ Links ]
Lekarp, F & Dawson, A 1998. Modelling permanent deformation behaviour of unbound granular materials. Construction and Building Materials, 12(1): 9-18. [ Links ]
Lekarp, L, Isacsson, U & Dawson, A 2000. State of the art. II: Permanent strain response of unbound aggregates. Journal of Transportation Engineering, 126(1): 76-83. [ Links ]
Li, D 1994. Railway track granular layer thickness design based on subgrade performance under repeated loading. PhD Thesis. Amherst, MA: University of Massachusetts. [ Links ]
Li, D & Selig, E T 1996. Cumulative plastic deformation for fine-grained subgrade soils. Journal of Geotechnical Engineering, 122(12): 1006-1013. [ Links ]
Li, D, Hyslip, J, Sussmann, T R & Chrismer, S M (Eds) 2015. Railway Geotechnics. Boca Raton, FL: CRC Press/Spon Press. [ Links ]
Liu, J & Xiao, J 2010. Experimental study on the stability of railroad silt subgrade with increasing train speed. Journal of Geotechnical and Geoenvironmental Engineering, 136(6): 728-740. [ Links ]
McDowell, G, Bolton, M & Robertson, D 1996. The fractal crushing of granular materials. Journal of the Mechanics and Physics of Solids, 44(12): 2079-2101. [ Links ]
Powrie, W & Priest, J 2011. Behaviour of ballasted track during high speed train passage. High Speed Track, Railways Day. Presentation given at the University of Southampton, 15 February 201. [ Links ]
Powrie, W, Yang, L A & Clayton, C R 2007. Stress changes in the ground below ballasted railway track during train passage. Journal of Rail and Rapid Transit, 221(2): 247-262. [ Links ]
Priest, J A, Powrie, W, Yang, L, Grabe, P J & Clayton, C R I 2010. Measurements of transient ground movements below a ballasted railway line. Geotechnique, 60(9): 667-677. [ Links ]
Qian, Y, Tutumluer, E & Huang, H 2011. Ballast vibrations and deformations due to different train loading scenarios studied using the discrete element method. Proceedings, 5th International Symposium on Environmental Vibration (ISEV 2011), Chengdu, China, 20-22 October 2011, pp 613-619. [ Links ]
Razouki, S S & Schanz, T 2011. One-dimensional consolidation under haversine repeated loading with rest period. Acta Geotechnica, 6(1): 13-20. [ Links ]
Sadeghi, J M 2008. Experimental evaluation of accuracy of current practices in analysis and design of railway track sleepers. Canadian Journal of Civil Engineering, 35: 881-893. [ Links ]
Sadeghi, J M & Shoja, H 2012. Impact of superelevation deficiencies on the loading pattern of railway sleepers. Journal of Rail and Rapid Transit, 227(3): 286-295. [ Links ]
Selig, E T & Waters, J M 1994. Track Geotechnology and Substructure Management. London: Thomas Telford. [ Links ]
Shahin, M A, Indraratna, B & Salim, W 2007. Stabilisation of granular media and formation soil using geosynthetics with special reference to railway engineering. Ground Improvement, 11(1): 27-43. [ Links ]
Shenton, M J 1984. Ballast Deformation and Track Deterioration. Track Technology. London: Thomas Telford. [ Links ]
Stewart, H E 1986. Permanent strains from cyclic variable amplitude loadings. ASCE Journal of Geotechnical Engineering, 112(6): 646-660. [ Links ]
Suiker, A S J 2002.The mechanical behaviour of ballasted railway tracks. PhD Thesis. Netherlands: Delft University of Technology. [ Links ]
Sun, Q D, Indraratna, B & Nimbalkar, S 2014. Effect of cyclic loading frequency on the permanent deformation and degradation of railway ballast. Geotechnique, 64(9): 746-751. [ Links ]
Talbot, A N et al 1933. Stresses in railroad track. Report of the Special AREA-ACE Committee on Stresses in Railroad Track, 6th Progress Report. AREA Proceedings, 45: 66-848. [ Links ]
TFR (Transnet Freight Rail) 1998. S406. Specification for the Supply of Stone. Johannesburg: TFR. [ Links ]
TFR (Transnet Freight Rail) 2012. Infrastructure Engineering. Manual for Track Maintenance. Johannesburg: Transnet. [ Links ]
Yang, L A, Powrie, W & Priest, J A 2009. Dynamic stress analysis of a ballasted railway track bed during train passage. Journal of Geotechnical and Geoenvironmental Engineering, 135(5): 680-689. [ Links ]
Zakeri, J & Sadeghi, J 2007. Field investigation on load distribution and deflection of railway track sleepers. Journal of Mechanical Science and Technology, 21(12): 1948-1956. [ Links ]
 Correspondence:
TIMOTHY JIDEANI
Department of Civil Engineering
University of Pretoria
Pretoria 0002
South Africa
T: +27 11 844 1420
E: timothy.jideani@hatch.com
PROF HANNES GRABE
Transnet Freight Rail Chair in Railway Engineering
Department of Civil Engineering
University of Pretoria
Pretoria 0001
South Africa
T: +27 12 420 4723
E: hannes.grabe@up.ac.za

TIMOTHY JIDEANI, who holds an MEng degree from the University of Pretoria, Is a junior civil and perway engineer In the Rail & Transit Business Unit at HATCH. He is an Associate (Graduate) Member of the South African Institution of Civil Engineering (SAICE), and is registered with the Engineering Council of South Africa (ECSA) as a Candidate Engineer.

PROF HANNES GRABE (PrEng, FSAICE), who holds a PhD degree from the University of Southampton, is a civil engineer with experience in the fields of track technology, geotechnology, advanced laboratory testing, field investigations, maintenance models and numerical analysis of track structures. He Is currently employed by the University of Pretoria as Associate Professor: Transnet Freight Rail Chair in Railway Engineering, where he lectures under- and post-graduate courses in railway engineering. He is also responsible for railway research, as well as for continuing professional development in the form of short courses presented to industry.

