


Services on Demand
Article
 English (pdf)
 Article in xml format
 Article references
Indicators

Related links
-
 Cited by Google
 -
 Similars in Google
Share

 Permalink
Journal of the South African Institution of Civil Engineering
On-line version ISSN 2309-8775
Print version ISSN 1021-2019
J. S. Afr. Inst. Civ. Eng. vol.61 n.4 Midrand Dec. 2019
http://dx.doi.org/10.17159/2309-8775/2019/v61n4a2
TECHNICAL PAPER
Economic benefit of ensuring uninterrupted water supply during prolonged electricity disruptions – City of Tshwane case study
J C Potgieter; C Herold; M van Dijk; J N Bhagwan
ABSTRACT
Mitigating the impact of electricity disruptions on water supply was investigated as a case study on the City of Tshwane. This study found that current institutional arrangements between electricity suppliers (Eskom), water service providers and water service authorities are insufficient. Therefore, a Risk Analysis and Mitigation Framework of Integrated Water and Electricity Systems, or RAMFIWES, was developed. Risks associated with water supply interruptions due to electricity disruption events were analysed. Risk categories that were addressed are short-term disruptions of less than one day, medium-term disruptions of up to a week and long-term electricity disruptions up to a month or even longer. The direct economic benefits of ensuring uninterrupted water supply in the event of electricity disruption events were analysed through cost versus benefit analyses. It was found that the direct benefit/cost ratio of supplying water during electricity disruption events is 5.6 for wet-industries and an exceptional 117 for other economic sectors in Tshwane. The overall benefit/cost ratio is 15.5. This benefit is possible at a low increase in the normal municipal bills of only 0.5%.
Keywords: electricity disruptions, water supply, risk analysis, load shedding
INTRODUCTION
The water supply sector is at the core of economic growth and social well-being. Water is indispensable to human survival - it is a critical component required for the generation of power, it is required for the growing of crops and it is a basic natural resource for daily existence. In the modern-day South African urban environment, without water there will be insufficient electricity, very little industry, no agriculture and no cities. Electricity disruptions can cause water supply interruptions which will have dire social and economic consequences for densely populated urban areas (ADB 2009).
Water and electricity are intrinsically linked - the one cannot be supplied without the other. This is especially true in South Africa where 85% of the country's electricity is supplied by coal power stations (Pollet et al 2016), and urban water supply, especially in-land, necessitates highlift pumping systems over great distances. This link is often referred to as the Energy-Water Nexus (Copeland & Carter 2017). Electricity is used in the water sector for pumping, treatment of raw water, distribution of potable water, collection and treatment of wastewater, and water discharge.
Until recently in South Africa, the electricity supply used in the water sector was considered safe, and the risk of electricity supply failure did not play a significant role in the design and operation of water supply and distribution systems. Load-shedding prompted the Water Research Commission (WRC) of South Africa in 2010 to conduct a high-level study of the effect of electricity disruptions, specifically load-shedding, on water supply (Winter 2011). The current study (this paper), also funded and initiated by the WRC, explores the implications in greater detail and takes account of new concerns that have arisen since 2011. These new concerns relate to the high risk of prolonged electricity disruption events that the water supply sector is currently not sufficiently prepared to mitigate. In recent years there have been numerous water supply interruptions in Gauteng due to localised electricity disruptions not linked to scheduled load-shedding, the most recent being the explosion at a City Power substation that resulted in an electricity disruption affecting Rand Water's Eikenhof Pump Station (News24 2018). Subsequently, large parts of Gauteng, and even parts of North West, were affected by water supply interruptions. This electricity disruption was dealt with relatively quickly due to the nature of the electricity disruption event. If the event had been more severe, there would have been longer-duration water supply interruptions.
To put the risk of water supply interruptions due to electricity disruption events into context: Rand Water's current Number 1 strategic risk on its list of Top 10 Strategic Risks, published in its 2017 Annual Report, is the availability, reliability, reliance and quality of electricity supply, critical spares and chemicals (Rand Water 2018). The electricity requirement of the Gauteng water supply system is particularly high due to the elevation difference from the Vaal Dam and the Witwatersrand escarpment (the maximum pump head from the Vereeniging Wastewater Treatment Works (WTW) over the escarpment is roughly 320 m). Although this is not necessarily the case for other urban water supply systems in South Africa, all supply systems require electricity for treatment, supply and booster pumps.
Risks related to electricity disruption events were investigated using the City of Tshwane as a case study. The main objectives of this study were to:
■ Evaluate the risk of electricity disruption and its impact on water supply failure.
■ Review current institutional arrangements in place to mitigate the risk.
■ Propose institutional guidelines (pertaining to system management, operation and design principles) for electricity suppliers, Water Service Providers (WSPs) and Water Service Authorities (WASs).
This study found that the current institutional arrangements of South Africa's electricity suppliers, WSPs and WSAs are insufficient to mitigate the effect of long-term electricity disruptions on water supply. Inadequate preparation to deal with risks will have dire consequences, including prolonged water supply interruptions if an electricity disruption event occurs (especially medium- to long-term disruption events with durations of longer than a day). This is better illustrated through the following equation (WHO 2007):
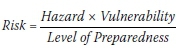
As part of the Tshwane case study it was found that the current level of preparedness to mitigate the impact of electricity disruptions on water supply is more suited to accommodate short-term electricity disruption events (e.g. load-shedding with a duration of less than one day). There is a lack of preparation for medium- to long-term duration electricity disruption events. Therefore, medium- to long-term duration electricity disruption events pose a high risk for Tshwane, from both economic and public well-being points of view.
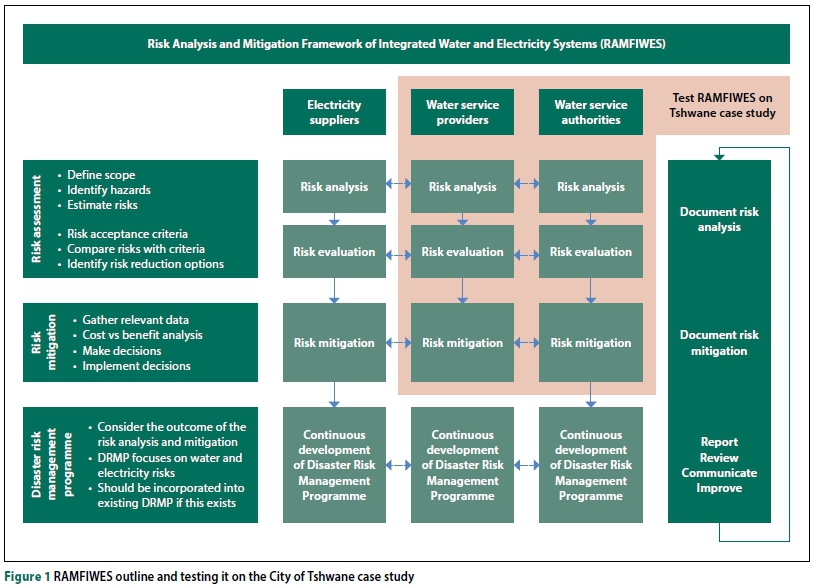
No guidelines, frameworks or government policies to aid electricity suppliers, WSPs and WSAs in the development of Disaster Risk Management Plans to mitigate the impact of electricity disruptions on water supply were found (the study concluded that there are none). Subsequently the Risk Analysis and Mitigation Framework of Integrated Water and Electricity Systems (RAMFIWES) was developed. The Tshwane case study was also used to test the part of RAMFIWES that deals with WSPs and WSAs (refer to Figure 1 for the outline of RAMFIWES).
The scope of the case study was confined to the City of Tshwane, which houses 3.1 million residents (CoT 2016). The city generates an annual Gross Domestic Product (GDP) of R202 billion (Tshwane Economic Development Agency 2015) and has an average water demand of 843 M£/day (GLS Consulting 2017) which includes 193 M£/d losses (CoT 2015a). It goes without saying that addressing high real-water losses in the distribution system to decrease water demand is an essential part of ensuring uninterrupted water supply during electricity disruptions.
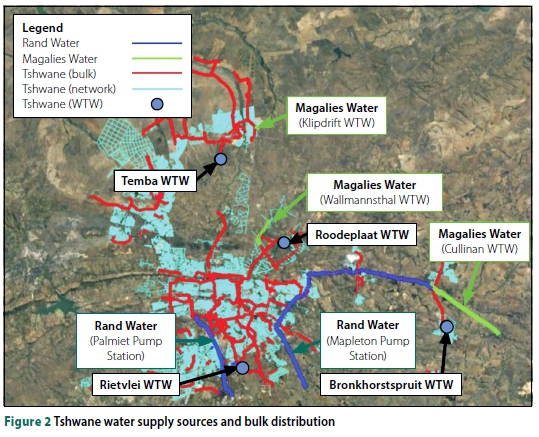
Some 81% to 86% of Tshwane's water supply is derived from Rand Water and Magalies Water (CoT 2015b); the rest being supplied from own sources at Rietvlei Dam, Roodeplaat Dam and various dolomitic springs and wells (GLS Consulting 2017). Figure 2 illustrates the water network, including the WSPs' water infrastructure.
METHODOLOGY
Background information on Tshwane's demographics, economic activity, and water and electricity infrastructure was obtained through consultation with officials from Tshwane's water and electricity departments and from various readily available data sources (such as Tshwane's Integrated Development Plan and its annual financial reports) (CoT 2016; CoT 2015c).
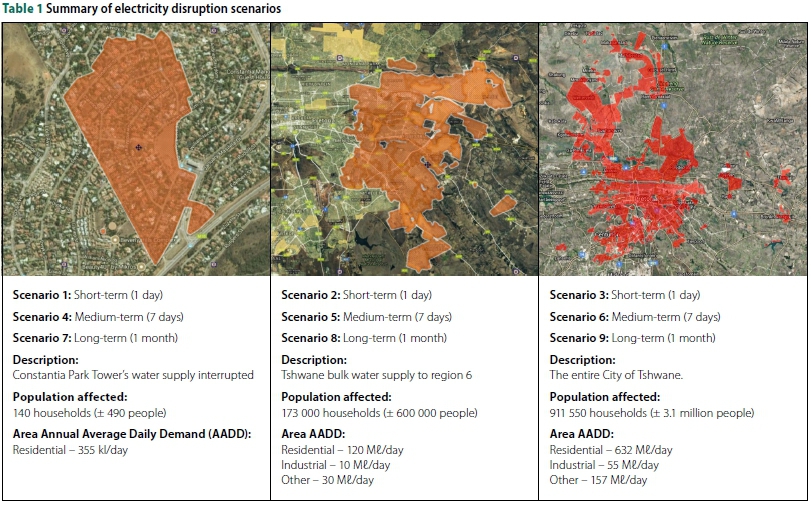
Various electricity supply disruption events that would result in water supply interruptions in Tshwane were identified and grouped according to their areal extent, duration and probability of occurrence. These risks were based on literature sources and discussions with representatives from Eskom, Tshwane and Rand Water.
The impact of these events on water supply were assessed by considering three different Tshwane supply areas ranging in size from:
■ a small residential area
■ one of Tshwane's six regions comprising mixed residential, commercial and industrial water uses
■ the whole of Tshwane.
One-day, seven-day and thirty-day durations were examined for each selected size of supply area, giving a total of nine scenarios.
Mitigation options to sustain a minimum domestic water supply and protect most of the economic activity were identified and costed. Effective mitigation requires infrastructure development and operation, as well as effective implementation of institutional guidelines.
The benefit of mitigation was defined by the reduction in the loss of GDP generation achieved. A cost versus benefit analysis was done to determine the economic viability of mitigating the risks.
ELECTRICITY DISRUPTION SCENARIOS ANALYSED
Different types of electricity disruptions and their impact on water supply were analysed in order to determine if the options identified to mitigate the risks would be practically feasible and economically viable.
The three electricity disruption areas and electricity disruption durations were analysed. A summary of the electricity disruption scenarios is given in Table 1 on page 21.
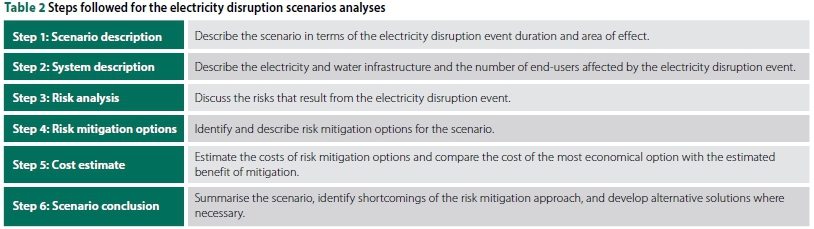
The approach used to analyse the impact of electricity disruption on water supply for the nine scenarios is described in Table 2.
MITIGATION OPTIONS
Loss of electricity supply has an immediate impact on the functioning of wastewater treatment works and raw sewage pumping systems, with consequent overflow of untreated effluent. There is also an impact on the ability to deliver water to elevated tanks supplying water to high-lying areas. Longer-term electricity supply disruption results in reduction or total loss of water supply even to lower-lying areas fed by gravity from reservoirs.
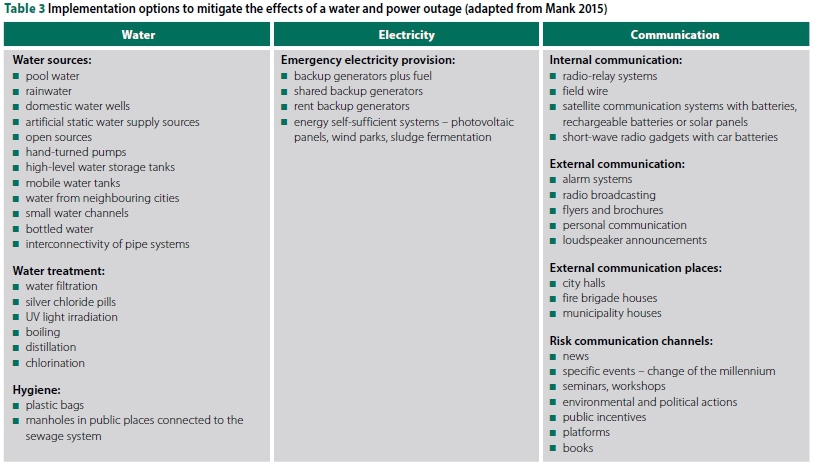
Mitigation options range from water supply by road tankers, provision of additional storage, provision of additional interconnectivity of pipe systems and the use of standby generators to make use of existing infrastructure (see Table 3 for more options). The latter (standby generators) proved to be the cheapest and most effective. This despite the fact that the already high water losses, increased by the elevated water pressure during periods of restriction, have to be fulfilled before water can be delivered to end users. Another important factor is that it is virtually impossible to provide a minimum water supply (25 £/capita per day) to all domestic users without affording upstream users the opportunity to withdraw far more than their quota. Even in the highly unlikely event of 100% cooperation, it is impossible to implement effective water restrictions within the time spans of typical electricity disruption events.
The costs associated with mitigating the effect of each of the electricity disruption scenarios were scaled up (for scenarios that only considered smaller sections of Tshwane) and applied to the entire Tshwane to obtain the total cost of mitigating each of the risks identified.
Finally, the scaled up costs were compared to the economic benefit of ensuring uninterrupted water supply to Tshwane.
COST / BENEFIT ANALYSIS
The cost of meeting minimum water supply requirements during electricity disruption events was compared to the economic and other benefits. The cost of mitigating each electricity disruption event type (load-shedding, distribution failure and blackout) was compared to the benefit, taking account of the probability of occurrence of the event.
The costs that will result from an electricity disruption event that causes water supply interruptions can be either direct or indirect.
Direct costs are due to interruption of the economic activity of the City of Tshwane. The benefit of mitigation is then the reduction in these costs. In such cases, it is possible to calculate the net benefit, benefit/cost ratio and the present value net benefit.
For scenarios that do not have a direct benefit with which to compare costs, the economic analyses have been confined to calculating the levelised annual cost and comparing this with the volume of water normally supplied to all Tshwane consumers to calculate a unit cost per kl. This facilitates direct comparison with normal water accounts to place decision-makers in a position to assess the implications.
The following were considered for the cost-benefit analysis:
■ The city's water demand
■ The city's water supply
■ The city's wastewater treatment
■ The type, probability and duration of electricity disruption events
■ The direct and indirect cost of the electricity disruption event.
Mitigation options were aimed at meeting the minimum requirements for the following water uses:
■ Basic minimum supply for domestic water use
■ Prevention of spillage of untreated sewage
■ Sustaining GDP-generating activities. The following assumptions were made:
■ A 30-year life has been assumed for the standby generators. Although the life of mechanical/electrical plant is normally taken as 15 years (DPLG 2009), a longer life is feasible, since the plant will seldom be used, and then only for a relatively short duration.
■ For similar reasons, the annual maintenance cost for generators has been reduced to 1% of capital.
■ An annual net discount rate of 3% has been assumed. This value is considered appropriate for a large entity like Tshwane, since the net discount rate should reflect the net rate (i.e. after inflation) that Tshwane can expect to earn on a similar investment if it did not invest in the infrastructure required to ensure uninterrupted water supply during electricity disruption events.
■ The economic outlook period has been taken as the recurrence interval of each power outage event. Where necessary, the remaining value of capital works at the end of the outlook period has been credited before being discounted to a present value. A straight-line depreciation of capital over the life of the works has been used for this purpose. In instances where there are no quantifiable direct economic benefits, such as meeting the minimum water supply requirement for domestic users, or prevention of sewage overflow, the outlook period has been set equal to the life of the capital works.
Costs have been expressed as cents per k£ of normal billed consumption for comparative purposes. In the cases of scenarios covering power outages in small and medium-sized areas, the costs were scaled up to cover the whole of Pretoria.
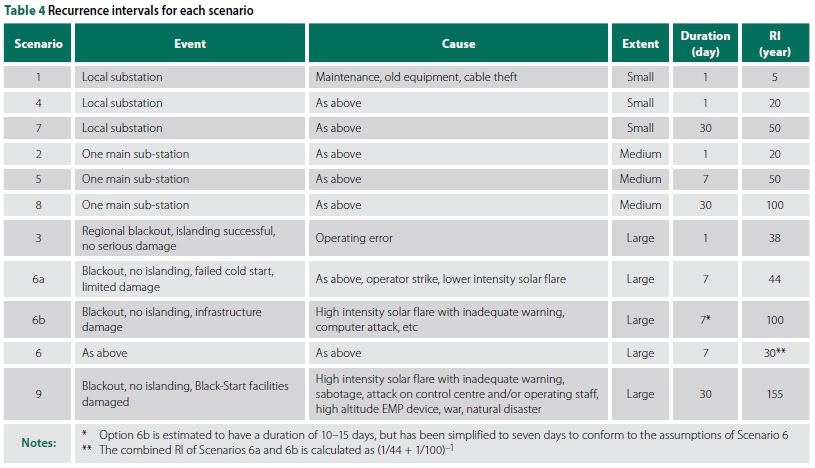
Table 4 shows the estimated recurrence intervals for each scenario.
Interestingly, some of the severest blackout events are the easiest to assign RIs to. For example, the massive solar flare (the Carrington event) that occurred in 1859 (Cliver & Dietrich 2013) is well documented, and two lesser events that are still considered to be of sufficient magnitude to hold grave consequences for modern electricity supply systems also occurred in the late 19th and early 20th centuries, when electricity generation and supply systems were still in their infancy. The possibility of the detonation of an ElectroMagnetic Pulse (EMP) device above the ionosphere is also not implausible, since both the United States and the USSR tested such devices in 1962, with devastating results. Considering that between 1945 and 1980 over 500 nuclear weapons tests were conducted (Beck & Burton 2002), the prospect of any nation which possesses nuclear weapons detonating such a device in the upper atmosphere is an all too real possibility.
Basic minimum domestic water supply
Meeting the basic minimum water requirement of residents is a non-negotiable cost. The cost, in terms of both human suffering and economic collapse, is simply too massive to ignore. A basic minimum domestic supply of 25 I per capita per day has been used (CSIR 2005). However, achievement of this is assumed to require a supply at the top end of the distribution system of twice this amount to account for users higher up the system being able (even unconsciously) to abstract well above their quota, which would leave downstream residents with no water at all. The calculated minimum water to be supplied to domestic consumers during electricity disruptions is 451 Ml/day at 50l per capita per day (this includes real-water losses which will have to be supplied additionally).
Pumping water into elevated towers and reservoirs is considered to be part of the cost of meeting the basic minimum domestic water supply.
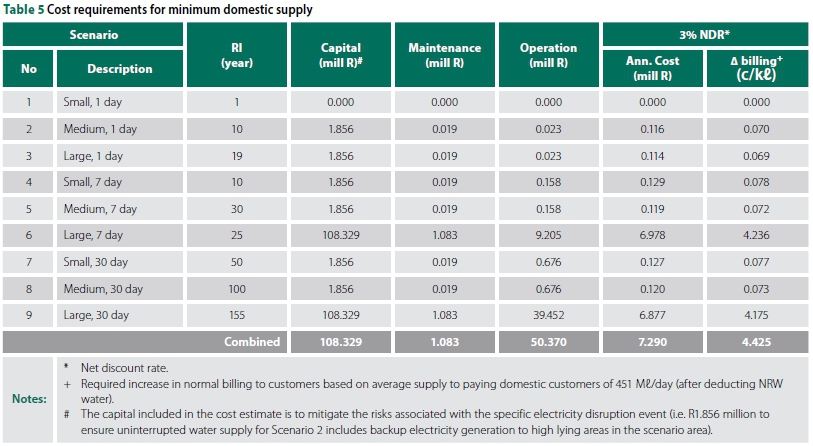
The cost requirements for each scenario are shown in Table 5.
It is important to note that, once the most severe event has been catered for (Scenario 9), all of the capital and capital maintenance costs for the lesser events are automatically covered. However, the operating cost for each of the lesser events must be divided by its RI and accumulated to arrive at the total annual operating cost, which is added to the discounted capital and capital maintenance cost. Hence the additional charge to be borne by domestic water users paying for their services would come to 4.4 c/k£, which amounts to an increase of 0.44% (assuming a water tariff of R10/k£ (Province of Gauteng 2017)). This is a small price to pay for protection against the social and political consequences of a national blackout.
There is a strong likelihood of violent social upheaval inherent in a national blackout. Moreover, such an event also has a high probability of occurrence (1:25 year RI for a seven-day outage and 1:155 RI for a 30-day outage, giving a combined RI of 1:22 years). That represents a 4.5% probability of occurrence in any one year and nearly a one in six chance of occurrence within the term of office of a politician. The small economic cost of protecting society against such a calamity pales into insignificance against such an enormous risk, which has an almost incalculable associated cost and high probability of occurrence.
Maintaining industrial activity
R22.6 billion of Tshwane's GDP is derived from the manufacturing sector, much of which is from wet industries (Tshwane Economic Development Agency 2015).
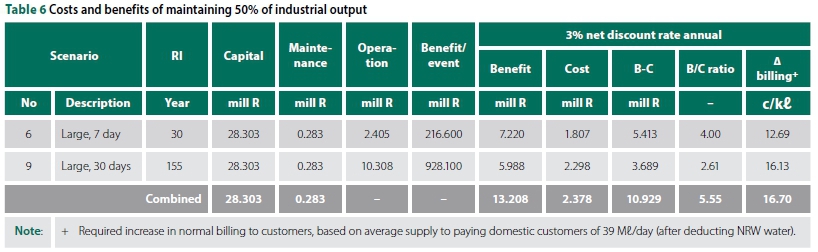
Since Rand Water supplies 76% of Tshwane's water supply (CoT 2015b), the industrial water supply is only threatened by an event that shuts down power supply to both Tshwane and Rand Water. Since wet industries are highly dependent on water supply, process utilisation would be the dominant water use and there is little flexibility to reduce demand. Hence the simplifying assumption has been made that the full industrial water demand would have to be met. However, it is unreasonable to expect that, even after providing a full water supply, industrial activity will not be constrained by labour stay-aways and late arrivals due to transport difficulties during an electricity disruption event. Also, some users may not have enough power-generating capacity to maintain full operation. Accordingly, the assumption has been made that only 50% of industrial output could be maintained. The calculated minimum water to be supplied to maintain 50% of industrial output during electricity disruptions is 39 Ml/day (including real-water losses).
The most feasible cause for a disruption of this areal extent and duration would be a national blackout, i.e., Scenarios 3, 6 or 9. Moreover, in view of the available reservoir storage such an event would have to persist for longer than one day. This rules out Scenario 3, leaving Scenarios 6 and 9. The cost requirements for each scenario are shown in Table 6.
The combined increase in the cost per k£ of water supplied to paying industrial water users comes to 16.70 c/kl, which is 1.7% of the normal water charge. This is higher than was the case for domestic users, since the assumption here is that the full industrial demand would have to be provided to preserve 50% of the industrial output. Since the capital works will have to be paid off over a shorter period than used in the longer discounting period used to make valid comparisons, the actual change in the billing will be greater than 16.7 c/k£ while the capital is being paid off, but thereafter for the rest of the life of the works the capital redemption cost will drop to zero. Nevertheless, at 1.7% the increase in the billing will remain small.
The benefit/cost ratio of 5.6 is very attractive. Moreover, aside from the economic advantage, maintaining the employment of labourers working in this sector would hold the advantage of sustaining their families.
Naturally, the provision of a basic minimum water supply to all domestic users is essential, since otherwise, at best, absenteeism due to people desperately looking for water will temporarily shut down all economic activity.
Maintaining other sectors' economic activity
R179.4 billion of Tshwane's annual GDP is attributable to sectors such as finances, commerce and other services that for most of the time are impervious to restrictions in water supply (CoT 2015c). However, below a critical level the work force of these enterprises will be affected, resulting in absenteeism and impairment of production. It is reasonable to assume that this point will be reached once domestic water supply falls below a basic minimum requirement.
For the same reasons as before, water supply to these sectors would only be disrupted by a wide area power blackout affecting both Tshwane and Rand Water. It is assumed that water supply to these sectors, for which water is not a part of their product stream, can be reduced by 75% before serious human impact affects business. These sectors are less dependent on labourers, and their wealthier employees would be better able to overcome transport difficulties than is the case for industries. Moreover, the electricity requirements to sustain core operations are more easily met by standby generators, many of which would already be in place after the long sequence of rolling blackouts. Hence, the assumption has been made that 75% of the GDP-generating activities of these sectors could be maintained. The calculated minimum water to be supplied to maintain 75% of other sectors' activity during electricity disruptions is 45 Ml/day (including real-water losses).
The capital, annual capital maintenance and operating costs for the standby power generation plant required to maintain 75% of the GDP output of other economic sectors (excluding industries) for each scenario are shown in Table 7.
The combined increase in the cost per k£ of water supplied to paying water users comes to 0.83 c/kl, which represents a negligible increase of 0.08% of the normal paid water charge.
The benefit/cost ratio of 117 and the annual net benefit of R156 million are both huge, indicating that the small cost of protecting the other sectors of the economy is well worth the investment.
The large disparity between the benefits derived from these economic sectors, compared with those of the wet industries, is immediately apparent. Moreover, at only 30 Ml/day (25% of normal demand), the estimated minimum water requirement to sustain these activities is frugal. In terms of minimum water use these sectors contribute 19 times the economic contribution per unit of water used. Under normal circumstances this comparison is immaterial and the disparity in the overall economic contribution much smaller. But when water supply is severely constrained it is a much more important consideration. It is therefore considered extremely important to provide enough emergency water supply to sustain these sectors.
Underpinning this is the imperative to ensure a basic minimum water supply to domestic users. Without this the fabric of society will collapse, and with it all economic activity.
OVERALL IMPACT ON POTABLE WATER BILLING
The overall average increase in potable water costs, taking account of the proportions of water supplied to each of the previously discussed three broad groupings (domestic, industrial and other economic sectors), comes to 5.0 c/kl, or 0.5% of normal paid billing. This is the estimated cost to secure a minimum basic water supply to domestic users, sustain 50% of industrial economic output and 75% of the output of other economically active sectors.
The associated overall annual cost is estimated at R11.0 million, yielding an annual benefit of R170.46 million. Hence the annual net benefit comes to R159.45 million, with an extremely high benefit/cost ratio of 15.5.
The very high benefit/cost ratio indicates rare resilience against variations in the estimates of cost and benefit. A sensitivity analysis was done to determine the robustness of the cost versus benefit analysis outcome; the following examples are given to illustrate this:
Doubling the cost or reducing the benefit by half
Doubling the cost estimate (to R22 million annually) or reducing the estimated benefit by half (to R85 million annually) would still yield a benefit/cost ratio of 7.7.
Doubling the cost and reducing the benefit by half
If the estimated cost of mitigation were doubled and the benefit were halved, the benefit/cost ratio of 3.9 would still remain very attractive.
Benefit/cost ratio break-even point
For the benefit/cost ratio to break even (i.e. benefit/cost = 1), the annual benefit will have to be decreased by a factor of 4 and the annual cost estimate will have to be increased by a factor of 3.87.
Prevention of raw sewage spillage
Standby power generation to prevent the spillage of up to 584 M£/day (DWS 2014) of raw sewage is considered necessary to protect the natural environment and informal users, and to obviate biological overloading of downstream water treatment works. The capital, annual capital maintenance and operating costs for the standby power generation plant required for each scenario are shown in Table 8.
The increase in cost has been expressed in c/k£ of effluent treated. This has not been expressed as a percentage of normal billing for sanitation services, since the requisite data was not at hand. However, if it is assumed that the sanitation billing is about half of that for water supply, then the percentage increase in sanitation billing to paying consumers would be roughly 0.8%.
If a decision is taken to make the R119.2 million capital investments in standby power generation plant to prevent raw sewage overflows, then all nine scenarios would be covered.
INDIRECT COSTS OF ELECTRICTY DISRUPTION EVENTS
Indirect costs are expected to be more than the direct costs. For instance, if an electricity disruption event that causes water supply interruptions triggers major city-wide (or nation-wide) civil unrest, it can result in the following indirect costs:
■ Halting of all economic activity during and after the water supply interruption
■ Violent uprising
■ Loss of human life
■ Spreading of disease
■ Loss of infrastructure
■ Economic vulnerability due to global uncertainty in South Africa's economy and emigration from the country.
Violent regime change might shut down Tshwane's economy for a year or more, resulting in an economic cost equal to its entire GDP of R202 billion.
CONCLUSIONS
The main conclusions drawn from this study are as follows:
■ There are currently no frameworks, regulations or government policies that guide electricity suppliers (i.e. Eskom), Water Service Authorities and Water Service Providers on how to mitigate the impact of electricity disruptions on water supply.
■ There appear to be insufficient arrangements between key role players (Eskom, Water Service Providers and Water Service Authorities) regarding the roles and responsibilities of each role player in the event of an electricity disruption. Cooperation and coordination between these role-players during an electricity disruption event would be very limited as a result of this.
■ In accordance with South Africa's constitution, measures should be put in place to ensure that the country's citizens are supplied with water to meet the minimum needs in the event of an electricity disruption. This is a joint responsibility between Water Service Authorities and the Water Service Providers that supply them with water. This action is necessary regardless of the economic benefit of ensuring continuous water supply during electricity disruption events.
■ The City of Tshwane has very few mitigation measures in place to ensure continuous water supply during electricity disruption events (specifically medium- to long-term events). Given the effect of medium- to long-term electricity disruption events on the city's water infrastructure, these events would have devastating effects on the city's economy and, more importantly, its citizens.
■ The Risk Analysis Mitigation Framework of Integrated Water and Electricity Systems, or RAMFIWES, was developed to address the need identified for such a framework. RAMFIWES proposes a structured approach which can be used to mitigate the impact of electricity disruption on water supply.
The following conclusions are drawn from this case study's review of the City of Tshwane's water infrastructure and the outcome of the scenario analyses:
■ The benefits of ensuring uninterrupted minimum water supply greatly outweigh the costs of ensuring uninterrupted water supply purely from a direct economic cost-benefit analysis perspective. The benefit/cost ratio of mitigating the risks posed by electricity disruption events on water supply is approximately 5.6 for the city's wet industries and 117 for the city's other economic sectors.
■ Provision of a basic domestic water supply, retaining 50% of industrial production and 75% of the output of other economic sectors, would increase the current normal billing to paying consumers by 0.5%.
■ The intangible risks associated with prolonged water supply interruptions (socio-economic impacts) will probably be of greater concern than economic inactivity due to water supply interruptions.
■ Standby generators to prevent large-scale spillage of raw sewage would add 0.8% to the normal sanitation bills received by consumers.
■ Reducing the risk of damage to Eskom's power generating facilities and distribution network during a blackout is highly desirable.
■ For short-term electricity disruption events it is crucial to ensure, firstly, that reservoirs and elevated towers are large enough to be able to supply at least two days' AADD, and secondly, that operating rules for reservoirs and towers are adhered to in order to ensure that water levels are maintained within the fluctuation volume of the reservoirs/towers.
■ For medium- to long-term electricity disruption events it is concluded that the volume of water stored in the city's reservoirs and elevated water towers as a measure to mitigate risks posed by electricity disruptions is less important. This is due to the fact that the volume of water stored in the city's reservoirs and elevated towers will almost certainly run out during medium- to long-term electricity disruption events if water supply cannot be sustained.
■ The City of Tshwane will, in addressing medium- to long-term electricity disruption events, mitigate all risks associated with short-term electricity disruption events, which means that the capital cost of mitigating medium- to long-term risks will also address the short-term risks.
■ Backup power generators (both mobile and permanent) will require ongoing servicing and maintenance - this will have to be incorporated into the operational and maintenance schedules of the city's water department.
■ Alternative energy sources (such as solar panels or batteries) should be considered as part of further investigations if it is decided to provide backup power to mitigate the risk of electricity disruptions on water supply - this will have to be investigated in separate cost-comparisons between various backup power supply options during the preliminary design stage for providing backup power generators.
■ Providing emergency storage capacity for sewage inflow in wastewater treatment works is more expensive than providing backup power generation at wastewater treatment works, hence emergency storage will not be practical for medium- to long-term duration electricity disruption events.
■ The supply and delivery of fuel to the city's water and sewer pump stations, and its water and wastewater treatment works will have to be planned (and secured via a contract or formal arrangement) to ensure fuel gets delivered in the event of an electricity disruption event. On-site fuel storage will need to be considered, since lengthy electricity outages will probably also disrupt fuel supplies and dislocate transportation.
■ Water restrictions implementation and end-user buy-in will be critical to ensure that water supply to the city is not interrupted in the event of an electricity disruption event. The most effective way to restrict water use to domestic and commercial users during electricity disruption events will probably be to close reservoir and elevated tank outlet pipes, and only open the pipes at certain times of day (after getting community buy-in).
■ Public buy-in and acceptance of all other water supply mitigation options opted for by the City of Tshwane will be crucial to avoid intangible risks associated with water supply interruptions (such as wide-spread civil unrest, loss of human life, economic meltdown and civil war). The public has to believe that the mitigations opted for are, firstly, put in place by the municipality in the public's best interest, secondly, not occurring unnecessarily as the result of negligence by any of the parties involved (e.g. Eskom, Tshwane or Rand Water), and thirdly, that the implementation of the mitigating options is the best way to ensure continued economic activity in Tshwane.
ACKNOWLEDGEMENTS
This study was funded by the Water Research Commission whose support is acknowledged with gratitude. The study team also wishes to express their gratitude to the City of Tshwane's Electricity and Water & Sanitation Departments for making the necessary information available for the Tshwane case study.
REFERENCES
ADB (Asian Development Bank) 2009. Guidance Note: Urban water supply sector risk assessment. Philippines: Asian Development Bank. [ Links ]
Beck, H L & Burton, G 2002. Historical overview of atmospheric nuclear weapons testing and estimates of fallout in the continental united states. Health Physics, 82(5): 591-608. [ Links ]
CoT (City of Tshwane) 2015a. Water Conservation and Demand Management System Strategy and Activities. Pretoria: CoT. [ Links ]
CoT (City of Tshwane) 2015b. City of Tshwane Newsletters. City of Tshwane Website. Available at: http://www.tshwane.gov.za/sites/Departments/Public-works-and-infrastructure/Newsletters/Water%20and%20Sanitation%20Newsletter%20Issue%205.pdf [accessed on 24 July 2017]. [ Links ]
CoT (City of Tshwane) 2015c. City of Tshwane Annual Report 2014/2015. Pretoria: CoT. [ Links ]
CoT (City of Tshwane) 2016. City of Tshwane 2016/21 Integrated Development Plan. Pretoria: CoT. [ Links ]
Cliver, E W & Dietrich, W F 2013. The 1859 space weather event revisited: Limits of extreme activity. Journal of Space Weather and Space Climate, 3. [ Links ]
Copeland, C & Carter, N T 2017. Energy-water nexus: The water sector's energy use. Washington, DC: Congressional Research Service. [ Links ]
CSIR (Council for Scientific and Industrial Research) 2005. Guidelines for human settlement, planning and design. Pretoria: CSIR. [ Links ]
DPLG (Department of Provincial and Local Government) 2009. Guidelines for infrastructure asset management in local government (2006-2009). Pretoria: DPLG. [ Links ]
DWS (Department of Water and Sanitation) 2014. Masterplan for Gauteng Waste Water Treatment Works: BookB - City of Tshwane. Pretoria: DWS. [ Links ]
GLS Consulting 2017. City of Tshwane: Master Plan -Water System GIS Database. Obtained from City of Tshwane Water Department. [ Links ]
News24 2018. Parts of Gauteng and NWest without water after pump station explodes. Available at: https://www.news24.com/SouthAfrica/News/parts-of-gauteng-and-nwest-without-water-after-pump-station-explodes-20180827 [accessed on 5 November 2017]. [ Links ]
Mank, I 2015. Energy blackouts and water outages: A risk management approach towards raising awareness and assuming responsibility. Master's dissertation. Vienna, Austria: Vienna School of International Studies. [ Links ]
Pollet, B G, Staffel, I & Adamson, K 2016. Current energy landscape in the Republic of South Africa. International Journal of Hydrogen Energy, 40: 16685-16701. [ Links ]
Province of Gauteng 2017. New Tshwane Municipal Tariffs as per Government Gazette 293 of 28 June 2017. [ Links ]
Rand Water 2018. 2017 Annual Report. Available at: http://www.randwater.co.za/Annual%20Reports/2016-2017%20Anmial%20Report/Final%20Annual%20Report%2014Nov2017.pdf [accessed on 5 November 2018]. [ Links ]
Tshwane Economic Development Agency 2015. Economic overview of Tshwane. Available at: http://www.teda.org.za/Documents/SubMenu/ExploreTshwane/Economic%20Overview%20of%20Tshwane.pdf [accessed on 30 July 2017]. [ Links ]
WHO (World Health Organization) 2007. Risk reduction and emergency preparedness: WHO six-year strategy for the health sector and community capacity development. Geneva, Switzerland: WHO. [ Links ]
Winter, D 2011. Power outages and their impact on South Africa's water and wastewater sector. WRC Report No. KV 267/11. Pretoria: Water Research Commission. [ Links ]
 Correspondence:
CHRISTO POTGIETER
Bigen Group
PO Box 8994, Bloemfontein 93 00, South Africa
T: +27 83 657 7504, E: christo.potgieter@bigengroup.com
Department of Civil Engineering, University of Pretoria
Private Bag X20, Hatfield 0028, Pretoria, South Africa
DR CHRIS HEROLD
Umfula Wempilo Consulting
PO Box 98578, Sloane Park 2152, Johannesburg, South Africa
T: +27 82 459 5731, E: chris@herold7.co.za
MARCO VAN DIJK
Department of Civil Engineering, University of Pretoria
Private Bag X20, Hatfield 0028, Pretoria, South Africa
T: +27 12 420 3176, E: marco.vandijk@up.ac.za
JAYANT BHAGWAN
Water Research Commission
Private Bag X03, Gezina, Pretoria 0031, South Africa
T: +27 12 761 9000, E: jayb@wrc.org.za

CHRISTO POTGIETER (PrEng, MSAICE) works at Bigen in the company's Water and Sanitation Sector. He graduated from the University of Pretoria with a degree in Civil Engineer in 2011, obtained his BEng (Hons) degree in 2016 and completed his MEng degree In 2018 in Water Resources Engineering.

DR CHRIS HEROLD (PrEng, FSAICE) specialises in water resources and water quality model development and assessment. His models have found wide practical application in catchment and systems analysis studies that have saved South Africa billions of rands. He is the author of 44 technical papers published locally and overseas and is the principal author of over 130 unpublished technical reports. Chris has actively participated in over a dozen Water Research Commission studies, most of which he has led. He obtained his BSc, MSc and PhD degrees at the University of the Witwatersrand. He formed Umfula Wempilo Consulting in 2000.

MARCO VAN DIJK (PrEng, MSAICE) is a lecturer in the Department of Civil Engineering at the University of Pretoria (UP), and a Principal Researcher for the South African Water Research Commission. He obtained a degree in Civil Engineering from UP in 1996, a BEng (Hons) in 1998, an MEng in Water Resource Engineering in 2003, and is currently completing his PhD. He has compiled numerous technical reports and journal publications, and has presented at various conferences in the field of pipelines, hydropower generation, and water distributions systems. He is also a member of the Water Institute of Southern Africa.

JAYANT BHAGWAN obtained a Master's In Tropical Public Health Engineering from Leeds University, supported by degrees in Municipal and Civil Engineering. He is the Executive Manager of Water Use and Waste Management at the South African Water Research Commission, overseeing around 150 research projects covering the management of drinking water and wastewater in the domestic, mining and industrial sectors, with particular focus on water supply and sanitation for low-income areas. He participated in the shaping of South Africa's national water policy and legislation, and also drives the area of faecal sludge management (FSM), having pioneered an international series of FSM conferences.

