


Services on Demand
Article
 English (pdf)
 Article in xml format
 Article references
Indicators

Related links
-
 Cited by Google
 -
 Similars in Google
Share

 Permalink
Journal of the South African Institution of Civil Engineering
On-line version ISSN 2309-8775
Print version ISSN 1021-2019
J. S. Afr. Inst. Civ. Eng. vol.61 n.3 Midrand Sep. 2019
http://dx.doi.org/10.17159/2309-877s/2019/v61n3a6
TECHNICAL PAPER
Estimating elastic moduli of sandstones using two-dimensional pore space images
T C Ekneligoda
ABSTRACT
The elastic moduli (shear modulus and bulk modulus) of two different sandstones are estimated from two-dimensional images of the pore space. An image analysis technique was used to extract the area and perimeter of each pore. The shearablity and compressibility of each pore were calculated using the boundary element method and a perimeter-area scaling law. The effective shear modulus and bulk modulus of the rock were then estimated using the area-weighted mean pore shearablity, pore compressiblity and the differential effective medium theory. The method was applied to Fontainebleau and Berea sandstones. Comparison with experimental values of the shear moduli and bulk moduli showed good agreement.
Keywords: shear moduli, bulk moduli, image analysis, pore shearablity, rock properties
INTRODUCTION
The macroscopic elastic moduli of a porous medium depend essentially on the porosity and the structure of the pores, along with a nearly trivial multiplicative dependence on the moduli of the non-porous host material. Methods for estimating the elastic moduli directly from images of the material would clearly be of great value compared to time-consuming and expensive experimental measurements. Numerous methods have been proposed to relate these microscopic elastic parameters that would occur in the "isolated pore or small porosity" limit to finite porosity limts (Christensen 1990; Zimmerman 1991; Grimvall 1999). However, no single method has gained universal acceptance.
Image analysis is a powerful tool, which is now widely used in several fields, including in engineering and medicine (Chermant 2001; Chermant et al 2001; Mouret et al 2001). In the recent past this technique has been successfully used in modelling the mechanical and transport properties of porous and inhomogeneous materials. Yue et al (2003) used the image analysis technique, together with the finite element method, to model asphalt concrete under different loading conditions. Chen et al (2004) used image analysis to aid in the prediction of inhomogeneous rock failure. Coster and Chermant (2001) discussed in detail how the technique can be incorporated into the modelling of civil engineering materials. Lock et al (2002) used information about rock pores obtained from image analysis of electron micrographs to predict the permeability of sandstones. In this paper, actual pore space images are used to study the relationship between the effective elastic properties and pore geometry. Image analysis is conducted to extract the pore geometry information, such as the perimeter and the area, from the pore images. The shearability parameter and compressiblity parameter of the pores are estimated either by performing boundary element calculations, or using scaling laws. The differential effective medium theory is used to (approximately) account for the elastic interactions between nearby pores. This methodology is applied to Fontainebleau and Berea sandstones.The shear moduli and bulk moduli prediction are then compared with published experimental data.
PORE SHEARABILITY PARAMETER
The excess strain, Δε, due to an inhomoge-neity in a homogeneous medium subjected to a far-field stress Of, is expressed in terms of the fourth-order H tensor, as follows:
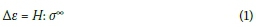
Where: the colon denotes the tensor inner product (Sevostianov et al 2008; Sevostianov & Kachanov 2002; Prokopiev & Sevostianov 2007).
For example, H1212 connects the excess shear strain Δε12 to the applied remote shear stress σoo12. For ellipsoidal pores, or special cases thereof, the H tensor can be expressed in terms of the Eshelby tensor, of which the components are known (Eshelbyl957; Wu 1966).
The H1212component can be written to combine the effective shear modulus (G), as in Equation 2 (Ekneligoda & Zimmerman 2008). A similar relationship can be found (Drach et al 2011) which was used to evaluate the contribution of irregularly shaped three-dimensional pores to the overall elastic properties of carbon/carbon composites. Drach et al (2014) used a similar relationship to predict the effective elastic moduli of materials with irregularly shaped pores, based on the pore projected areas.
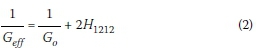
Where: Gois the shear modulus of non-porous or host material. Using the notation H1212= φiSpc(φ being porosity) hereafter, we use the term shearablity to denote Spc.
For two dimensions, pores of a wide variety of shapes can be treated using the complex variable methods developed by Muskhelishvili (1963). For example, Ekneligoda and Zimmerman (2008) used this method to study the H1212 of several quasi-polygonal pores, and other pores with Ν-fold axes of rotational symmetry. Their results showed that H1212for a plain strain condition, when the pore has Ν-fold rotational symmetry of order Ν = 3, 5, 6, etc, can be expressed as Equation 3 (note that Ν cannot be equal to 4).
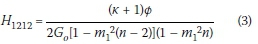
Where: and n are the terms in the mapping function that conformally map the unit circle into the desired shape.
Detailed disucssion about the limiting value of m1and n is presented by Ekneligoda and Zimmerman (2008) - k is 3 - v for plain stress, G is the shear modulus and v is the Poisson's ratio.
Ekneligoda and Zimmerman (2008) explicitly analysed the fourfold (Ν = 4 = (n + 1)) condition. Under this condition an additional energy term arises. Their results showed that H1212for such pores that have fourfold (Ν = 4) can be expressed as:
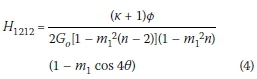
Where: the angle θ is the anti-clockwise angle by which the stress state rxy = τyχ= τ is rotated.
However, the use of complex variable methods to analyse the shearability parameter of an irregular pore that might be observed in a rock image is not practical, due to the fact that tens of thousands of terms would typically be needed in the mapping function that conformally maps the unit circle into the desired pore shape. Hence, it is important to find other, simpler methods to estimate the pore shearability.
One approach is to solve the equations of elasticity in the region outside of the pore using a numerical method such as the boundary element method (BEM). The boundary element calculations showed that, for irregular pores having no axis of symmetry, H1212 always varies with cos 4θ, aside from some phase shift in the angle. One particular example is shown in Figure 1, for a pore in Berea sandstone. This result can be explained as follows:
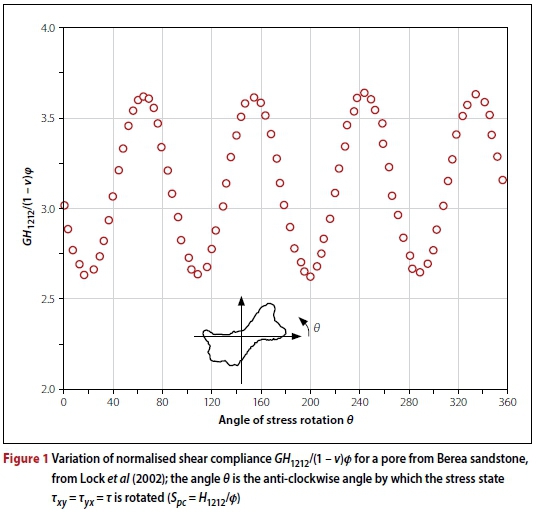
Anti-clockwise rotation of the farfield shear stresses by 90° is equivalent to changing the sign of the stresses, since, for example, the component τχy = r that points in the positive y-direction gets rotated into a component rχy= -r that points in the negative x-direction. But the strain energy is a quadratic form in the stresses, so multiplying the stresses by -1 cannot change the energy, and so cannot change H1212. Hence, H1212 can only vary with angle according to cos4θ, cos8θ, etc. Allowing for a possible phase shift, the term that varies trigonometrically with 4θ would also yield a sin4θ term, etc. But the transformation law for fourth-order tensors contains only trigonometric terms such as sin(kθ) or cos(kθ), where k cannot exceed 4 (Eroshkin & Tsukrov 2005). Hence, the only angular-dependent terms that can appear in H1212 are those containing cos4θ and sin4θ, or, equivalently cos(δ + 4θ), where the constant δ represents the phase shift. Alternatively, by retracing the steps that are involved in complex variable formulation, one can show that in the general case of an arbitrary number of terms in the mapping function, the angle θ enters the integral that expresses the excess energy only in the form of e4iθ. Hence, a cos (δ + 4θ) term should be expected to appear, but vanishes when the pore has Ν-fold rotational symmetry of order Ν = 3, 5, 6, etc.
In principle, the BEM method can be used to treat this problem. It would be simpler if the shearability parameter could be determined by geometric attributes of a pore shape. Ekneligoda and Zimmerman (2008) proposed the following scaling law to determine the shearablity parameter of irregular pores:
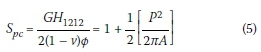
Where: P is the perimeter of the pore, A is its area, G is the shear modulus of the non-porous rock material, φ is the porosity and ν is the Poisson's ratio of the rock material.
PORE COMPRESSIBILITY
An important and conceptually simple parameter for use in discussing the elastic properties of porous media is the pore compressibility parameter, which can be defined as follows (Zimmerman 1991):
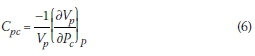
Where: Vp is the initial pore volume, Pcis the external hydrostatic confining pressure, and Vp is the pressure of the pore fluid, which is held constant when taking the derivative described in Equation 6. The subscripts "p" and "c" refer to the compressibility of the pore with respect to the confining pressure.
The pore compressibility is of great importance in petroleum engineering, where it is used, for example, in material balance calculations. But it is also important because the effective macroscopic compressibility Cf can be related (exactly) to the pore compressibility through the relation:
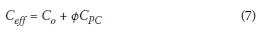
Where: Cois the compressibility of the non-porous rock material, and φ is the porosity.
The effective macroscopic bulk modulus Keffis given, by definition, by Keff = 1/Ceff
In principle, the pore compressibility that appears in Equation 7 must refer to the entire pore space of the rock. But when attempting to relate the elastic properties of the rock to the pore structure, it is traditional, and convenient, to study each individual pore in isolation. Specifically, the compressibility of each "pore" can be studied by considering the problem of an isolated pore in an infinite elastic solid. However, the overall compressibility of the entire pore space is not necessarily equal to the weighted average of the individual pore compressibility, which is calculated as if no other pores were present. This issue is discussed further in the next section.
The pore compressibility can be calculated for a pore of a given shape by solving the elasticity problem of an isolated pore in an infinite elastic solid. In three dimensions, this can be done analytically only for pores of the ellipsoidal family, which includes spheroids, spheres, cylinders, and thin "penny-shaped" cracks. The pore compressibility of these shapes is essentially contained in the famous solution of Eshelby (1957). All other three-dimensional shapes require numerical solution (Burnley & Schmidt 2006). However, in two dimensions, pores of a wide variety of shapes can be treated using the complex variable methods developed by Muskhelishvili (1963). For example, Ekneligoda and Zimmerman (2006) used this method to study the compressibility of several quasipolygonal pores, and other pores with «-fold axes of rotational symmetry.
Nevertheless, use of complex variable methods to analyse the compressibility of an irregular pore, such as might be observed in a rock image, is not practical, due to the fact that tens of thousands of terms would typically be needed in the mapping function that conformally maps the unit circle into the desired pore shape (Sisavath et al 2001). Hence, we must find other methods to estimate the pore compressibility. One approach is to solve the equations of elasticity in the region outside of the pore using a numerical method, such as the boundary element method (BEM).
Although the boundary element method can in principle be used to compute the compressibility of a pore of any shape, it would be simpler if the pore compressibility could be calculated from some simple geometric attributes of the pore shape, without requiring elaborate analytical or numerical calculations. Such a capability would be useful in attempting to establish a simple technique to estimate elastic moduli from images of heterogeneous media.
One approach to do this is the following scaling law that was proposed by Zimmerman (1986) for two-dimensional pores in plane-strain conditions:
Where: P is the perimeter of the pore, A is its area, G is the shear modulus of the non-porous rock material, and ν is the Poisson ratio of the rock material.
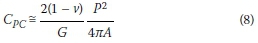
This equation was "derived" by starting with the fact that an isolated circular pore has a compressibility of Cpc=(1-v)/2G and then assuming that Cpcscales with the dimensionless ratio of perimeter-squared over area. The factor of 4π is needed to make the equation exact in the case of a circle.
Tsukrov and Novak (2002) tested this equation on a single, irregularly-shaped pore, and found that it was in error by only 8%. Ekneligoda and Zimmerman (2006) tested it for a variety of polygons and quasi-polygons, and found that the error was typically less than 10%, and never more than 21%.
Ekneligoda and Zimmerman (2006) showed that Cpcis always proportional to (1 - v)/G, with an additional dimensionless multiplicative factor that depends only on the pore shape. This factor can therefore depend on pore "shape" only through dimensionless parameters, such as P2/A. However, this dependence is not necessarily linear, as is hypothesised in Equation 8.
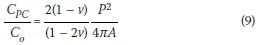
Noting that the two-dimensional, planestrain compressibility is related to G and ν by Co= (1 -2v)/G, the proposed scaling law can also be written as:
EFFECTIVE SHEAR MODULUS AND BULK MODULUS
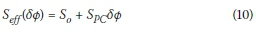
Consider Equation 2, with the Spcterm interpreted as pertaining to an isolated pore. We use the terms Seff and Soto represent Geff and Gorespectively. If we consider the thought experiment of inserting a small differential amount of pores into the non-porous rock, then one can say:
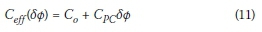
A similar relationship can be built for pore compressibility as presented in Equation 11.
Noting that Sois the effective shearability when the porosity is zero, one can convert Equation 10 into the following differential equation:
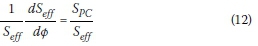
Equation 12 can be used to model the evolution of the shearability, as additional pores are added into the rock, with the initial condition that Seff = Sowhen φ = 0.
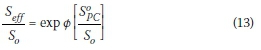
Finally, it can be shown that Equation 12 can be simplified to Equation 13 with the reasonable assumption that Spcto the host material Seff is constant with the addition of new pores. In this case, its value must be equal to the value it had in the isolated pore, zero-porosity limit. We call this value S0pc/So, with the superscript "o"used to denote the zero-porosity limit.
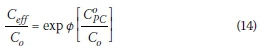
Following the similar argument, the variation of compressibility parameter can be expressed as:
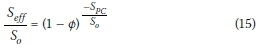
In the above scheme it was implicitly assumed that, as new pores with incremental porosity δφ are placed into the material, the total porosity is increased by δφ. But Norris (1985) and others have pointed out that, if these additional pores are imagined to be randomly placed in the rock, they will replace solid material with probability 1 - φ, and replace existing pores with probability φ. Hence, the increment in total porosity will be δφ/(1 - φ). If we replace δφ in Equation 13 with δφ/(1 - φ), this has the effect of transforming Equation 13 into Equation 15:
In terms of the effective shear modulus, Equation 15 takes the form:
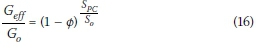
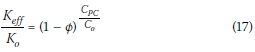
Following the simailar approach the relationship for bulk modulus can be expressed as:
This is the same form, (1 - φ)m, that has often been proposed empirically to model the elastic moduli of porous ceramics (Rice 1998), but the present derivation assigns a physical interpretation to the exponent m. All that remains is to estimate the value of the shearablity and compressiblity parameters, which depend on pore shape.
IMAGE ANALYSIS AND NUMERICAL CALCULATION TO DETERMINE THE PORE SHEARABILITY AND PORE COMPRESSIBILITY
We start with a scanning electron micrograph (SEM) image of a region of rock surface. Figure 2(a) shows such an image for a Berea sandstone, taken from Schlueter et al (1997). The dark grey regions are quartz grains. The pore space is impregnated with Wood's metal (white) and epoxy (black), and the light grey regions are clays and other minerals. This helped to identify the total pore space. This image was initially taken for a study of two-phase flow properties, but for the present purposes the only important distinction to be made is between pores and minerals. The size of the original image in Figure 2(a) is 375 χ 250 μm.
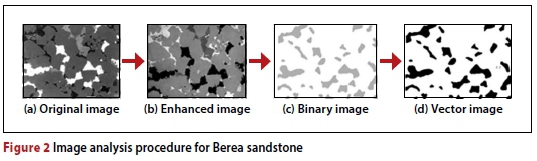
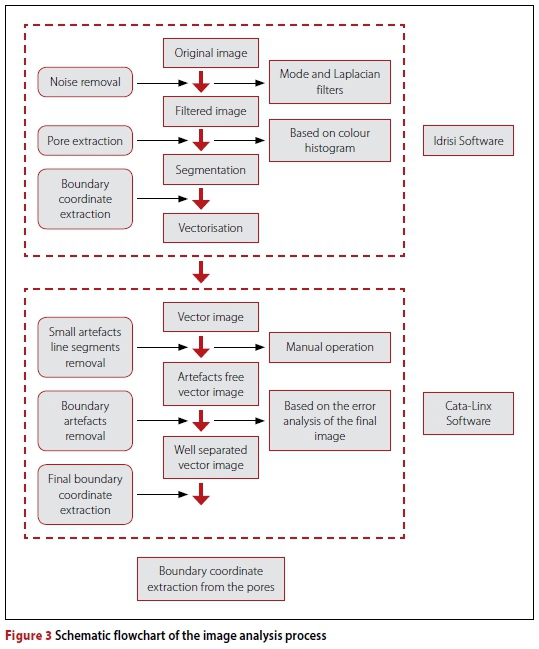
The image analysis software packages Idrisi and Carta-Linx are used to extract the pores from the images, and compute their associated properties, such as area and perimeter. As the first step the original image is enhanced, using 4 χ 4 kernel with mode filtering, to arrive at Figure 2(b). Then, based on the histogram of colour distribution, a binary image was created to separate the pores from the minerals, as shown in Figure 2(c). As an intermediate step, smaller features of size less than 8 μηι2 were eliminated, using a histogram of pore areas. These features may simply be artifacts of the image analysis procedure, or may indeed be small pores. With regard to the latter possibility, we note that these smaller pores contribute only 2.5% to the total porosity of the analysed section. Finally, a vector image is created in which the boundary of each pore is associated with a numerical (x,y) coordinate pair, as shown in Figure 2(d).
To remove artificially introduced waviness in the pore boundary, the vector image was exported to another image analysis software, Carta-Linx. Smoothing was carried out using the option called "generalisation", based on the individual perimeter values of the pores. This is permissible, as waviness with small amplitudes does not contribute any additional stiffness to the pore. The entire process of image analysis can be summarised as presented in Figure 3.
Images of two Fontainebleau sandstone samples, having porosities of 12% and 25%, are shown in Figures 4 and 5. These images illustrate the fact that essentially any two-dimensional pore image can be used as a starting point for the procedure, as long as the pores can be distinguished from the minerals.
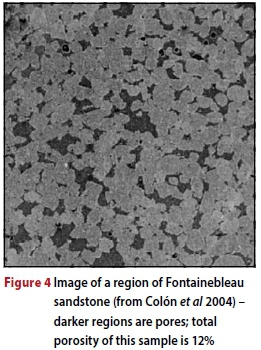
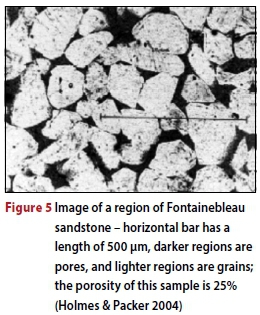
The image analysis procedure described above was applied to the Fontainebleau sandstone samples shown in Figures 4 and 5.
The boundary element method is then used to calculate S0pcand C°^cnumerically, assuming each pore to be isolated in an infinite rock matrix. The average value of S is determined after the full rotation of stress as represented in Figure 1 (i.e θ was varied from 0° to 360° at steps of 10°). The calculations are performed using the code developed by Martel and Muller (2000).
In the calculations of C°pc, all farfield stresses and body forces are set to zero. A uniform normal traction of unit magnitude is prescribed over the surface of the hole to determine the area change of the single pore. The cavity boundary is discretised into a number of equal-length elements. We generally found that roughly 300 boundary elements are sufficient to achieve convergence of the computed compressibilities.
RESULTS
Berea sandstone
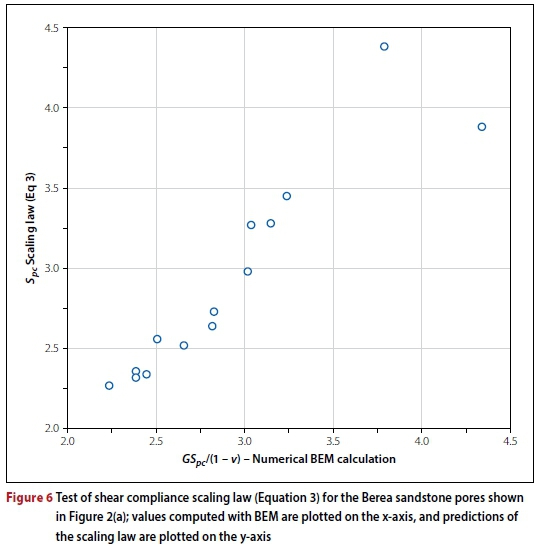
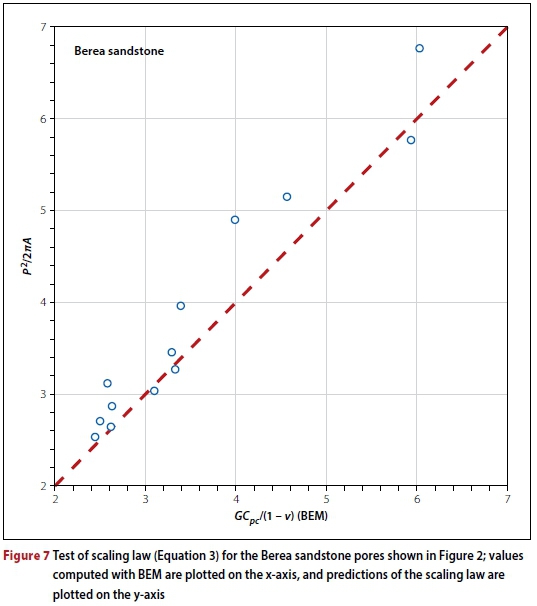
The area and perimeter of each individual pore from the Berea sandstone image in Figure 2(a) are shown in Table 1, along with the pore shearablity that is calculated by the boundary element method (BEM), and estimated from scaling law (Equation 3). The same information is also plotted in Figure 6. Table 2 summarises the pore compressibility parameter derived based on scaling law and the boundary element method. Figure 7 illustrates the compressibility parameter derived by scaling law and boundary element methods. The maximum shearablity parameter is 4.4 and the maximum com-pressiblity parameter becomes 6.8 in the analysed Berea sandstone section.
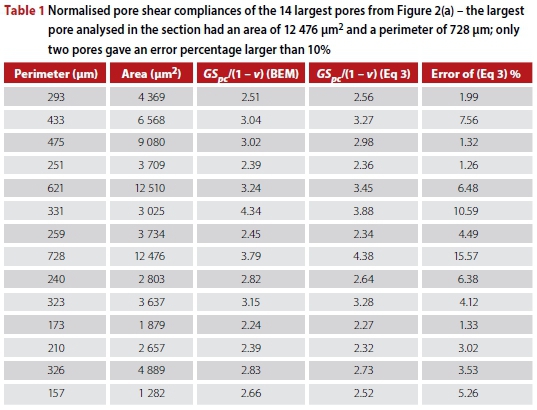
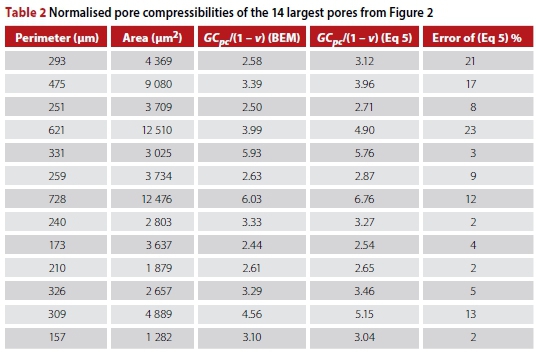
The largest pore analysed in the section had an area of 12 476 μm2 and a perimeter of 728 μm. Only two pores gaves an error percentage larger than 10%.
The maximum error percentage was given by the largest pore in the analysed section which had an area of 12 509 μm2 and a perimeter of 621 μm. However, the error percentage of the shearablity of the same pore is 6.48. The pore that resulted in the second-highest error percentage of shearablity, however, gave only 3% error in compressiblity parameter.
The porosity of the Berea sandstone in Figure 2(a) is 0.22, so Equation 16 gives an effective shear modulus of 14.5 GPa. The mean value of G0Spc/(1 - v0), as calculated using the scaling law, is 3.53, in which case the calculation procedure yields Gεff = 13.0 GPa. These compare very well with the high-stress effective shear modulus of 14.1 GPa measured by King (1966).
The area-weighted mean value of the normalised pore compressibility G0CpC/(1 - v0), as calculated by the BEM, is 3.96. The elastic moduli of the mineral phase of Berea, as reported in Zimmerman (1991) are G0= 31.34 GPa, K0= 39.75 GPa, and v0= 0.188. Hence, we see that C0pC/C0= 4.58. The porosity of Berea sandstone is 0.22, so Equation (17) gives an effective bulk modulus of 13.0 GPa. The mean value of G0Cpc/(1 - v0), as calculated by the scaling law, is 4.44, in which case the analogous calculation procedure yields Kef = 11.1 GPa. These values are both reasonably close to the experimental value, measured at high stresses when all microcracks are closed, which is 9.6 GPa (Zimmerman 1991).
Fontainebleau sandstone
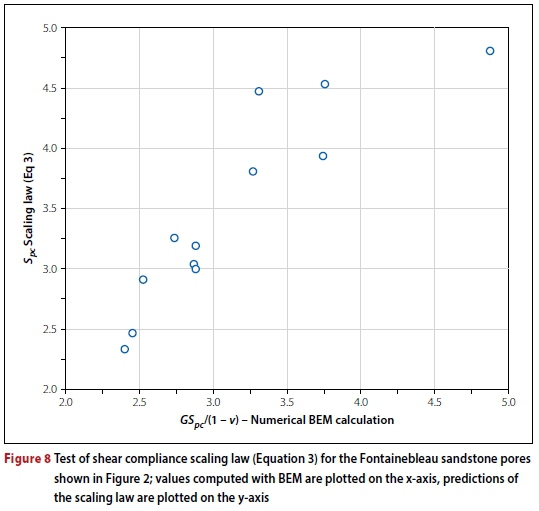
The area-weighted pore shearability of the sample with φ = 12% (Figure 4) is found to be G0SpC/(1 - v0) = 2.58 according to the BEM calculations, and 3.50 according to the scaling law. For the φ = 25% sample (Figure 5) these values were 3.33 and 3.48 respectively. The comparsion of pore shearability parameters of individual pores for porosity 25% sample determined using the scaling law and the numerical method is presented in Figure 8. Interestingly, the pore shearability values do not seem to vary very much with porosity.
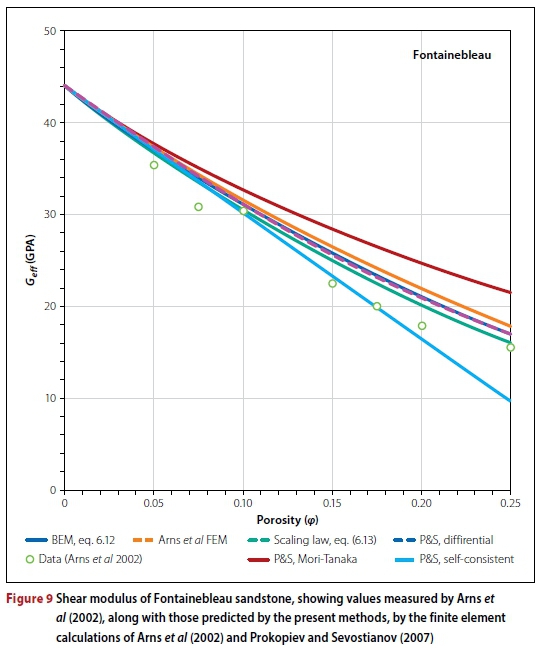
The value computed for the 25% porosity sample is used in the following calculations: The elastic moduli of the mineral phase of Fontainebleau sandstone, which is essentially pure quartz, are Go= 44 GPa, Ko= 37 GPa and vo= 0.074 (Arns et al 2002). It is already stated that Spc/So= 3.33 according to the BEM calculations, and Spc/So= 3.48 using the scaling law. Finally, Equation (16) yields the following prediction for the effective shear modulus, when the pore shear compliance is calculated by BEM: Geff(GPa) = 44.0(1 - φ)3.33 and according to scaling law Geff(GPa) = 44.0(1 - φ)3.48.
These two effective shear modulus predictions are shown in Figure 9, where they are compared to the experimental values reported by Arns et al (2002), and to the three predictions made by Prokopiev and Sevostianov (2007). As was the case for the bulk modulus, the present method gives very good predictions over the entire range of data. Note that the values predicted by the finite element calculations (FEM) of Arns et al (2002) are indistinguishable from the predictions of Equaton (16), in which the individual pore compliances were found from BEM calculations, and the differential effective medium method was used to extrapolate from the low-porosity limit out to higher porosities.
The same image analysis procedure as was described above for Berea is then applied to the Fontainebleau images. The area-weighted pore compressibility of the sample with φ = 12% is found to be GoCpc/(1 - vo) = 3.81 according to the BEM calculations, and 5.02 according to the scaling law. For the φ = 25% sample, these values were 3.84 and 4.97 respectively. Interestingly, the pore compressibility values do not seem to vary much with porosity; we will use the values computed for the 12% porosity sample in the following calculations. The elastic moduli of the mineral phase of Fontainebleau, which is essentially pure quartz, are (Arns et al 2002) Go= 44 GPa, Ko= 37 GPa and vo = 0.074. Hence, we find Copc/Co= 2.97 according to the BEM calculations, and C0pC/C0= 3.84 using the scaling law. Finally, Equation 17 yields:
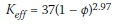
when the pore compressibilities are calculated from the BEM, and
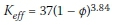
when the pore compressibilities are calculated from the scaling law, Equation 5.
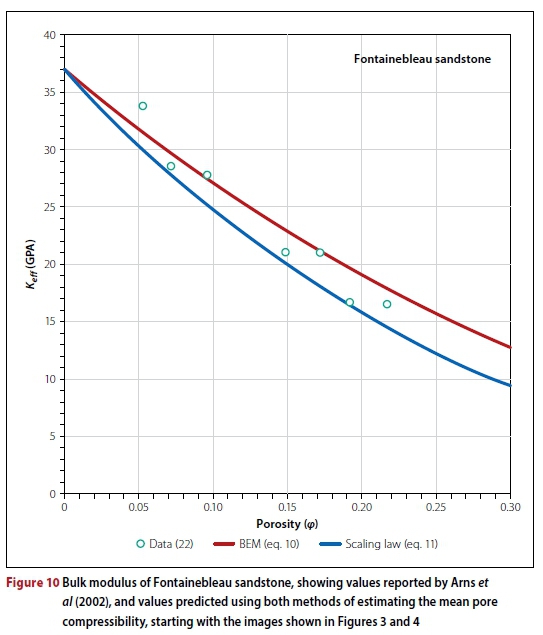
The two effective moduli predictions are shown in Figure 10, compared with the experimental values reported by (Arns et al 2002). The data tends to fall between the two predictions, which could be interpreted as implying that the BEM calculations underestimate the pore compressibility, whereas the scaling law overestimates slightly. We note also that "correcting" the scaling law, Equation 5, by the aforementioned factor of 0.9 yields a curve that would lie between the two curves shown in Figure 10, and which would fit the data quite well.
CONCLUSIONS
We have used image analysis to extract two-dimensional pores from SEM images of Fontainebleau and Berea sandtones. It was also shown that the variation of shearablity parameter (Spc~ H1212), involving θ only through terms such as cos4θ or sin4θ, also occurs for pores possessing no rotational symmetry similar to the pores that are found in Fontainebleau and Berea sandstones. The average shearability parameter and compressibility parameters of each pore were then calculated using boundary elements, and also estimated from an area-perimeter scaling law. The area-weighted, mean pore shearability and pore compressibility were then used, in conjunction with the differential effective medium theory, to predict the macroscopic shear modulus and bulk modulus. This study gave an explicit meaning to the exponential value of (1-porosity) that is generaly used as an experimental method in predicting elastic moduli.
The maximum error percentages associated with boundary element calculation and scaling law calculation in shearablity and compressiblity parameters were 15.57 and 21% for Berea sandstone. The variation of pore compressiblity from 12% porosity to 22% porosity is less than 1% for the boundary element calculation and scaling law for the analysed Fontainebleau sandstone. The resulting predictions are close to the shear moduli and bulk moduli values measured in the laboratory.
Our methodology therefore offers a promising and simple approach to relate the mechanical properties of porous geological materials to their pore structure, using only two-dimensional images.
ACKNOWLEDGEMENT
The author thanks Prof Robert Zimmerman for his valuable support during the prepartion of this paper.
REFERENCES
Arns, C H Knackstedt, M A, Pinczewski, W V & Garboczi, E J 2002. Computation of linear elastic properties from microtomographic images: Methodology and agreement between theory and experiment. Ge0physics, 67:1396-1405. [ Links ]
Burnley, P C & Schmidt, C 2006. Finite element modeling of elastic volume changes in fluid inclusions: Comparison with experiment. American Mineralogist, 91: 1807-1814. [ Links ]
Chen, S, Yue, Z Q & Tham, L G 2004. Digital image based numerical modeling method for prediction of inhomogeneous rock failure. Internati0nal Journal of Rock Mechanics and Mining Sciences, 41: 939-957. [ Links ]
Chermant, J 2001. Why automatic image analysis? An introduction to this issue. Cement and C0ncrete Composites, 23: 127-131. [ Links ]
Chermant, J, Chermant, L, Coster, M, Dequiedt, A & Redon, C 2001. Some fields of applications of automatic image analysis in civil engineering. Cement and Concrete Composites, 23: 157-169. [ Links ]
Christensen, R M 1990. A critical evaluation for a class of micro mechanics models. Journal of Mechanical Physics and Solids, 38: 379-404. [ Links ]
Colón, C F J, Oelkers, E H & Schott, J 2004. Experimental investigation of the effect of dissolution on sandstone permeability, porosity, and reactive surface area. Geochimica Cosmochimica Acta, 68: 805-817. [ Links ]
Coster, M & Chermant, J 2001. Image analysis and mathematical morphology for civil engineering materials. Cement and Concrete Composites, 23: 133-151. [ Links ]
Drach, B, Drach, A & Tsukrov, I 2014. Prediction of the effective elastic moduli of materials with irregularly-shaped pores based on the pore projected areas. International Journal of Solids and Structures, 51: 2687-2695. [ Links ]
Drach, B, Tsukrov, I, Gross, T, Dietrich S, Weidenmann, K, Piat, R & Böhlke, T 2011. Numerical modeling of carbon/carbon composites with nanotextured matrix and 3D pores of irregular shapes. International Journal of Solids and Structures, 48: 2447-2457. [ Links ]
Ekneligoda, T C & Zimmerman, R W 2006. Compressibility of two-dimensional pores having n-fold axes of symmetry. Proceedings of the Royal Society, Series A, 462: 1933-1947. [ Links ]
Ekneligoda, T C & Zimmerman, R W 2008. Shearcompliance of two-dimensional pores possessing N-fold axis of rotational symmetry, Proceedings of the Royal Society, Series A, 464: 759-775. [ Links ]
Eroshkin, O & Tsukrov, I 2005. On micromechanical modelling of particulate composites with inclusions of various shapes. International Journal of Solids and Structures, 42(2): 409-427. [ Links ]
Eshelby, J D 1957. The determination of the elastic field of an ellipsoidal inclusion, and related problems. Proceedings of the Royal Society, Series A, 241: 376-396. DOI:10.1098/rspa.1957.0133. [ Links ]
Grimvall, G 1999. Thermophysical Properties of Materials, 2nd ed. Amsterdam: Elsevier. [ Links ]
Holmes, W A & Packer, K J 2004. Investigation of phase trapping by secondary imbibition within Fontainebleau sandstone. Chemical Engineering Science, 59: 2891-2898. [ Links ]
King, M S 1966.Wave velocities in rocks as a function of changes in overburden pressure and pore fluid saturants. Geophysics, 31,50-73. [ Links ]
Lock, P A, Jing, X D & Zimmerman, R W 2002. Predicting the permeability of sandstone from image analysis of pore structure. Journal of Applied Physics, 92: 6311-6319. [ Links ]
Martel, S J & Muller, J R 2000. A two-dimensional boundary element method for calculating elastic gravitational stresses in slopes. Pure and Applied Geophysics, 157: 989-1007. [ Links ]
Mouret, M, Ringot, E & Bascoul, A 2001. Image anlaysis: A tool for the characterization of hydration of cement in concrete-metrological aspects of magnification on measurement. Cement and Concrete Composites, 23: 201-206. [ Links ]
Muskhelishvili, N I 1963. Some Basic Problems of the Mathematical Theory of Elasticity, 2nd ed. Groningen, Netherlands: Noordhoff. [ Links ]
Norris, A N 1985. A differential scheme for the effective moduli of composites. Mechanics of Materials, 4: 1-16. [ Links ]
Prokopiev, O & Sevostianov, I 2007. Modeling of porous rock: Digitization and finite elements versus approximate schemes accounting for pore shapes. Interntional Journal of Fractures, 143: 369-375. [ Links ]
Rice, R W 1998. Porosity of Ceramics. New York: Marcel Dekker. [ Links ]
Schlueter, E M, Zimmerman, R W, Witherspoon, P A & Cook, N G W 1997. The fractal dimension of pores in sedimentary rocks and its influence on permeability. Engineering Geology, 48: 199-215 [ Links ]
Sevostianov, I & Kachanov, M 2002. On the elastic compliances of irregularly shaped cracks. Interntional Journal of Fractures, 114: 245-257. [ Links ]
Sevostianov, I, Kachanov, M & Zohdi, T 2008. On computation of the compliance and stiffness contribution tensors of non-ellipsoidal inhomogeneities. International Journal of Solids and Structures, 45: 4375-4383. [ Links ]
Sisavath, S, Jing, X D & Zimmerman, R W 2001. Laminar flow through irregularly-shaped pores in sedimentary rocks. Transport in Porous Media, 45: 41-62. [ Links ]
Tsukrov, I & Novak, J 2002. Effective elastic properties of solids with two-dimensional inclusions of irregular shapes. International Journal of Solids and Structures, 41: 6905-6924. [ Links ]
Wu, T T 1966. The effect of inclusion shape on the elastic moduli of a two-phase material. International Journal of Solids and Structures, 2: 1-8. DOI:10.1016/0020-7683(66)90002-3. [ Links ]
Yue, Z Q, Chen, S & Tham, L G 2003. Finite element modeling of geomaterials using digital image processing. Computers and Geotechnics, 30: 375-397. [ Links ]
Zimmerman, R W 1986. Compressibility of two-dimensional cavities of various shapes. Journal of Applied Mechanics, 53: 500-504. [ Links ]
Zimmerman, R W 1991. Compressibility of Sandstones. Amsterdam: Elsevier. [ Links ]
 Correspondence:
DR THUSHAN C EKNELIGODA
School of Civil and Environmental Engineering
University of the Witwatersrand
Private Bag 3
Wits 2050
South Africa
T: +27 11 717 7386
E: thushan.ekneligoda@wits.ac.za

DR THUSHAN C EKNELIGODA completed his PhD at the Royal Institute of Technology in Sweden. Then he worked in the industry for two years as a senior research engineer before moving to academia. He obtained his post-doctoral qualifications both from Seoul National University and the University of Nottingham. Currently he is a senior lecturer at the School of Civil and Environmental Engineering at the University of the Witwatersrand in Johannesburg.

