


Services on Demand
Article
 English (pdf)
 Article in xml format
 Article references
Indicators

Related links
-
 Cited by Google
 -
 Similars in Google
Share

 Permalink
Journal of the South African Institution of Civil Engineering
On-line version ISSN 2309-8775
Print version ISSN 1021-2019
J. S. Afr. Inst. Civ. Eng. vol.61 n.3 Midrand Sep. 2019
http://dx.doi.org/10.17159/2309-8775/2019/v61n3a4
TECHNICAL PAPER
Monitoring permeability potential of hot mix asphalt via binary aggregate packing principles correlated with Bailey ratios and porosity principles
E Horak; J Maina; P Myburgh; H Sebaaly
ABSTRACT
Asphalt mix designs tend to optimise the load transfer via aggregate skeletons as main mechanism to provide rut resistance, often to the detriment of durability. Permeability, as a significant durability indicator, is more difficult to measure in the field than in the laboratory. Voids in the asphalt mix have a critical zone where an increase in voids is exponentially linked to permeability. This zone is where voids start to become increasingly interconnected. The aggregate grading envelope characteristics can provide an indication of the interconnectedness of the voids to enhance quality control. New rational Bailey Method Ratios (BMRs) were defined with contiguous aggregate fractions in the numerator and denominator. This allows also for porosity calculation using the Dominant Aggregate Size Range (DASR) method. The Binary Aggregate Packing (BAP) triangle porosity diagrams provide insight into the link between porosity and interconnected voids. The wall and the loosening effects create additional porosity (voids) with increased probability of interconnectedness. Clear threshold zones of interconnected voids can be determined with BAP coarse/fine mass ratios. The latter is the inverse of the rational BMRs. It allows for simple spreadsheet calculations of porosity and coarse/fine mass ratio as a screening tool for probable permeability via benchmark analysis. Reworked data sets demonstrated how the inverse of BMRs could show potential for interconnectedness of voids and, therefore, permeability propensity.
Keywords: Bailey Method Ratios (BMRs), permeability, porosity, interconnected voids, Binary Aggregate Packing (BAP), wall effect, loosening effect, Dominant Aggregate Size Ratio (DASR)
INTRODUCTION
The aggregate stone skeleton is known to form the core of the flexural and compressive strength resistance to permanent deformation and fatigue cracking of Hot Asphalt Mix (HMA) in asphalt pavement layers. High-level theoretical work on tessellation and discrete element modelling are at the cutting edge of research (Alshibli & El-Saidany 2001; Burtseva & Werner 2015). However, more practical approaches are available with the correct fundamental characteristics describing aggregate volumetric packing principles.
The Bailey method (Vavrik et al 2001; TRB 2002) is well established in the USA as a logical approach to enhance aggregate packing analysis in asphalt mix design. It is based on the fundamental concept that fine aggregates equal or less than 0.22 of a specific larger aggregate size will be able to fit in the voids in-between these large aggregates. That ensures aggregate on aggregate contact, and therefore structural strength of the aggregate skeleton. The Bailey method is also included in the South African Guideline 35 (SABITA 2016) as a valuable method to assist in designing asphalt mixes, which rely on the aggregate skeleton as main load-bearing mechanism in a paved asphalt layer to provide resistance to rutting. The Bailey method is, however, not well articulated with permeability of the asphalt mix.
Permeability, as a durability indicator, is normally measured under controlled environment in the laboratory during the design phase. However, permeability is more difficult to measure in the field. Indirect measures of permeability are often used, like voids in the mix. Research by Cooley et al (2002) has shown that the effect of nominal aggregate or particle size (NMAS or NMPS), lift thickness, density, etc, all influence voids in the mix, and therefore permeability. The relationship between voids in the mix and permeability shows a range of voids in the mix where permeability actually starts and thereafter increases exponentially. This start of permeability is where the voids become interconnected and permeability increases with increase in interconnectedness of the increasing voids.
This field of the uncertainty regarding the interconnectedness of voids is a complex field that deals with well-known concepts like absorption, water saturation, capillary hysteresis, capillary pressure, moisture dispersion, tortuous flow in porous media, phase permeability and apparent permeability (Koponen et al 1996; Cherry & Freeze 1997; Cedergren 1997). Complex modelling of hydraulic conductivity has been used with great effect to monitor phases of permeability in isotropy and anisotropy (Kutay et al 2007). However, the approach here is to limit the discussion to normal (practical) road and pavement engineering aspects that have practical application in quality control / quality assurance (QC/QA) systems.
The tendency to design and specify for a minimum density (e.g. 97% minus voids and a minimum 92% Rice density) and a range of air voids (3% to 6%) is clearly intended to address rut resistance in the first place, but the upper limit of the derived voids in the mix is already close to the known precipice where permeability may increase exponentially. The situation in the field is often that marginal densities are accepted based on statistical methods used for density control, but the actual voids in the mix may have shifted over the proverbial precipice (e.g. 7% or more). Due to uncertainty with regard to the inter-connectedness of the voids, permeability may often start within the specified voids range, and the voids will have a higher probability to be fully interconnected at higher voids percentages. A better indicator of interconnectedness of voids via aggregate grading characteristics is needed to monitor permeability potential in asphalt mixes as an addition to normal QC/QA measures.
BAILEY METHOD AS BASIS OF CALCULATIONS
Bailey method definitions and ratios
The fundamental correctness of the volumetric ratio of the Bailey method and the acceptance world-wide as a guide to enhance good asphalt mix designs (Vavrik et al 2001; TRB 2002) make the Bailey method an ideal reference system in the analysis of grading envelopes. In such analyses, the bituminous binder is seen as the glue that keeps the skeleton matrix together via adhesion and cohesion characteristics like the filler binder ratio or mastic or effective film thickness concepts (Butcher & van Loon 2013), but is not considered in this analysis and discussion regarding the link with permeability. Admittedly, this creates a 'greyness' in the data, which implies final analysis for monitoring permeability potential may best be served with a benchmark approach. The Bailey method terminology is used throughout for description of specific aspects of the grading envelope. The definitions of various Bailey control sieves and associated ratios are described as follows (Vavrik et al 2001):
■ Maximum Nominal Particles Size (NMPS) as per the Superpave definition: "One size larger than the first sieve that retains more than 10% aggregate." This was changed lately to 15% (SABITA 2016).
■ Half Size (HS) is defined as the sieve size closest to or equal to half the NMPS.
■ Primary Control Sieve (PCS) is the sieve size closest to 0.22 χ NMPS.
■ Secondary Control Sieve (SCS) is the sieve size closest to 0.22 χ PCS.
■ Tertiary Control Sieve (TCS) is the sieve size closest to 0.22 χ SCS.
Additional aggregate size range descriptors and terminology often used in literature are:
■ Interceptors: The size range between HS and PCS
■ Pluggers: In the original Bailey method description (Vavrik 2001) they are defined as all aggregate fractions larger than half size. However, "Pluggers" can be divided into:
■ Pluggers up to NMPS (PN). The size ranges between HS and NMPS. Horak et al (2017a&b) referred to this as Pluggers.
■ Oversize pluggers larger than NMPS (PO). The oversized aggregate is larger than NMPS. Horak et al (2017a&b) referred to this as Oversize.
Three original Bailey Method Ratios (BMRs) were defined as the ratio between various aggregate fractions. These BMRs are used for gauging strength contribution in the aggregate skeleton. They were originally defined as:

Fine aggregate coarse ratio:
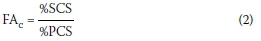
Fine aggregate fine ratio:
Note: CA ratio consists of contiguous (following each other) aggregate fractions, while both FAc and FAf have aggregate fractions that overlap. This distinction will become clearer in the next sections.
Linking Bailey Method Ratios (BMRs) directly with permeability
Horak et al (2017a&b) investigated various research papers dealing with the link between aggregate grading and structural strength and permeability. Typically, investigations by Al Mosawe et al (2015) confirmed the structural strength of the asphalt mix often tends not to be dependent on the packing efficiency at the macro level of the aggregate grading (typically the Bailey coarse fraction, e.g. the CA ratio) alone, but surprisingly more so at the middle level of the aggregate grading (midi or rather meso level). The original BMRs tend to lack distinction of various fractions in the midi or rather meso level. Al Mosawe et al (2015) confirmed the potential for an interference/disrupter effect caused by the intermediate aggregate sizes (interceptors). In continuously graded mixes (stock trade of South African HMAs), the grading adheres to a Talbot-type grading curve, and therefore fine/coarse aggregate size ratios do not always allow for just filling of the voids between the larger plugger aggregates, but can in effect also be pushing the larger aggregates apart. Therefore, the coarse portion of the fine aggregates range with the interceptors may often take over the dominant structural contribution, as is known to happen with sand skeleton continuously graded HMAs (SABITA 2016). Al Mosawe et al (2015) therefore developed a more descriptive BMR for these midi or rather meso level aggregate fractions covering fine of the coarse to the coarse of fine aggregate range. They are described in Equations 4 and 5. What is significant is that they have contiguous (successive) aggregate fractions in the numerator and denominator. Komba et al (2019) have subsequently also confirmed the value of such contiguous meso level ratios in compaction and strength gain studies. As noted before, the original fine BMRs defined in Equations 2 (FAc) and 3 (FAf) do not have such contiguous aggregate fractions and end up as poor indicators of strength or permeability.
Sadasivam and Khosa (2006) determined that the permeability of a structurally competent asphalt mix is influenced by the packing arrangement (retained fraction alone and fraction ratios) at the rather meso level (typical interceptors) and their void infill at the micro level by the fines. This was also emulated and confirmed by Denneman et al (2007) with typical South African-designed continuously graded mixes. Horak et al (2017a&b) summarised such recent research and analysis of the grading characteristics, as well as BMRs and their correlation with strength and permeability. Horak et al (2017a) confirmed it is largely the fines at the micro level that correlates best with permeability by reworking the data sets of a number of such published permeability studies. Of the original BMRs, it is only the CA ratio which showed some correlation with permeability, whereas FAc and FAf were insignificant. The results show an improved understanding of the importance of certain meso-range to micro-range aggregate sizes, but still do not give adequate or reliable indication of the permeability potential. This helped to indicate that there was obvious room for improvement in the aggregate grading envelope analysis and the determination of porosity. Porosity as a volumetric indicator seemed to be the best way to get to an improved understanding of how it relates to permeability.
POROSITY DETERMINATION OF AGGREGATE RATIOS
Dominant Aggregate Size Range (DASR)
The limitations of using the BMRs for permeability monitoring (Horak et al 2017b) created the need to investigate the grading envelope in more detail and establish a closer link with permeability or 'a handle' on the interconnected voids. Olard (2015) makes use of the nesting principle to 'deconstruct' the grading envelope as three subsets of infill aggregate skeletons in analysis and even asphalt mix designs. In this way macro, midi or rather meso and micro level subsets can be defined (Horak et al 2017a), which certainly helps to understand the contribution of various aggregate fractions at various positions on the aggregate grading envelope. It allows for the visualisation of how the increasingly smaller voids of each skeleton subset is filled in with smaller or finer aggregate combinations in specific or preset volumetric proportions. The mantra of the original Bailey method that the 'voids are in the fines (Vavrik et al 2001; TRB 2002) is confirmed via this three-level aggregate skeleton analysis. This implies finer aggregate filling the coarse (macro skeleton), and then even finer aggregate fractions filling the voids left in the midi or rather meso level, and finally micro level fines filling the resultant voids at the micro level. This nesting concept highlights the concept of contiguous aggregate fractions as the basis for determining porosity of sections of an aggregate grading. The need for ratios to adhere to contiguous aggregate ranges indirectly led Al Mosawe et al (2015) to derive the midi or rather meso level BMRs described by Equations 4 and 5.
Porosity has a more direct relationship with permeability in that permeability is facilitated by the interconnectedness of voids in the asphalt mix. The Dominant Aggregate Size Range (DASR) concept has the same basis as the Bailey method in the size ratios (less than 0.22) that determine the densest possible aggregate packing. However, the DASR method relies on porosity determination (Horak et al 2017a&b) of a range of contiguous aggregate fractions that provide the lowest porosity. Low porosity, below 0.5 to 0.4, implies density of aggregate packing and increased aggregate skeleton strength due to interlock.
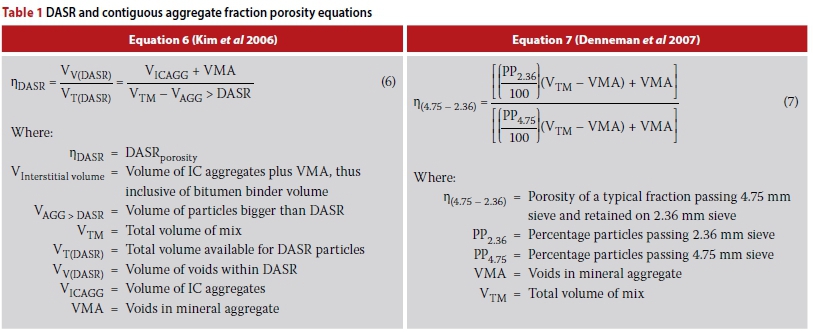
Denneman et al (2007) showed how it is possible to simplify the DASR porosity calculation when limited to a single or combination of two contiguous aggregate fractions. In Table 1 the DASR porosity Equation 6 is defined for a contiguous range (often more than two) and the simplified calculation to determine a single fraction, or contiguous range of aggregate fractions, is defined as Equation 7.
The Denneman et al (2007) analysis of permeability propensity of various South African continuously graded mixes used only the original BMRs. FAc and FAf are insignificant to permeability sensitivity for reasons of lack of contiguousness. Nevertheless, the work by Al Mosawe et al (2015) enabled the understanding that contiguous aggregate fractions can in effect be determined for other aggregate fractions along the whole grading envelope and be able to determine porosity for each such contiguous aggregate combinations. This allowed investigation of the application of BMRs and calculated porosity of single aggregate fractions and DASR contiguous aggregate fractions, and correlating them with permeability or inferred permeability.
Revised Bailey Method Ratios (BMRs) based on contiguous aggregate fractions
As described in the preceding section, it is possible to calculate porosity for contiguous aggregate fractions using Equation 7 (Denneman et al 2007). The typical aggregate sieve fractions used in South Africa, as well as the new South African National Standards (SANS) sieve sizes, basically tend to have a size ratio (fine/coarse preceding) of 0.5 particularly at the meso and micro nesting levels. However, at the macro level and a portion of the midi or rather meso level the ratio of consecutive sieve sizes is closer to 0.8, implying there are more sieve descriptions at these macro and midi or rather meso skeleton levels. Typically sieve sizes at 3.35 mm, 1.18 mm, 0.85 mm, 0.71 mm, 0.425 mm, 0.335 mm, 0.25 mm, 0.212 mm, 0.18 mm, 0.125 mm, 0.106 mm, 0.09 mm, 0.63 mm, 0.045 mm, 0.038 mm, 0.032 mm and 0.020 mm exist within the ASTM sieve ranges and are absent in the sieve sizes used. As may be shown later, the use of these sieve sizes can greatly enhance the analysis at the micro level of the whole grading envelope.
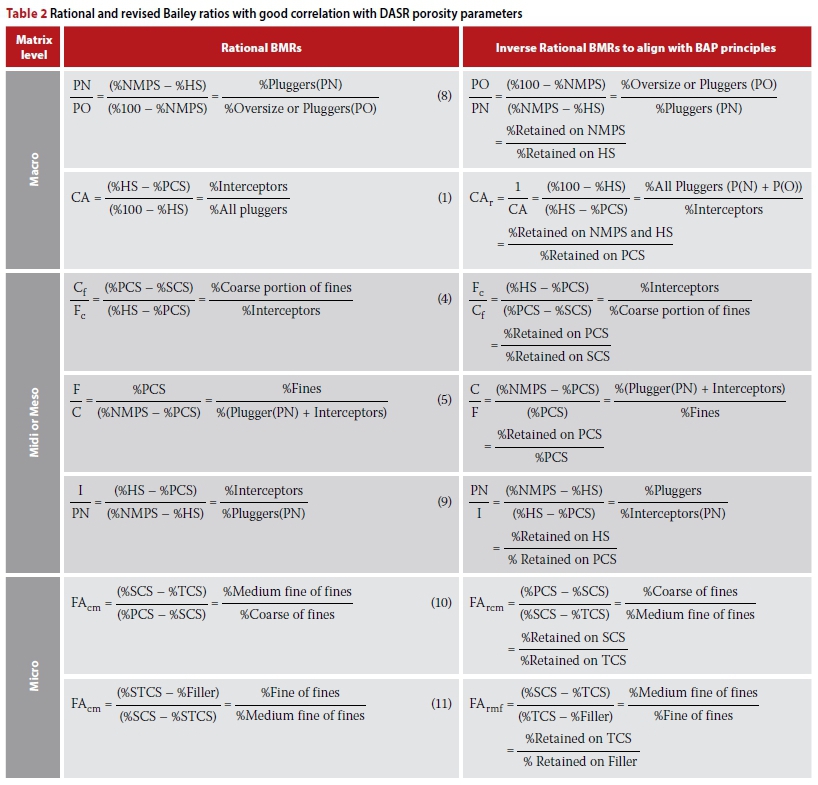
By exploring the consecutive contiguous aggregate fractions as per the SANS sieve openings an expanded set of BMRs could be described. These are referred to as rational BMRs and are shown in Table 2 for the aggregate grading matrix at macro, midi or meso and micro levels. It shows the rational BMRs in the first column and the inverse of the rational BMRs in the second column. The logic of this latter inverse rational BMRs will be discussed later. Only the rational BMRs either retain their original equation number or the new ones receive new numbers in Table 2.
As discussed above Al Mosawe et al (2015) already demonstrated the potential for these rational BMRs for structural strength indicators. It has also been demonstrated by Horak et al (2017b) on reworked published data sets. Komba et al (2019) recently used these rational BMRs with success to provide better indicators for HMA compactability efficiency. Only limited work has been done on the full set of the rational BMRs linkage with permeability by Horak et al (2017a). Machine learning techniques have recently been used to develop permeability prediction of HMA based on the principles and approach described in this paper (Blaauw et al 2019), and Cromhout (2018) used it with success on QA/QC large data set analyses. The logic of the approach developed will be described next by focusing on identifying parameters linked to interconnected voids as main indicator of permeability potential.
IMPROVED INTERCONNECTED VOID MONITORING WITH BINARY AGGREGATE PACKING (BAP) PRINCIPLES
BAP origin and conversion to asphalt mix design
The original work by Furnas (1928) with binary and ternary aggregate fraction combinations was based on experimental work and observations of beds of broken coarse and fine solids (aggregates which form the basis of the understanding of Binary Aggregate Packing (BAP) principles). His work was developed further by various researchers in pursuit of efficient aggregate packing of concrete mixes, and was subsequently transferred to asphalt mix design by a number of researchers (Baron & Sauterey 1982; Francken & Vanelstraete 1993; De Larrard & Sedran 1994; Olard & Perraton 2010; Butcher & Van Loon 2013). Furnas originally determined the basic volumetric particle diameter ratio of 0.20 to 0.23 of fine aggregate to coarse aggregate size ratio below which the voids between the coarse aggregate particles can be filled by the fine particles at optimum packing density and obviously optimum structural strength. This is the same principle (0.22 ratio fine/ large) that was subsequently used by the Bailey method as basis (Vavrik et al 2001). Low porosity is achieved at or below this size ratio and thus the implied structural strength provided via the aggregate skeleton is strong.
In the case of the DASR method the volumetric arrangement of aggregate fractions is the combination of a range of contiguous aggregate fractions (mostly more than two) which have the lowest or optimum porosity (preferably below 0.5 and typically closer to 0.4). This efficient aggregate packing is obviously reliant on the basics of the binary aggregate packing principles. Olard and Perraton (2010), and Butcher and van Loon (2013) describe how this theoretical basis of BAP, expressed in terms of size and volume ratios, can be used to achieve optimum packing for asphalt mix design at the lowest porosity.
The BAP porosity triangle
The real insight provided by this approach regarding the aggregate interaction at each skeleton subset level comes from the use of BAP porosity 'triangle' diagrams (Francken & Vanelstraete 1993; Olard & Perraton 2010; Shivaprasad et al 2014; Butcher & Van Loon 2013; De Larrard & Sedran 1999; Mangulkar et al 2013; Perraton et al 2007).
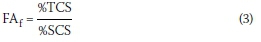
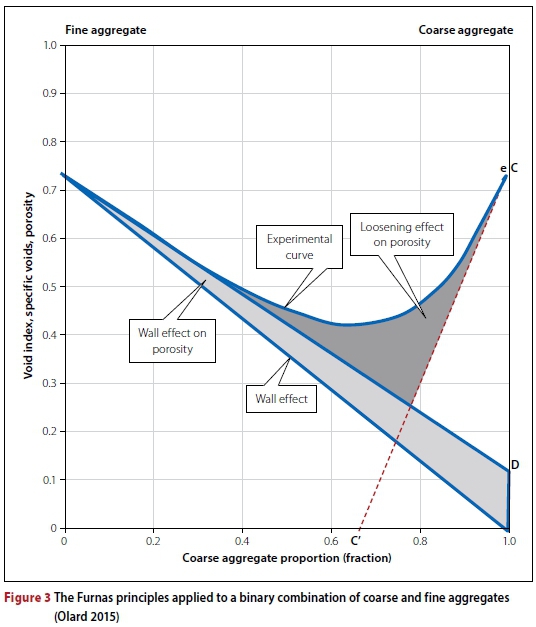
These BAP porosity triangle diagrams were developed to relate porosity or void indices or specific voids to various proportions of coarse aggregates and fine aggregates. The basic BAP triangle diagram is illustrated in Figure 1 and is based on the original work by Furnas (1928). The concepts of voids, porosity and specific voids are interrelated, and in this paper are assumed to entail the same concept of an index of voids between solids prior to filling with binder and in general is referred to as porosity (Butcher & Van Loon 2013).
The porosity of the fine aggregate (left Y-axis in Figure 1) and the porosity of the coarse aggregate (right side Y-axis in Figure 1) are higher than the porosity of the combination of the two fractions as a binary fraction combination. Olard (2015) demonstrated that these size ratios (fine/ coarse) form a family of curves (concave functions) with variable combined porosities lower than the porosity of either fraction separately. The porosities of the combined binary fractions also vary in terms of the proportion of the volumetric ratio of coarse/ fine (X-axis in Figure 1) along these concave form functions. In Figure 1 it is shown that the optimum or lowest point of porosity achievable, the dilation point, is found for any size ratio (fine/coarse) concave function proportion; at a specific coarse-to-fine aggregate volume ratio the two aggregate sizes combine (see the X-axis).
The concave curves tend to be much more pointed (lower porosity) below the 0.2 value (equivalent to Bailey ratio of 0.22) for the fine/coarse diameter ratio range, therefore the densest possible packing. The reverse is also true, that if the fine/coarse size ratio exceeds 0.2, the concave function flattens out and the proportion of coarse aggregate per volume (or mass) becomes increasingly less influential with regard to reduction in the combined fraction porosity as this ratio approaches 0.5. Thus, the logic and basis of the Bailey control sieves are confirmed to correlate with the binary packing triangles as well. The size ratio determines the shape of the concave function and shows that, for the flatter shaped concave functions, the potential to lower porosity is reduced irrespective of volume ratio changes on the X-axis. Most of the contiguous aggregate fractions along the entire grading envelope of a typical continuously graded mix used in South Africa (see Table 2) are spaced at the 0.5 factor or more, which implies that the upper flat concave shaped function is mostly applicable. This implies that there may be limited scope in lowering porosity with the known sieve sizes at the midi or rather meso and micro levels of the grading envelope.
Wall and loosening effects on porosity in Binary Aggregate Packing (BAP) triangles
Under ideal conditions the two dotted lines in Figure 1 are the outer boundaries of the possible physical zone of potential porosity achievement between the fine and coarse aggregate in the binary combination. The basic concave form of curves was developed by Baron and Sauterey (1982) based on the original experimental work of Furnas (1928) and the influence in practice on porosity due to a retardation effect on porosity reduction. This resistance to porosity reduction was found to be due to two physical phenomena: (1) The wall or boundary effect, and (2) The loosening or disruptor effect. Both concepts are illustrated in Figure 2 (Knop & Peled 205) for a realistic aggregate mix situation.
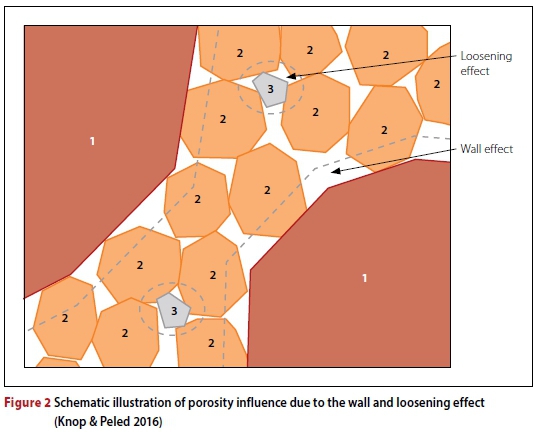
The wall effect is due to the void increase caused by the boundary or wall created by the large aggregate (1 in Figure 2) acting as boundary to the finer sized aggregates (2 in Figure 2), and the voids against the large aggregate "wall" being prevented from being infilled by other medium-sized or fine particles. This "wall effect" is creating additional unfilled void space next to the larger aggregate boundary, and in effect resisting the lowering of porosity. It is also obvious that these voids against the "wall" have a higher probability to be interconnected along a defined plane (the wall) with obvious influence on water flow and permeability.
The loosening or disruptor effect is due to the increase of the fine or smaller aggregate particles in the large or medium aggregate voids to the point where they "overfill the voids" and in effect start separating or pushing the larger aggregates apart. In effect, the void index or porosity is again prevented from being lowered. Therefore, these additional voids created would also increase the probability of being interconnected on their own or enhance the interconnectivity, particularly if linking up with the wall effect and creating "additional interconnected voids".
These phenomena hold the key to monitoring the interconnectedness of voids. The two effects combined for a specific diameter ratio concave function are shown in the coarse/fine volume ratio variance in the basic binary triangle diagram in Figure 3 (Olard 2015). The zones where the porosity is restricted from decreasing are clearly indicated. The relations in the binary packing triangle diagrams are shifted upwards from the theoretical maximum linear relationships to a concave form porosity function as illustrated in Figure 3. The zones where the wall effect and the loosening effect lead to increased porosity versus the minimum potential with the theoretical function are clearly identified by the hatched areas. The most obvious differentiator is the varying coarse/ fine aggregate proportion by volume in this binary fraction combination as it varies on the X-axis. The zone around the dilation point position on the X-axis is shown in Figure 3. This dilation zone clearly leads to a maximisation of the potential intercon-nectedness of these additional voids created in the aggregate matrix. In this zone from left to right on the X-axis, and leading up to the dilation point, the wall effect increasingly dominates (0 to 0.6 coarse in the mix). In the dilation point zone (0.6 to 0.8 of coarse in the mix) the "additional voids" with a higher probability of being interconnected are influenced by both the wall effects and loosening effects increasing the combined porosity or resistance to porosity reduction. It is noted that the combined porosity rate of increase is the highest at the dilation point (0.8). To the right side of the dilation point the percentage of coarse aggregate dominates in the mix (right hand side in Figure 3) and where the loosening effect contribution tends to reduce while the wall effect continues to increase and the combined "additional porosity" tends to reduce.
Direct influence of BAP ratios on permeability
Experimental work by Mota et al (2014) on binary aggregate combinations for filter beds is illustrated in Figure 4. It illustrates how Mota et al showed the coefficient of permeability (Y-axis in Figure 4(a)) is affected by the coarse/fine aggregate volume ratios (X-axis in Figure 4(a)), as well as the diameter ratios. In Figure 4(a) the trend shown illustrates that coarse/fine volume proportion ratios from 0 to 0.6 are virtually insensitive to the permeability measured. This is the zone where the fine aggregate volume fraction will be proportionally higher in the mixes as per Figure 3.
Figure 4(a) was determined with a fixed diameter ratio (coarse/fine ratio) of 10.22. This translates to the inverse as per Figure 1 of fine/coarse of 0.1, which implies low porosity. For binary mixes with coarse/fine volume ratios above 0.6 (therefore more coarse material in the mix) the permeability coefficient starts to increase significantly. Above the ratio of 0.8 the increasing trend is exponential. Thus, coarse/fine aggregate volume ratios of 0.6 and 0.8 can be viewed as threshold values. This threshold value also holds true even if the binary fraction size or diameter ratio is varied as illustrated in Figure 4(b). As was illustrated in Figure 2, the dilation point or optimum zone of the concave curve (coarse/fine ratio of 0.6 to 0.8) is levelled out if the D/d size ratios decrease, and obviously if the inverse d/D ratios increase as illustrated in Figure 2.
This basic observation of coarse aggregate size influence on porosity and permeability has already been demonstrated by Cooley et al (2002) via permeability testing on HMA mixes. They found that HMA mixes with NMPS in the range of 19 mm and 25 mm show increased permeability at low void contents (even 4% voids as threshold value) for asphalt mixes. The norm for HMA with 12.5 mm and lower NMPS in the mix is a threshold value of 7% voids in the mix (Cooley et al 2002), where after permeability measured will increase exponentially with further increase in air void content. This effect of NMPS in the HMA clearly demonstrates the wall effect (literally against the large aggregate surface) on increasing the interconnected voids in the mix.
It appears that an increase in permeability (see Figure 4(a)) may be linked to the wall effect and the loosening effect for coarser mixes when the threshold value of 0.6 coarse proportion in the mix is exceeded. This tends to confirm the 0.6 as lower trigger value described before. It appears that the size ratio (d/D) has a significant effect on permeability, but the form of the curves with volumetric ratio on the X-axis shows classical "lift off" behaviour around the 0.8 value previously described to be the dilation point in Figures 1 and 3. Therefore the 0.6 and 0.8 values of the volumetric ratios can be used as possible threshold values for permeability control at the various levels of macro, midi or rather meso and micro subset infill skeletons.
Several researchers state: "... when the specific gravity of the material is the same for all the aggregate fractions, the volumetric ratio or proportion of coarse and fine aggregates can be taken as equivalent to the proportion of percentages retained on the coarse and the fine aggregate sieves ..." as the basis of this simplified calculation (Butcher & Van Loon 2013).
Therefore, it should be possible to benchmark the various binary aggregate mass combinations making up the macro, meso and micro levels to monitor where adjustments can be made to aggregate gradings to achieve packing efficiency, as well as provide permeability control in a rational fashion.
Proposed mass ratio range as benchmark for interconnectedness of voids
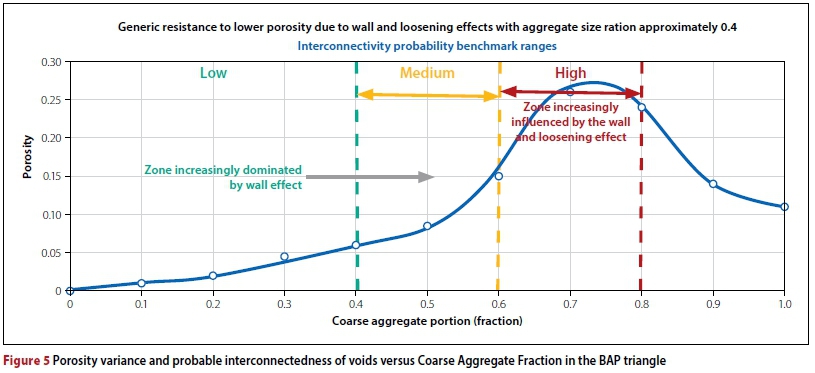
The discussion on the wall effect, loosening effect on porosity, and permeability indicates that the BAP "triangle diagram" (Figures 1 and 3) can be used as a benchmark measurement tool by combining the trends also shown in Figure 4. The trend in porosity versus the horizontal axis of the BAP triangle can be simplified as illustrated in Figure 5. Interconnectedness of voids, due to the wall and loosening effects described before, is also shown regarding their zones of dominance for these "additional and potentially interconnected voids". This conceptual trend in porosity is further enhanced by superimposing the implied RAG benchmark criteria for additional voids due to retardation, implying void intercon-nectedness. Red is high probability (BAP coarse aggregate mass portion is 0.6 to 0.8), Amber is medium probability (BAP mass coarse portion is 0.4 to 0.6) and Green is low probability (BAP mass coarse portion is 0 to 0.4). The benchmark ranges of the coarse aggregate percentage (horizontal scale), moving from left to right, first show the wall effect alone and then the addition of the loosening effect (increasingly combined). This helps to facilitate the evaluation of BAP ratios in terms of porosity or relative increase in interconnectedness, and therefore indirectly the permeability potential.
In order to convert the percentage of coarse in the BAP combination on the horizontal scale of Figure 5 it needs to be converted to coarse/fine as a mass ratio. In Figure 6 the relationship is shown graphically to illustrate how this conversion is achieved. This is to ensure that the porosity and BAP coarse/fine mass ratios (inverse of rational BMRs defined in Table 3) can be set on the same scale for direct comparisons.

TESTING THE BAP BENCHMARK CRITERIA WITH REWORKED PUBLISHED DATA SETS
Description of the reworked published data sets
Three data sets were initially available for analysis to demonstrate the effect of the coarse/fine ratios and the associated porosities on permeability. The three data sets are from Denneman et al (2007), Al Mosawe et al (2015), and Sadasivam and Khosa (2006), previously also reworked by Horak et al (2017a&b).
Horak et al (2017a&b) previously found that trends are best observed by focusing on the high and low permeability extremes of the data set, as the middle permeability ranges gave confusing results due to the now known randomness or variance in void interconnectedness. It needs to be stressed that these various data sets do not always have actual permeability measurements to enable a clear discernment between low permeability and high permeability data sets. Typically, Denneman et al (2007) only expanded on criteria developed by Sadasivam and Khosa (2006). Thus, the Denneman et al (2007) data sets related to probable permeability values indirectly and made a distinction between asphalt mixes with good and those with poor performance (primarily based on cracking observations), while rutting resistance was good in both cases. Sadasivam and Khosa (2006) did have actual permeability measurements, which allowed a high permeability data set and low or impermeable data set to be made up from the original.
Al Mosawe et al (2015) showed void content (%) in their published data set. It is known that high void content correlates well with higher permeability, typically above 6% (e.g. air voids % above 6%) for an NMPS of 12.5 mm where interconnectedness of voids starts and therefore permeability starts and increases (Cooley et al 2002)). In the analysis and reworking of data a distinction could be made between probable high permeability and medium to low permeability based on low void content and high void content. Therefore, only these upper and lower extremes of voids or permeability were used in the reworked data. The analysis was further simplified here by using only the average values for these categories to simplify the demonstration.
Example of macro to micro level binary fractions
Explaining the benchmark comparison graphs
The data sets presented by Denneman et al (2007), which have been reworked before to determine the Bailey ratios and DASR porosities of ranges of aggregate fractions (Horak et al 2017a), were used as worst-case example of data quality with regard to permeability. The data set was reworked as explained above with rational inverse BMRs to represent the binary aggregate fraction contiguous combinations for the whole spread of macro, midi or rather meso and micro nested aggregate subsets. The various aggregate fraction combination porosities are calculated in terms of coarse/ fine mass ratios by means of Equation 7. Figures 7 and 8 use a single ratio axis covering the porosity (Y-axis) of the triangle binary packing diagrams, as well as the inverse rational BMR (which is the ratio of coarse/fine by mass (% retained per fraction in the ratio) measured against the conversion as illustrated in Figure 6. The third bar indicator shown is the product of the mass ratio and porosity as a further possible combination indicator of the two calculated factors.
The RAG zones, as defined in Figures 5 and 6, are superimposed on these graphs to help identify binary fraction mass ratios which may extend into the Amber zone (between 0.6 and approaching 1.5 mass ratio) where the wall effect dominates, or the Red zone (above the mass ratio of 1.5) where both the wall effect and the loosening effect show a higher probability of interconnected "additional voids".
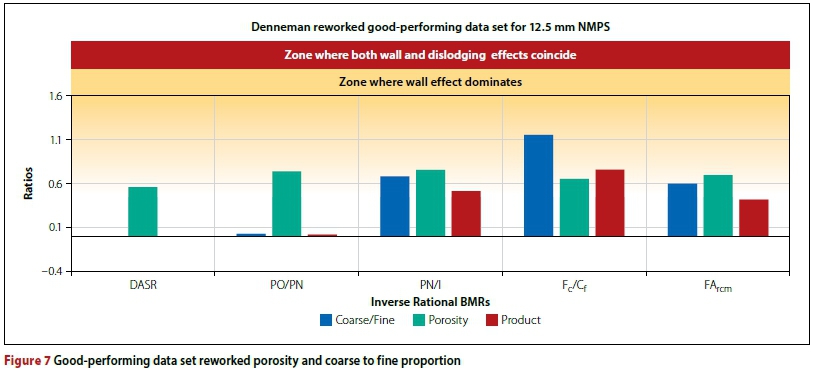
Good-performing mix
The coarse/fine mass ratios, porosity and product of the former two are shown in Figure 7 for the Denneman et al (2007) good-performing HMA data set. All the bar charts for various contiguous aggregate fractions show that they are either in the Green or Amber zones. It clearly shows that the coarse/fine mass ratios for all the BMRs are all below the superimposed dilation zone (Red zone), and therefore the probability of voids being interconnected is low, as per the description in Figure 5. In all cases the porosity value is the lowest and is indicated as reference for the possible lowest porosity value that confirms the intended or designed best structural strength of the stone skeleton.
The only inverse BMR with a mass ratio (coarse/fine) which reaches into the Amber zone is the midi or rather meso level Fc/Cf which reaches closest to the Red zone superimposed in Figure 7 at a value of 1.15. This implies the coarse portion (Fc) is marginally more than the fine portion (Cf). Therefore both the wall effect and the loosening effect are at play here. However, this should be interpreted with the next level inverse rational BMR, FArcm, which shows that the potential voids caused by the wall and loosening effects in Fc/Cf have been filled, as FArcm has a mass ratio on the border between Green and Amber, therefore limited possibility of interconnected voids and low permeability probability.
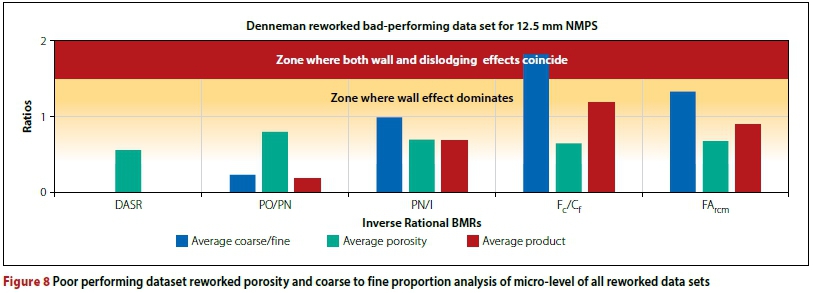
Poor-performing mix
The Denneman et al (2007) dataset of poor-performing asphalt mixes is shown in Figure 8. The coarse/fine retained sieve mass ratios, the associated combined porosity values and the product of these two factors are shown. It is the consecutive contiguous coarse/fine mass ratios of the parameters PN/I, Fc/Cf and FAcrm that have values in the Amber zone. This implies that the macro level PO/PN at the plugger (oversize and normal size) zone of the aggregate grading envelope has no additional voids created, but the void creation due to the wall and loosening effects start at the midi or rather meso level with the PN/I which is not filled by Fc/Cf and in turn finally not by FAcrm. Therefore this dataset shows there is a high probability of interconnected voids not being filled at the micro level, and therefore a high probability of it being permeable. Bhattacharjee and Mallick (2002), in their search for a better "handle" on permeability, focused on the finer portion of the grading, as well and stated: "Porosity is significantly affected by percent of material passing 2.36mm sieve." This tends to confirm the Bailey mantra that "the voids are in the fines!" where interconnectedness finally happens and therefore the probability of permeability is increased. This observation can be paraphrased as: 'The void infill buck stops at the bottom of the grading envelope and if not filled it will create opportunity for interconnected voids."
To demonstrate the statement about the micro level as the most probable level where voids may not be effectively filled, the micro level inverse rational BMRs (FArcm) for all three data sets were calculated for the good-performing as well as poor-performing extremes of their data sets, and are shown in Figure 9.
The Denneman et al (2007) data sets show that the porosity values are not significantly different if the good- and poor-performing data sets are compared. The porosity range is between 0.6 and 0.7, implying that this binary aggregate combination may have adequate density achievement at this level. However, the mass ratio (coarse/fine) for FArcm, clearly can discern between the poor- and good-performing datasets, as the values differ significantly. The bad-performing dataset FArcm mass ratio value shows a strong wall effect impact on porosity and is well within the Amber zone. The product value (Product = FArcm χ Porosity) obviously shows the dominance of the FArcm and implies that the potential for interconnected voids may be high, thus increasing the potential for water flow or higher permeability values.
The Sadasivam and Khosa (2006) reworked data shows the same trend or sensitivity to coarse/fine mass ratio and combined porosity values at the micro nested aggregate skeleton subset level. In this case permeability was measured, which indicates that the FArcm mass ratio may in fact be the real discriminating factor between permeable and low permeable mixes. The associated porosity values are in the same range for the high and low permeability values, therefore confirming porosity alone is not a reliable discerning factor of permeability potential. The mass ratio of FArcm of the permeable dataset is clearly exposed to both the wall and loosening effect, being in the Amber zone close to the Red zone. This implies a higher possibility of interconnected voids. The low permeability FArcm mass ratio is at the border between Green and Amber, implying low interconnected voids. The product value (Product = FArcm x Porosity) confirms porosity exposed to the wall, as well as that the loosening effect may be indicating a tendency for the voids in the porosity to have interconnectedness of voids.
In the case of the Al Mosawe et al (2015) reworked data set when porosity and mass ratio are calculated for FArcm the porosity gives confusing results at first glance. The calculated porosity for the FArcm contiguous aggregate fraction range is high for the low air voids and low for the high air voids. This is contrary to expectation, as it would have been expected that porosity, like high voids content (%), tend to have a higher probability to be directly linked to high permeability, and vice versa. The low air void data set FArcm mass ratio value is, however, relatively small (well within the Green zone). This implies limited, if any, wall effect on the porosity, i.e. low potential for the porosity or air voids to be interconnected, and therefore low probability of being permeable.
The high FArcm mass ratio value, however, is in the Amber zone for high air voids. This implies that the voids represented by the medium-range porosity are in fact exposed to both the wall and the loosening effects. This dataset may therefore have a higher probability of interconnected voids, and as a result a higher permeability probability. The product in this case is not necessarily a good indicator of permeability, due to the confusing result of the porosity. Therefore the product as an indicator is not viewed as a reliable indicator of interconnectedness of voids and should not be used on its own.
In this respect Bhattacharjee and Mallick (2002) support the use of porosity on its own as a better indicator of permeability potential, but in their case it implies the porosity of the whole gradation.
CONCLUSIONS
Voids alone cannot effectively measure permeability potential
Permeability as durability indicator can be measured under controlled conditions in the laboratory, but is more difficult to measure in the field for quality control and assurance purposes. Indirect measures using the void content in the mix are less precise than desired. The reason is that the voids may not be continuously interconnected, and for the same void content permeability can be either non-existent or already even highly probable. Normal density specifications also imply that the range of voids specified may stretch beyond limits, which tend to show an exponential increase in permeability once the voids become increasingly interconnected. Therefore additional indicators linked with the aggregate grading need to be identified to help monitor permeability potential.
Reconfiguring the Bailey Method Ratios to adhere to contiguous aggregate fractions
The Bailey Method Ratios (BMRs) were investigated as potential indicators of inter-connectedness and permeability with limited clear linkage or correlation. In studying the Dominant Aggregate Size Range (DASR) it was observed that contiguous aggregate fractions can be used to calculate porosity as an indication of density. The BMRs were therefore reconfigured by using only contiguous fractions in the calculation of a whole expanded set of revised or rational BMRs. Porosity thus calculated for rational BMRs also runs into the same issue as with voids in the mix. Porosity alone is also not an indication of permeability, but rather the interconnectedness of the voids. Spatial composition is defined (SABITA 1999) as "... the three-dimensional modelling of asphalt at macro, meso and micro level. Spatial composition is the only volumetric way to obtain a holistic understanding of the complex interactions between the several components, being bitumen, coarse and fine aggregate, filler, air and water." Therefore the reconfigured and expanded BMRs' biggest contribution is the provision of a better definition of structural strength, as well as possibly permeability. Future work should include the aspects of effective film thickness and mastic in the aggregate spatial composition.
Linkage with the Binary Aggregate Packing concept
The "deconstruction" or nesting of the total aggregate matrix in sub-skeletons at the macro, meso and micro levels of the total grading curve of HMA provides insight into the actual packing of the voids at each aggregate fraction level. The Binary Aggregate Packing (BAP) concept was investigated and found to describe the actual packing of the aggregate fractions and resultant voids at the various nested subset levels quite well.
The BAP concept is described in terms of the coarse/fine retained mass ratio, characteristic concave functions based on size ratio, porosity of individual fractions and porosity of the combined aggregate fractions in the BAP porosity triangle diagrams. The curves of the coarse/fine combination versus porosity have characteristic concave shapes, influenced by the ratio of the fine/coarse aggregate size ratios.
It was observed that the rational BMRs are the inverse of the rational BPA mass ratios. These inverse rational BMRs allow the description of the void packing or infill efficiencies at the macro, midi or rather meso and micro nested subset levels of a grading envelope. It therefore allows monitoring of structural, as well as porosity and permeability, control aspects.
Phenomena in BAP porosity triangles that can be linked to void interconnectedness
The two phenomena that restrict porosity reduction (therefore also a denser mix) in BAP aggregate fractions studied in the BAP triangle of porosity determination were identified to give a better indication of potential for interconnectedness of voids. It was shown how the coarse/fine mass ratio has a dilation zone, whereas the wall effect and the loosening /dislodging effects tend to restrict porosity and have a tendency to be interconnected. These effects were transferred from these BAP triangle diagrams to allow a typical colour-coded three-tiered RAG benchmark indication for void interconnectivity by using the coarse/ fine mass ratios with porosity for various contiguous inverse rational BMRs.
Demonstration of mass ratio benchmark potential
The potential of the benchmark criteria was demonstrated with the reworking of published data sets with directly or indirectly measured permeability. Only the extremes of the data sets - high permeability or low permeability - were used, due to the statistical variance of voids in the mix in the midrange described before. The analyses showed that the coarse/fine mass inverse rational BMRs function independently from porosity values and tend to correlate well with void interconnectedness and therefore permeability potential. It was also found that the Bailey method mantra (that the voids are in the fines) holds the key, and that successive levels of void infill down to the micro level may be the best indicator of permeability, due to the mass ratio at the lowest level still not properly infilled with a graded finer aggregate. The critique on the current SANS sieve system is the lack of in-between sieve sizes at the midi or rather meso and micro levels.
This may imply that structural design overemphasis leads to a lack of control and analysis opportunity at the these lower levels, which may negatively influence permeability control and awareness.
Simple spreadsheet calculations of the inverse of rational BMRs can be used
It is clear that a simple spreadsheet analysis of the inverse of rational BMRs derived from contiguous aggregate fractions on the grading envelope can be used to assist and monitor the potential for permeability. The link of rational BMRs with porosity retardation or probable interconnected voids, due to the wall effect and loosening/ dislodging effects, show that it can be used in a benchmark or sensitivity analysis to indicate potential for void interconnected-ness and therefore permeability potential. If coupled with other standard quality control/assurance measures like density and voids in the mix, a better idea can be derived whether a mix may be prone to permeability, even though it may meet rut resistance criteria.
Additional testing
Even though only average values were used in the demonstration of the concepts with reworked dataset extremes, the use of the inverse rational BMRs with full data-sets using Probability Density Functions (PDFs) (Cromhout 2018) has proved itself as a viable benchmark that can discern between probable permeable and not-permeable using as-built and QA/QC data. Other indicators of probable permeability indications are also available to be calculated on a continuous basis also linked to normal QA/QC or as-built and grading envelope information (not discussed here). These approaches can be used in a typical forensic investigation mode (NCHRP 2013) to identify areas of constructed asphalt surface that benchmark or predict as marginal to strongly permeable. Such areas of asphalt pavement can be isolated or demarcated to be investigated in more detail. This zooming in or more detailed field surveys (Horak et al 2015) may typically include:
■ Normal coring with density and void determination
■ Marvil field permeability testing
■ Laboratory permeability testing
■ Visual evaluation of the core surface void interconnectedness appearance
■ Computed themography scans and analysis (Horak et al 2015).
REFERENCES
Al Mosawe, H, Thom, N, Airey, G & Albayati, A 2015. Effect of aggregate gradation on stiffness of asphalt mixtures. International Journal on Pavement Engineering & Asphalt Technology, 16(2): 39-49. [ Links ]
Alshibli, K A & El-Saidany, H A 2001. Quantifying void ratio in granular material using Voronoi Tesselation. ASCE Journal of Computing in Civil Engineering, 232-238. [ Links ]
Baron, J & Sauterey, R 1982. le Be'ton hydraulique: Connaissance et practique. Paris: Presses de l'Ecole Nationale des Ponts et Chaussée'es (in French). [ Links ]
Bhattacharjee, S & Mallick, R B 2002. An alternative approach for the determination of bulk specific gravity and permeability of hot mix asphalt (HMA). International Journal of Pavement Engineering, 3(3): 143-152. [ Links ]
Blaauw, S A, Maina, J W & Horak, E 2019. Towards a hot mix asphalt design model for the prediction of durability. Submitted for publication to Construction and Building Materials. [ Links ]
Burtseva, L & Werner, F 2015. Modeling of spherical particle packing structures using mathematical tessellation, Technical Report. Available at: DOI: 10.13140/2.1.2664.7840. [ Links ]
Butcher, M & Van Loon, H 2013. SMA Mix design via binary packing triangle concepts. 15th Proceedings, International Conference on Flexible Pavements Conference, September, Sydney, Australia. Available at: https://www.resreachgate.net/publications/27312395. [ Links ]
Cedergren, H R 1997. Seepage, Drainage and Flow Nets, 3rd ed. New York: Wiley Technology and Engineering. [ Links ]
Cherry, R A & Freeze, J A 1979. Groundwater. Englewood Cliffs, NJ: Prentice Hall. [ Links ]
Cooley, L A, Zhang, J, Kandhal, P S, Hand, A J & Martin, A E 2002. Significance of restricted zone in superpave aggregate gradation specification. Transportation Research Circular No. E-C043. Washington, DC: Transportation Research Board. [ Links ]
Cromhout, A B M 2018. Investigating links between permeability and aggregate packing principles for asphalt mixes. MEng dissertation, University of Stellenbosch. [ Links ]
Denneman, E, Verhaeghe, B M J A & Sadzik, E S 2007. Aggregate packing characteristics of good and poor performing asphalt mixes. Proceedings, 26th Southern African Transport Conference (SATC), 9-12 July 2007, Pretoria. [ Links ]
De Larrard, F & Sedran, T 1994. Optimization of ultra high-performance concrete by the use of a packing model. Cement and Concrete Research, 24(6): 997-1009. [ Links ]
De Larrard, F & Sedran, T 1999. Une Nouvelle Approche de la Formulation des Bétons [A New Approach to the Formation of Concrete]. Annales du Batiment et des Travaux Publics [Annals of Building and Construction], 6: 39-54. [ Links ]
Francken, L & Vanelstraete, A 1993. New developments in analytical asphalt mix design. Proceedings, 5th Eurobitume Conference, June 1993, Stockholm, Sweden. [ Links ]
Furnas, C C 1928. Relations between specific volume voids and size composition on systems of broken solids of mixed sizes. USBR Report of Investigations, 2894, pp 1-10. [ Links ]
Horak, E, Marais, H, Hofsink, W & Van Aswegen, E 2015. Premature failures of asphalt wearing courses on newly constructed crushed stone basecourse. Proceedings, Conference on Asphalt Pavements in Southern Africa (CAPSA), 16-19 August 2015, Sun City. [ Links ]
Horak, E, Sebaaly, H, Maina, J & Varma, S 2017a. Relationship between Bailey and Dominant Aggregate Size Range methods for optimum aggregate packing and permeability limitation. Proceedings. 36th Southern African Transportation Conference (SATC), 9-12 July 2017, Pretoria. [ Links ]
Horak, E, Sebaaly, H, Maina, J & Varma, S 2017b. Rational Bailey and Dominant Aggregate Size Range methods correlated with rutting and mixture strength parameters. Southern African Transportation Conference (SATC), 9-12 July 2017, Pretoria. [ Links ]
Kim, S, Roque, R & Birgisson, B 2006. Identification and assessment of the Dominant Aggregate Size Range (DASR) of asphalt mixture. Journal of the Association of Asphalt Paving Technologists, 75: 789-814. [ Links ]
Knop, Y & Peled, A 2015. Packing density modeling of blended cement with limestone having different particle size. Construction and Building Materials, 71: 26-34. [ Links ]
Komba, J, Maina, J, Steyn, vdM W & Horak, E 2019. Relationship between aggregate packing characteristics and compactability of hot-mix asphalt mixes. Proceedings, International Airfield and Highway Pavements Conference, 21-24 July 2019, Chicago, IL. [ Links ]
Kopenen, A I, Kataaja, M & Timonen, J 1996. Tortuous flow in porous media. Physical Review E. Statistical Physics, Plasmas, Fluids and Related Interdisciplinary Topics, 5491: 406-410. DOI:10.1103/PhysrevE.54.406, August 1996 [ Links ]
Kutay, M, Aydilek, A, Msada, E & Hartman, T 2007. Computational and experimental evaluation of hydraulic conductivity anisotropy in hotmix asphalt. International Journal of Pavement Engineering, 8(1): 29-43. [ Links ]
Mangulkar, M N & Jamkar, S S 2013. Review of particle packing theories used for concrete mix proportioning. International Journal of Scientific & Engineering Research, 4(5), 143-148. [ Links ]
Mota, M, Teixeira, J A, Dias, R & Yelshin, A 2014. Effect of real particle packing with large size ratio on porosity and tortuosity of filter bed. Proceedings, 9th World Filtration Congress, 18-22 April 2014, New Orleans, LA. [ Links ]
NHCRP (National Cooperative Highway Research Programme). Guide for conducting forensic investigations of highway pavements. TRB Report 747. Washington, DC: Transportation Research Board. [ Links ]
Olard, F & Perraton, D 2010. On the optimization of the aggregate packing characteristics for the design of high-performance asphalt mixes. Road Materials and Pavement Design, 11 [Special edition featuring papers presented at the 2010 European Asphalt Technology Association Conference (EATA), held in Parma, Italy in June 2010]. [ Links ]
Olard, F 2015. GB5: Innovative design of highperformance asphalt mixes for long-life and cost-effective pavements by optimizing aggregates and using SBS modified bitumens. Proceedings, Conference on Asphalt Pavements in Southern African (CAPSA), 16-19 August 2015, Sun City. [ Links ]
Perraton, D, Meunier, M & Carter, A 2007. Application of granular packing methods to the mix design of stone matrix asphalt. Bullitin Nationale des Ponts et Chaussée'es (Paris), No 270-271. [ Links ]
SABITA (Southern African Bitumen Association) 1999. Conceptualisation of spatial composition, Second draft. ITT report 2-99. Contract Report HMA report HMA-8 (TFA2), Prepared by the Institute for Transport Technology, University of Stellenbosch. [ Links ]
SABITA 2016. TG 35/TRH8: Design and use of asphalt in road pavements, 2nd ed. Pretoria: SABITA. [ Links ]
Sadasivam, S & Khosa, N P 2006. Guidelines for selecting aggregate gradings for coarse-graded Superpave mixtures to control permeability. Proceedings, Transportation Research Board (TRB) Annual Conference, January 2006, Washington, DC. [ Links ]
Shivaprasad, D G, Kirankumar, B V & Manjunatha, S 2014. Gradation 5 (G5) - A new approach for asphalt mix design. International Journal of Engineering Science Invention, Research and Development, 1(IV): 155-161. [ Links ]
TRB (Transportation Research Board) 2002. Bailey method for gradation selection in hot-mix asphalt mixture design. Transportation Research Board Circular, No. E-C044. Washington, DC: Transportation Research Board. [ Links ]
Vavrik, W R, Pine, W J, Huber, G, Carpenter, S H & Bailey, R 2001. The Bailey method of gradation evaluation. Journal of the Association of Asphalt Paving Technologists, 70: 132-175. [ Links ]
 Correspondence:
DR EMI LE HORAK
Kubu Consultancy (Pty) Ltd
Centurion & JG Afrika Sunninghill
Johannesburg, South Africa
T: +27 11 231 2200, E: emileh@global.coza / horake@jgafrika.com
PROF JAMES MAINA
Department of Civil Engineering, University of Pretoria
Private Bag X20, Hatfield 0028, Pretoria, South Africa
T: +27 12 420 6608, E: james.maina@up.ac.za
PIETER A MYBURGH
Specialist Consultant
1 Rosenheim, Robinson Street, Durbanville 7550, South Africa
T: +27 82 883 5960, E: pmyburgh@ffg.net
HAISSAM SEBAALY
Department of Civil Engineering, University of Pretoria
Private Bag X20, Hatfield 0028, Pretoria, South Africa
T: +974 5554 9639 , E: haissam16@hotmail.com / u17404054@tuks.co.za

DR EMI LE HORAK (Pr Eng, FSAICE) obtained his first to highest engineering qualifications from the University of Pretoria. He also studied at the Universities of California, Berkeley and UNISA. His career started in technology transfer and research implementation attheCSIR, which remained his passion throughout his career as a pavement engineer. He had a short stint with a major contractor developing toll concessions and design-build-operate opportunities. He established himself as specialist consultant, and as such contributed to a number of mediation and arbitration cases on roads, materials and airports. He spent ten years as Professor and Head ofthe Department of Civil Engineering, University of Pretoria. His researcher status is recognised nationally and internationally, and he has more than 300 papers, journal articles and peer-reviewed conference papers to his credit.

PROF JAMES MAINA (Pr Eng, MSAICE, FSAAE) is a pavement engineer and full-time professor of civil engineering at the University of Pretoria. He is also adjunct professor at the Chang'an and Shandong Jianzhu Universities in China. He obtained his PhD from Miyazaki University in Japan. His professional activities include development of advanced numerical analysis (modelling) tools for pavement engineering application, characterisation of behaviour of pavement materials, and QA/QC in road projects. He lectures both under- and post-graduate classes at the University of Pretoria.

PIETER A MYBURGH graduated from the University of Cape Town in 1965, following which he was employed by the Provincial Government of the Cape Province as engineer in their Roads Department. From 1982 he was Chief Executive Officer ofthe Southern African Bitumen Association (SABITA) until his retirement in 2006. Since then he has acted as specialist consultant in pavement and materials engineering. He is a Fellow of the South African Institution of Civil Engineering, as well as ofthe Society for Asphalt Technology. His other interests include music and wild-life photography.

HAISSAM SEBAALY is a Pavement Expert at ANAS S.p.A. Qatar Branch and a PhD candidate at the University of Pretoria in South Africa. He has an MEng in Civil Engineering from the University of Nevada Reno in the USA. He is a registered Professional Engineerwith Engineering and Consulting Registration (Qatar), Nevada State Board of Professional Engineers and Land Surveyors (USA), and the Order of Engineers and Architecture (Lebanon). In addition, he is a certified Lead Auditor in ISO/IEC 17025:2005 and ISO/IEC 9001:2015. He is currently working on several research projects, such as characterisation of asphalt mixtures, evaluation of pavement performance, recycled asphalt pavement (RAP), crumb rubber modified bitumen, etc. He has several years of experience in laboratory testing, state-of the-art laboratory equipment, pavement design and pavement failure investigations.

