


Serviços Personalizados
Artigo
 Inglês (pdf)
 Artigo em XML
 Referências do artigo
Indicadores

Links relacionados
-
 Citado por Google
 -
 Similares em Google
Compartilhar

 Permalink
Journal of the South African Institution of Civil Engineering
versão On-line ISSN 2309-8775
versão impressa ISSN 1021-2019
J. S. Afr. Inst. Civ. Eng. vol.61 no.2 Midrand Jun. 2019
http://dx.doi.org/10.17159/2309-8775/2019/v61n2a4
TECHNICAL PAPER
Understanding public transport needs in Cape Town's informal settlements: a Best-Worst-Scaling approach
M Teffo; A Earl; M H P Zuidgeest
ABSTRACT
A poor understanding of the needs of people living in informal settlements has often resulted in these needs being assumed and misunderstood due to the lack of proper public consultation or participation. Because of this, South Africa's transport sector, and by extension many other public sectors, faces various challenges. Knowing that public transport is the dominant mode of transport in informal settlements, a better understanding of its challenges as experienced by its commuters is essential for the development of informal settlement upgrading policies. The research in this paper uses Best-Worst-Scaling (BWS) - part of the family of discrete choice models - as a survey and analysis tool for rating and ranking public transport-related challenges of 290 randomly selected commuters from six different informal settlements in Cape Town. The most important features deduced from the public transport experience (PTE) study include (1) Walking Safety, (2) Personal Safety, (3) Unsafe Driving, (4) Overcrowding and (5) Walking Distance. There is no apparent trend in the variance between the choices of men and women. However, there is a significant variance of choices across the respective locations, and - for most attributes - between mode users. This suggests that, with respect to public transport infrastructure upgrading, contextual factors, determined by one's environment, dominate experiences and perceptions, rather than socio-demographic factors.
Keywords: public transport satisfaction, informal settlements, best-worst-scaling, Cape Town
BACKGROUND
South Africa, like many developing countries, is experiencing a rapid population growth, with an increasing demand for travel. Most inhabitants still rely on public transport to gain access to economic, social, educational, medical, recreational and cultural activities. In 2013, 91.4% of people in the lowest income group in the country were reliant on public transport, with 5.7% using trains, 23.6% buses and 62.1% minibus taxis (Statistics SA 2013a). Public transport thus remains an absolute necessity to low-income inhabitants. The public transport system of South Africa, however, is in a bad state, at least in part because "... there has been a very poor post-apartheid government response to the escalating mobility needs of low-income travellers, who constitute the vast majority of South Africa's urban population (Lucas 2011 pg 1320)."
Lucas (2011) gives four key causes for the level of transport poverty we see in South Africa today, namely: (1) low access to private and public transport services, (2) affordability issues connected to over-reliance on minibus taxis, (3) the legacy of apartheid planning on contemporary housing developments and (4) over-reliance on walking. Lucas (2011) furthermore found that, for urban low-income residents, the use of formalised public transport is often not an option due to their location of residence and the times of the day when they require public transport. Because of this, and because of the existence of an extensive, informal, minibus taxi industry, many commuters from low-income areas have become captive users of this form of paratransit. This in a context where Statistics SA (2013b) reports that the lowest income population group spends on average up to 66.6% of their income on transport, with the second and third lowest income groups spending 41.9% and 29.4% respectively, instead of the internationally accepted target of 10%, which is also adopted by South Africa in its 1996 White Paper on Transport Policy (Department of Transport 1996), and which shows the urgency to address the mobility needs of the poor.
South Africa's hopes of finding a solution to these transport problems are placed upon Bus Rapid Transit (BRT) systems, which are currently being rolled out in most major cities in South Africa. Progress has been slow, however, mainly due to conflicts between the developers of the BRT system and the existing minibus taxi industries (Schalekamp & Behrens 2010), and financial challenges associated with the building and operating of full-fledged BRT systems. Because of these and many other reasons, it has been acknowledged that the minibus taxi industry should actually form part of the solution to the transport problems faced by South Africa's urban poor (see Lucas 2011; Del Mistro & Behrens 2015; Ferro & Golub 2012), for example by operating minibus taxis as feeders of the formalised transit trunk routes (Golub et al 2009; Ferro Salazar & Behrens 2015).
Such hybrid systems would require more formalised infrastructure and regulations that also cater for the minibus taxi industry in low-income areas, such as informal settlements. Pertinently, Mahapa and Mashiri (2001) argued that transport policy-makers in South Africa have been preoccupied with technological solutions and efficiency savings rather than focusing on 'local beneficiary' communities, claiming that, with a focus on the latter, transport solutions would have been less expensive and more context- and gender-specific. Furthermore, Potgieter et al (2006, p 35) suggest that there is a "... need for a national qualitative and quantitative study that provides insight and baseline data on how issues of transport are gendered and the consequences on the quality of lives of women." Potgieter et al's argument is especially relevant in view of the statement by Statistics SA (2013c) that, in general, women are more reliant on public transport in South Africa than men. Thus, should the development of transport infrastructure in low-income areas occur, the infrastructure and regulations provided must be context- and gender-specific.
To get a better understanding of the public transport-related experiences and associated needs of the urban poor in South Africa's informal settlements, this paper seeks to apply an innovative survey method and analysis based on principles of choice modelling and stated choice survey design for the collection of such data in the context of informal settlements.
LITERATURE REVIEW
Literature regarding user satisfaction and service quality in public transport describes how consumers evaluate the quality of a public transport service, i.e. public transport service attributes including, but not limited to, safety, availability and travel fares. Furthermore, and of significance to transport authorities, the relative importance of these attributes is typically evaluated (Beirão & Sarsfield Cabral 2007).
User satisfaction and service quality studies come in many forms, either qualitative, quantitative or as a mixed-methods approach (de Ona & de Ona 2014). Qualitative studies have typically taken two forms. In-depth interviews such as those conducted by Beirão and Sarsfield Cabral (2007), or focus group discussions as seen in Guiver (2007). The advantage of such qualitative studies is that they yield nuanced and detailed information regarding the field of study. The more quantitative survey methods in service quality and user satisfaction in public transport typically use Likert scales (Donoso et al 2013), which is an approach used to scale responses comparable with a 3, 5 or 7-point rating scale. See for example Sam et al (2017) for a study on public transport experiences in Ghana, Wong et al (2017) for a study on public transport satisfaction of elderly citizens in Hong Kong, and Efthymiou and Antoniou (2017) for a study on changing public transport satisfaction in Greece during the economic crisis. There are clearly two main approaches by which these studies assess the relative importance of service attributes. The first approach, referred to as an indirect method, uses statistical models of correlation and regression after collecting the respondents' surveys to ascertain the relative importance of service quality or transport attribute information. The second approach, referred to as a direct method, is characterised by finding attribute importance and service quality directly from the interviews or surveys. There is still debate as to whether direct or indirect measures are more effective (Schalekamp & Behrens 2010). While these survey methods are useful due to their ubiquity, the Likert scale is prone to response biases, mainly socially desirable responding, acquiescence and extremity bias (Paulhus 1991). Furthermore, the focus in these studies is largely on identifying important user satisfaction of particular service attributes and not the relative importance of them (Behrens & Schalekamp 2010). In studies that aim for capturing the relative importance of attributes rating scales, researchers mostly use rating scales that do not force respondents to discriminate between items, allowing them to state that multiple items are of similarly high importance of satisfaction/dissatisfaction (Flynn & Marley 2014), whilst in some cases only the preferred item is identified and thus little is understood of the relative ranking of attributes for a given respondent. The Best-Worst-Scaling technique used in this paper to elicit public transport related experiences in Cape Town's informal settlements, is a direct method that overcomes both shortcomings of the commonly used rating scales.
Best-Worst-Scaling (BWS)
BWS is a statistical research tool, a theory for data collection, and a modelling technique for eliciting ranked preferences of respondents. Surveys conducted using the BWS technique allow respondents to indicate their most important attribute and their least important attribute in a set of choices. The BWS technique thus allows the surveyor to get a full ranking of terms, rather than just the most preferred item/s as is common in, for example, stated preference survey design. In addition, BWS can be applied to many more than seven attributes, where many other ranking methods are known to suffer from accuracy and consistency when numbers of attributes increase beyond seven (see for example Bettman et al 1990).
The BWS technique has predominantly been applied in the marketing, health and social sciences fields, and is relatively new to the field of transport planning and engineering, with only a handful known applications dealing with preferences for electric vehicle choice in Germany and Australia (Hinz et al 2015; Beck et al 2016) and for assessing public transport experience in Australia (Beck & Rose 2016).
First proposed in the 1980s by Professor Jordan Louviere, it was initially called the method of maximum difference scaling or MaxDiff. It was introduced to capitalise on a human's tendency to be more reliable and accurate at identifying extreme options, rather than options placed on a graded scale (Louviere et al 2015). BWS provides a theoretical framework within which to measure latent, subjective quantities that produce measurement values that can be presented nominally and compared. The principles underlying the analysis of BWS choice data are similar to those in a discrete choice experiment and are based on random utility theory (RUT).
RUT assumes that people make errors, but when choosing repeatedly, their choice frequencies give an indication of how much they value the items under consideration, i.e. how often item A is picked over item B gives an indication of how much item A is preferred over item B.
The first step in applying the BWS technique is to decide how many attributes will be compared, and then to develop survey designs using that number of attributes. There are three different case types that are used in BWS designs, each for different reasons.
BWS Case Types
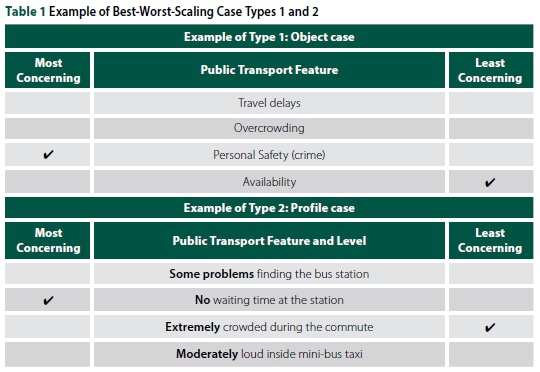
Case 1 analysis, also referred to as the object case, is the simplest and most commonly used of the three BWS design methods. This type of analysis derives the relative values associated with each object in a list of comparable objects (Louviere et al 2015) such as modes of transport. The value scale being used, such as degree of concern or effectiveness, is up to the discretion of the researcher. Thus, category rating scales, such as the aforementioned Likert scale, can easily be substituted within a BWS design (Flynn & Marley 2014).
Case 2 analysis, which is also referred to as the profile case, asks the respondent to choose the attribute within a profile, which is defined as a set of attributes with attribute levels, that is the best and the one that is the worst (Louviere et al 2015). Presenting different profiles with different attribute levels now ensures trade-off between attributes. The difference between Case 1 and Case 2 analyses is illustrated in Table 1.
Finally, a Case 3 analysis is referred to as the multi-profile case, which is a logical extension of the Case 2 type and looks most like a common choice experiment, except that the respondent is asked to choose the worst/least attractive profile and the best/ most attractive profile from a set of three or more profiles (Louviere et al 2015). This case type allows for the estimation of multinomial logit models (Flynn & Marley 2014).
An in-depth review of the different cases and their uses, amongst others the estimation of logit models from BWS outputs, as well as their position in the field of choice modelling and discrete choice experiments, is beyond the scope of this paper. See Hess and Daly (2014) for a review of choice modelling methods. and Louviere et al (2015) for more details on BWS itself.
In this paper we apply a Case 1 BWS design to capture public transport experiences (PTE) of commuters in informal settlements based on a set of defined features (attributes) of the public transport experience, such as overcrowding, travel delays, personal safety and availability. These can be meaningfully compared in an object analysis. A Case 2 or 3 analysis would have been more appropriate when dealing with preferences rather than experiences.
BWS balanced incomplete block designs
Early executions of Case 1 analyses were conducted using so-called 2J designs (Flynn & Marley 2014), so named because for J objects there are 2J best-worst choice sets that are possible. Issues around using this format of choice set design arise only from psychological phenomena, as the size of the choice sets is not constant; for instance, respondents can view choice sets with a small number of objects as the more important ones (Louviere et al 2015). To avoid these problems, Balanced Incomplete Block Designs (BIBD), which stem from combinatorial mathematics, are most commonly used now. A BIBD guarantees that the occurrence and co-occurrence of all objects (or attributes) is constant, therefore reducing the propensity of respondents to make assumptions regarding the relative significance of objects.
A BIBD has the following characteristics (see Table 2):
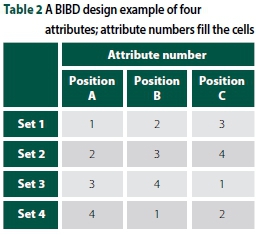
■ Each task contains the same number of items.
■ First order balance or frequency balance: each item occurs the same number of times across tasks.
■ Second order balance or orthogonality: each item appears equally often with every other item.
■ Positional balance: each item should appear an equal number of times in the first, second, third and κ-th positions within the sets to avoid order-bias.
■ Connectivity: each item should be directly/indirectly compared to every other item in the study to allow for all the items to be compared on a common scale (Peitz & Mcewan 2016).
Practice with BWS designs revealed that four to six items per choice is optimal for most respondents and most tasks. If the item labels are long, such as positioning statements, then fewer than six items should be used. Respondents can typically undertake up to 20 choice sets, though anecdotal evidence suggests that boredom sets in after about 10 to 12 choice sets (Chrzan & Peitz 2015).
RESEARCH DESIGN
For this study attributes related to a commuter's public transport experience within the context of Cape Town's informal settlements were used to design the choice sets of the survey. The attributes were formulated through a literature review (including Beirão & Sarsfield Cabral 2007; Behrens & Del Mistro 2010; Donoso et al 2013; Lucas 2011; de una & de una 2014; and Transport for Cape Town 2013), field reconnaissance visits and semi-structured interviews with township dwellers, and a pilot survey. Formal surveys were conducted after the pilot survey to obtain the BWS data. The choice data was accordingly statistically analysed to develop the most concerning and least concerning choice clusters. The most concerning and least concerning public transport experience attributes were then used to draw relationships across the boundaries of locations and gender.
Pilot survey
The preliminary design of the BWS attributes was developed based on the literature review, including priorities highlighted in the City of Cape Town's comprehensive integrated transport plan (Transport for Cape Town 2013), semi-structured interviews with community organisations, and discussions with 32 randomly selected respondents from the University of Cape Town (UCT) and the Thandokhulu High School in Rondebosch, who presently live in informal settlements, or in areas that have historically been on the urban periphery of Cape Town. The respondents were asked to describe (in their own words) some of the challenges they experience when accessing and using public transport. The respondents were also asked to comment on transport infrastructure elements that they feel are lacking. A draft final attribute list was then established.
In a pilot survey a provisional Case 1 BWS design was tested to see whether the chosen attributes were understandable to the respondents. This pilot survey was again conducted with randomly selected students and staff at UCT and Thandokhulu High School. At each of these locations, a total of five respondents were asked to complete the BWS questionnaire. It was observed, in this case, that some respondents became agitated by the repetition of attributes in the different choice sets. Respondents would very seldom ask that a certain attribute be explained to them, as they were confident in their understanding of the attribute. However, most respondents responded well when the BWS method was explained. In some cases, respondents preferred that the questionnaire should be filled out for them while they provided the relevant answers. This procedure seemed to be more effective, as the inferences from the respondents' own interpretation of the study were reduced, making the responses more consistent. Lessons learned from the pilot survey were incorporated in the final BWS questionnaire design and survey approach.
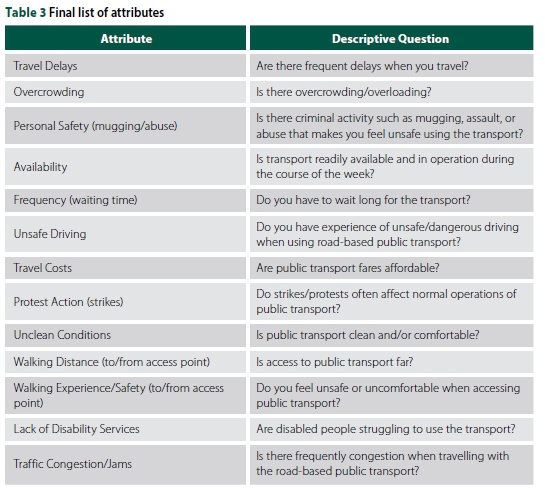
Table 3 shows the final attribute list for the study, which comprises questions around public transport use as well as access conditions. Most attributes are self-explaining. Walking Safety for example refers to how safe a respondent feels when walking to the public transport stop, whilst Personal Safety refers to how safe a person feels whilst using the mode of public transport. All terms were, however, explained to each respondent prior to the completion of the survey.
BWS survey design
In the BWS survey, participants choose their 'most concerning' and 'least concerning' feature related to the use of and access to public transport. The features presented were negative challenges related to the use of the various public transport modes used by participants and made up the BWS list of attributes. In choosing a feature as 'most concerning', the participant acknowledged that the challenge in question was significantly troubling or unsettling. Conversely, in choosing a feature as 'least concerning', the participant acknowledged that the challenge experienced was insignificantly troubling or insignificantly unsettling relative to the other attributes.
BWS choice set generation and design
Sawtooth Software Inc (SSI) implements a BIBD BWS survey design and was used to develop the BWS choice sets. The following additional considerations compared to the five listed before were considered when determining the choice sets:
■ A maximum of four items per choice set to avoid choice task fatigue
■ Each item appears at least three times per survey, following a recommendation by Peitz and Mcewan (2016).
Equation 1 was used to determine the number of choice sets (tasks) for the BWS design:

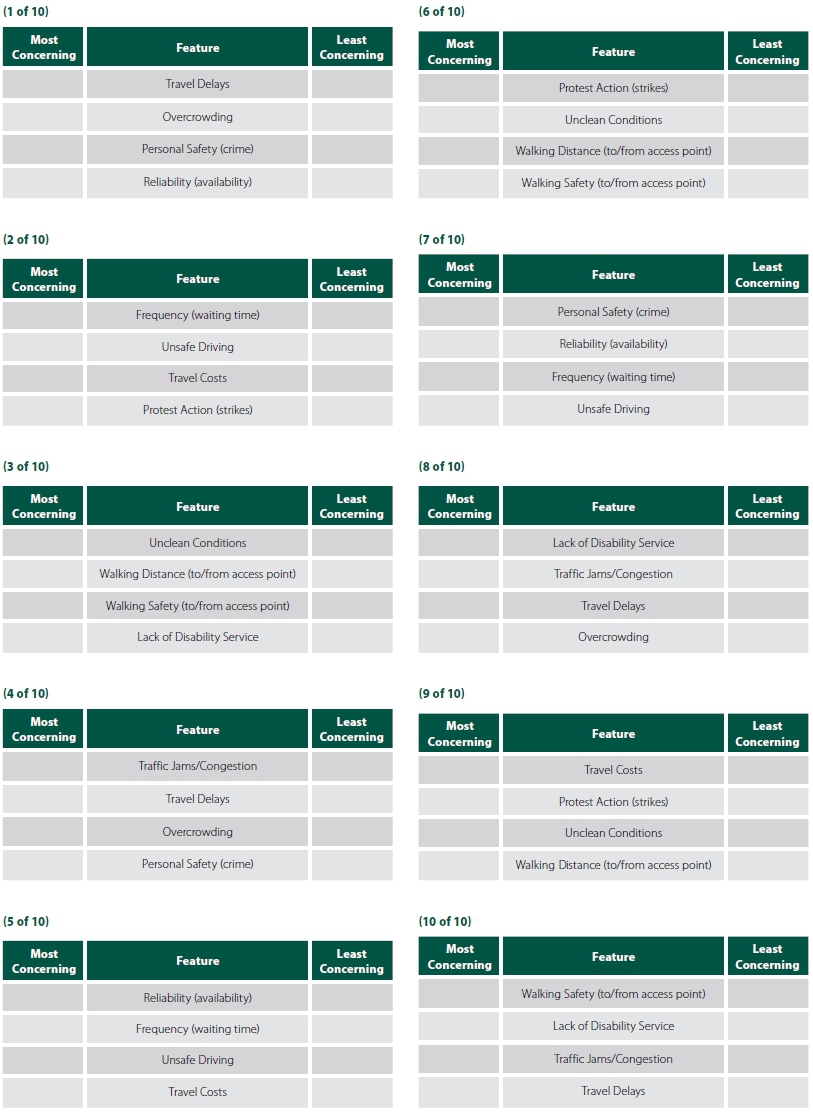
With a task size of four items (size) per choice set, 13 items (items) in total, and a minimum repetition of three times per survey, a minimum of 10 choice sets (tasks) had to be generated, all in accordance with the BIBD principles. The final design is depicted in Appendix A on page 50.
BWS analysis
XLSTAT software was then used to analyse the BWS data. So-called raw scores were calculated by subtracting the number of times an item has been chosen as the worst (least concerning) choice from the number of times the same item has been chosen as the best (most concerning) choice. Equation 2 shows how the raw scores are obtained:
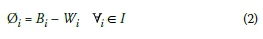
where 0i· is the raw score (per item i), B is the number of times an item is chosen as best (most important/concerning), and W is the number of times an item i is chosen as worst (least important/concerning). The set of items is depicted as I.
The raw scores are then converted to average B-W scores 0avj by dividing the raw score of an item by the number of respondents R and the number of times each item appeared in the choice sets, r:
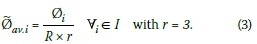
The conversion of the raw scores to 0 avj helps to simplify the interpretation of the results on an interval scale [+1.0 ... -1.0]. The items chosen as best (most concerning) more than they have been chosen as worst (least concerning) will have a value 0av.i > 0. Conversely, the items chosen as worst (least concerning) more than they have been chosen as best (most concerning) will have a value 0avi < 0.
An item with a score of 1.0 is higher (more important) than an item with a score of 0.5, for example. But, when interpreting these scores, it cannot be said that the item with a score of 1.0 is twice as preferred as an item with a score of 0.5. To do that, the raw scores 0avi first have to be transformed to a positive probability scale that supports ratio operations, which is discussed next. In literature, the 0avi scores are also referred to as utility scores.
There are a number of ways to transform scores from a discrete choice experiment (such as this BWS study) into comparable utility scores - see Green et al (2001). Of the different methods in BWS surveys, the one mostly used is the Hierarchical Bayes method. The Hierarchical Bayes method is a hierarchical model using Bayesian statistics to create individual utilities for each respondent. A description of the method is beyond the scope of this paper, but the reader is referred to Howell (2009) or Gustafsson et al (2003) for a review of Hierarchical Bayes applied in choice modelling. Both SSI and XLSTAT have implemented Hierarchical Bayes routines to get the utility scores 0avi-.
Survey
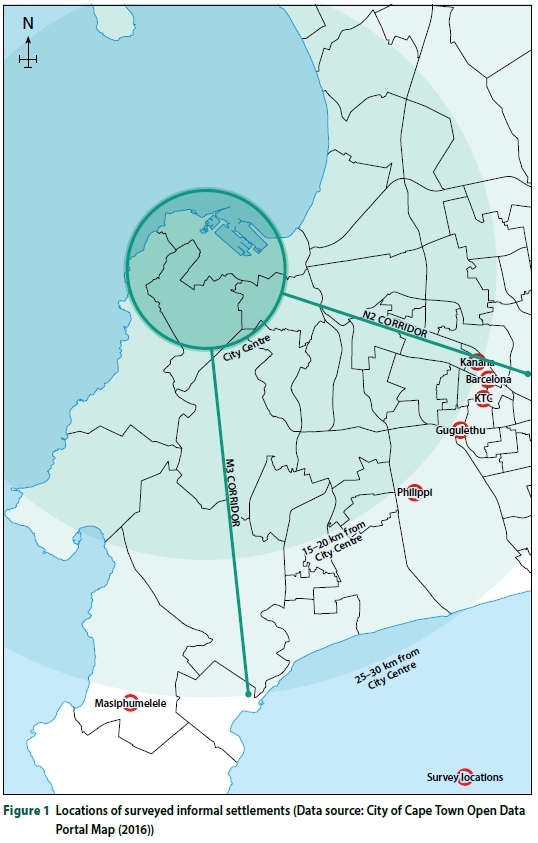
The actual survey was conducted in six informal settlements situated in the Southern Peninsula, Cape Flats and Mitchells Plain districts of Cape Town. All six settlements were chosen based on their proximity to township areas with developed public transport infrastructure, including taxi ranks, bus terminals and train stations, as well as their closeness to high-volume transport corridors connecting the city centre. Five informal
settlements are situated along the N2 freeway corridor and the Metrorail central line, both carrying high volumes of public transport commuters to and from the urban business centres. The other informal settlement is situated in the Southern Peninsula along another high-volume corridor (the M3, Main Road and the Metrorail Southern Suburbs line). The informal settlements sampled were (1) Gugulethu, (2) Kanana, (3) Barcelona, (4) KTC and (5) Philippi in the Cape Flats and Mitchells Plain area, and (6) Masiphumelele in the Southern Peninsula. Figure 1 indicates the locations of the six informal settlements relative to the high-volume corridors.
Ethics approval was obtained from the University of Cape Town. The objective was to obtain a minimum of 50 participants from each settlement. In total 334 participants across the six settlements were finally recruited. Initial questions included age, location of residence, occupation and regular mode of transport they use. Eventually, 44 of the questionnaires were omitted, due to crucial missing information or because respondents were not living in the area, leaving 2 900 (290 χ 10 choice sets) useable responses for the BWS analysis. The selection of respondents across the locations was done using a gender-stratified sampling during weekdays, targeting a 50/50% split between men and women. There were always three to five trained surveyors in each area. The surveyors would split into opposite directions to conduct door-to-door surveys, interviewing one individual who was at least 18 years of age per household. Surveyors would systematically approach every third dwelling in a street or the following house in case of no response or when none of the qualifying household members were willing to participate. In some informal settlements, particularly in Masiphumelele, the main roads were replete with pedestrian thoroughfare. Surveyors would take advantage of this by conducting the interviews along the length of the road, approaching pedestrians (of 18 years and older) in each stratum (male/ female), in addition to the systematic sampled door-to-door surveys, until meeting their quota. We are confident that this way the sample is representative enough to infer lessons about public transport needs of informal settlement dwellers.
RESULTS
Sample statistics
In total, 51% of the 290 respondents were female, close to the target strata of 50%. This suggests that the overall result will not have a gender bias. There was a larger disparity in the percentage respondents with respect to age groups. Most participants were young (aged 18-34) and made up 65% of the total respondents (~28% of the South African population is in this age group (Statistics SA 2013d)). The middle-agers (35-54) made up 32% (against ~22% in South Africa (Statistics SA 2013d)) of the total respondents, followed by the senior citizens at 3% (against ~12% of the South African population (Statistics SA 2013d)). Only in three of the six informal settlements senior citizens (age > 55 years) participated. The analysis may therefore have a bias towards the youth.
Most of the respondents in the sample are from the Kanana informal settlement making up 19% of the participants. This is followed by Philippi, Barcelona and KTC with 17% of the participants coming from each of these areas. Gugulethu and Masiphumelele make up 16% and 14% of the participants respectively. The proportion of the participants, with respect to location, is thus relatively balanced.
In total, 46% of the total respondents are taxi users. This is followed by bus and train users at 30% and 24% respectively, while less than 1% of respondents are MyCiti (BRT) users. This data is consistent with 'Cape Town's Transport Picture 2015', which revealed that transport users of minibus taxis, buses and trains make up 44%, 33% and 23% of these forms of public transport respectively (Transport for Cape Town 2013). Furthermore, 58% of bus users are male and 56% of taxi users are female.
Area-based public transport experience
The following results are derived from the 2 900 responses from the 290 qualifying surveys. Figure 2 gives the overall average B-W scores, 0avi, following Equation 3.
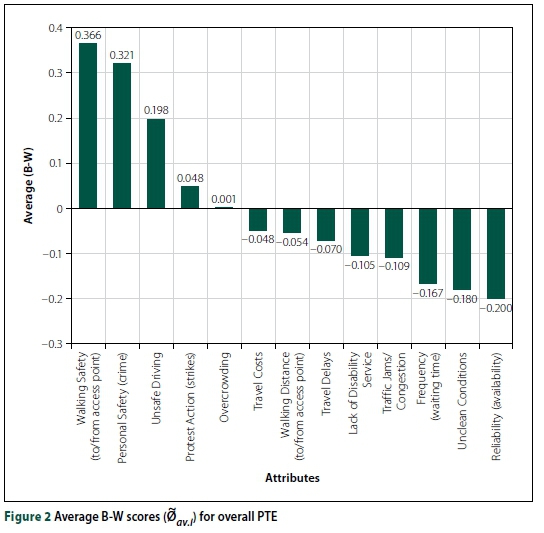
Walking Safety has the highest average B-W score, while Availability comes out with the lowest average B-W score.
The results of the top five most concerning utility scores (0avi) are shown for each of the choice clusters in Figure 3, and can be compared ordinally between areas. The most concerning clusters are summarised in 'percentage stacked column' graphs to compare, on a scale of one to 100%, i.e. the performance of these attributes in the various locations/study areas. Figure 3 identifies that Walking Safety, Personal Safety, Unsafe Driving, Overcrowding and Walking Distance are the top five most concerning features in the various areas. Walking Safety is the most concerning attribute, with an average utility score of 14.7%. This means that, overall, Walking Safety is seen as almost twice as important as Walking Distance. Walking Safety, Personal Safety and Unsafe Driving are most concerning in Barcelona, scoring 19.9%, 19.3% and 18.3% respectively. Overcrowding is most concerning in Philippi with a utility score of 12.3%. Finally, Walking Distance is most concerning in KTC, which scored 12.0%.
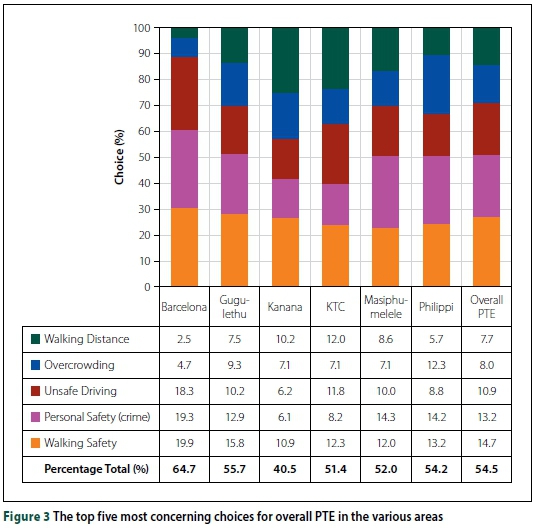
Summing these top five features in the overall study generates a score of 54.5%, meaning that the other eight features contribute 45.5% to the total importance, illustrating their relative insignificance. Figure 3 also shows that these five features are of greater concern in Barcelona where they scored an overall BWS mean value of 64.7%, whereas in Kanana these features scored 40.5% cumulatively. Overall, the least concerning features include Availability and Frequency which scored 3.3% and 4.3% respectively, in line with the results in Figure 2.
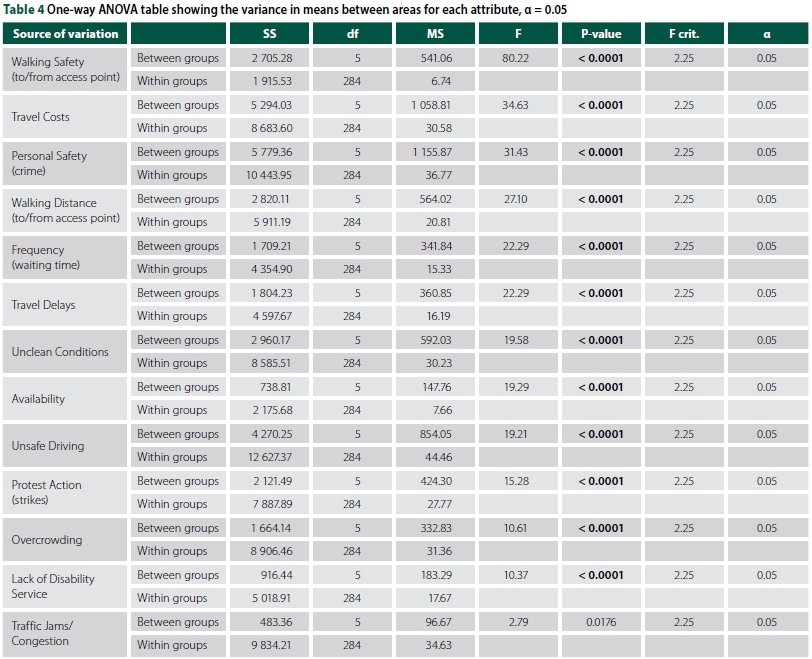
Next, a one-way ANOVA test was conducted to test the variance of means for each of the attributes between the six informal settlements. First, Table 4 shows that for all the attributes, the p-values are much lower than the significance level, α = 0.05, with the smallest difference being in Traffic Jams/Congestion, which has a p-value of 0.018. The null hypothesis (that there is no difference between means) is thus rejected in all cases, i.e. there are significant differences in the perceptions of importance of PTE attributes between the six informal settlements
Figure 4 shows the top five most concerning features between users of different modes across the locations. For bus users Walking Safety comes out as the most concerning attribute, with a scoring of 16% on average, while Unsafe Driving was the most concerning attribute for taxi drivers, scoring 14.6%. For train users Personal Safety was most concerning with a score of 13.9%. Walking Safety was the second most concerning attribute for both taxi and train users, scoring 13.6% and 13.2% respectively. For bus users this is Unsafe Driving.
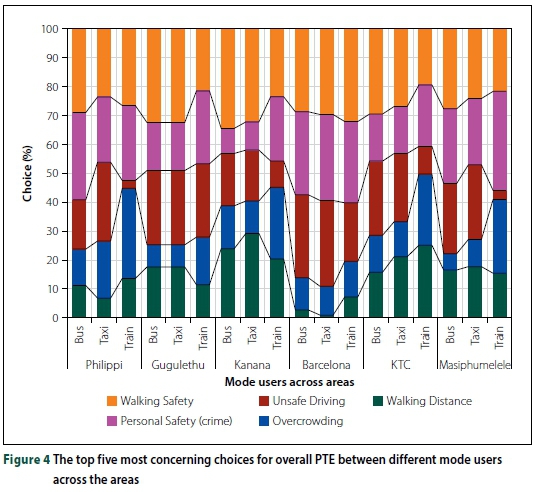
Further statistical tests (not shown here) revealed that, in general, between the different modes, for each attribute, the p-values are lower than the significance level, α = 0.05. The null hypothesis (that there is no difference between means) is thus rejected in most cases, i.e. there are significant differences in the perceptions of importance of PTE attributes between the different modes. However, perceptions around Personal Safety, Travel Costs, Unclean Conditions and Walking Distance are found to be similar between taxi and train users. Similarly, train and bus users feel similarly about Lack of Disability Service, Overcrowding, Personal Safety, Unclean Conditions and Walking Distance. Finally, taxi and bus users are equally concerned about Personal Safety, Unclean Conditions and Unsafe Driving.
Gender-based public transport experience
Figure 5 gives the overall average B-W scores for the 290 respondents, arranged such that the scores of men and women can be compared. For women, personal safety has the highest average B-W score, while availability has the lowest average B-W score. For men, Walking Safety has the highest average B-W score, while Unclean Conditions has the lowest average B-W score.
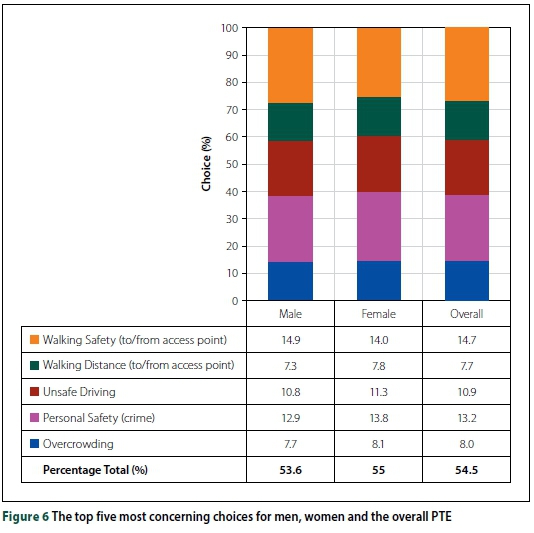
Figure 6 shows the top five choice clusters for men, women and overall. The most concerning features are Walking Safety, Personal Safety, Unsafe Driving, Overcrowding and Walking Distance, with Walking Safety being the most concerning attribute for both men and women. Walking Safety is more concerning for men (14.9%) than women (14.0%), while Personal Safety on public transport is more important for women (13.8%) than men (12.9%).
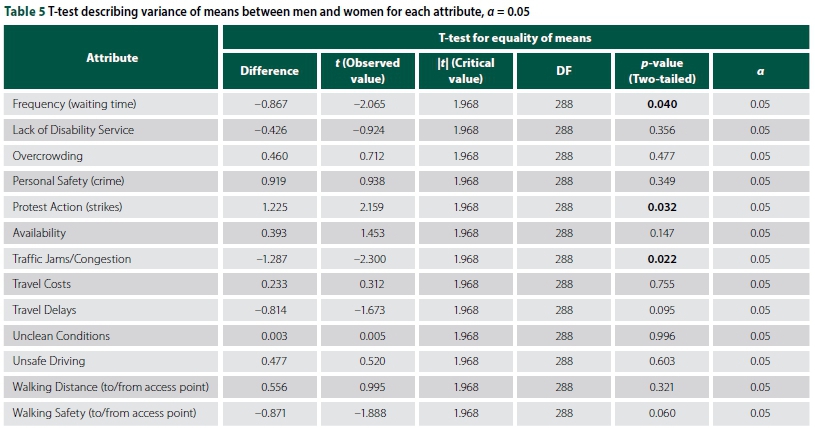
Finally, Table 5 shows the results of the two-sample 7-test comparing the means of all attributes between men and women. The null hypothesis was set as there being no difference between the means. Overall there was little variance in the means of choices between men and women. The only significant variances found, where the _p-value is less than the significance level α = 0.05, were in the means of Frequency (waiting time), Protest Action (strikes) and Traffic Jams (congestion). These attributes are all relatively unimportant, as none of them are of the top five most important attributes. Hence it can be said that there is no significant difference in the perception of importance of PTE attributes between men and women in the surveyed informal settlements.
DISCUSSION
From the results we can surmise that Walking Safety, Personal Safety, Unsafe Driving, Overcrowding and Walking Distance are the most concerning features for the overall PTE. These features make up the most concerning choice cluster with a cumulative BWS mean value of 55%. Walking Safety to access public transport is consistently the most concerning in all the locations, with scores ranging from 12% (Masiphumelele) to 20% (Barcelona). The least concerning features across all locations have been identified as Availability and Frequency. It is assumed that, because of the multiplicity of minibus taxis, travellers assume a readily available minibus taxi, and thus availability is seen as least concerning, despite the service quality and delivery levels.
All the attributes seem to have significant variance across the different locations. Personal Safety for example ranges from 6% (Kanana) to 19% (Barcelona), while Unsafe Driving ranges from 6% (Kanana) to 18% (Barcelona), Overcrowding ranges from 5% (Barcelona) to 12% (Philippi), and finally Walking Distance ranges from 3% (Barcelona) to 12% (KTC).
The differences between mode users are less pronounced, with some attributes differing significantly between the modes, such as frequency and travel delays, and some attributes being of concern to all mode users, such as personal safety and unclean conditions.
Combining these findings there are obviously differences between mode users in the different areas, for example Walking Safety for minibus taxi users ranges from 11.9% in KTC to 3.9% in Philippi. For train users Travel Delays range between 12% in Masiphumelele to 4.1% in Barcelona. Nevertheless, for certain attributes, regardless of area and mode, there will be similarities in perception. Analysis shows that the context of actual realities on the ground is a driving factor in people's perception of public transport experience. It is thus important to make site-specific considerations when designing any public transport infrastructure in informal settlements.
As illustrated in Figure 5 and 6, Walking Safety, Personal Safety, Unsafe Driving and Overcrowding have all been regarded as most concerning in the same order of importance by both women and men. Attributes pertaining to safety (Walking Safety and Personal Safety) are the two most concerning for men and women and make up 27.8% of the overall importance. For comparison's sake, a combination of the next two most concerning features, Unsafe Driving and Overcrowding, makes up only 19%.
The only distinct difference in choices between men and women concerns Frequency (waiting time), Protest Action (strikes) and Traffic Jams (congestion). Men considered congestion slightly more concerning than women did, with the former having a score of 7.3% and women having a score of 6%. Women viewed Protest Action more important than men did, with the former having a score of 7.8% and men having a score of 6.5%. This can be explained by the known gender differences between men and women when it comes to risk perception and risk taking (for a meta-study on this see Byrnes et al (1999)). Finally, men found Frequency more important than women, with the latter having a score of 4% and the former having a score of 4.8%.
CONCLUSIONS AND RECOMMENDATIONS
This paper implemented the BWS technique using Case 1 type of analysis and a BIBD survey design to obtain meaningfully comparable data regarding public transport priority needs of people living in informal settlements around Cape Town. The attributes used were based on literature, conversations in the community and with students of the University of Cape Town and Thandokhulu High School in Cape Town. Interviews were conducted with 334 participants in total across six informal settlements in Cape Town. The data of the interviews was analysed using the Hierarchical Bayes clustering routine provided by XLSTAT to make useful comparisons of the most important attributes ascertained by the BWS survey. An ANOVA table was then generated to ascertain whether there was significant variance in the means of the results generated for each attribute between each area. Statistical tests were conducted to assess whether there are significant differences in perceptions of attribute importance between men and women.
The study found that Walking Safety, Personal Safety, Unsafe Driving, Overcrowding and Walking Distance are, overall, the most concerning features for public transport users in the informal settlements surveyed. The least concerning features across all locations have been identified as Availability and Frequency. In addition, there is no apparent trend in the variance between the choices of men and women. Yet, there is significant variance across the different locations, and generally there is significant variance between mode users.
Walking Safety is considerably and consistently important across all the locations and genders. Personal Safety during the use of public transport is of high importance for both genders, and across all locations. Walking Safety and Personal Safety are highly important, but relate to two different settings. Walking Safety relates to a respondent's environment when accessing the public transport, and Personal Safety relates to a respondent's environment whilst using the public transport. Their high importance reflects daily anxieties that plague both men and women in the informal settlements surveyed, posing the question: are both the public transport user's walking safety to and from the infrastructure and the user's safety on board the public transport the responsibility of the transport authority? Thus, a complementary study would be one that investigates the pedestrian experience of a traveller's commute with regard to his/her safety.
With Availability and Frequency of public transport having a low perceived importance, while Unsafe Driving and Overcrowding have a much higher perceived importance, it seems that travellers are easily able to find a means of transport, but are unhappy with the quality of service being provided. Pertinent to the argument of Mahapa and Mashiri (2001), it is clear from the results that all informal settlements are unique, as there are significant differences in the results obtained from different areas. Infrastructure interventions must thus be case-sensitive to be effective.
From a methodological perspective, this paper demonstrates the ability of the BWS technique to yield clear and accessible data regarding public transport priorities for people living in informal settlements. This research has room for expansion, however, as a larger sample size would generate data that is perhaps more statistically representative. The research could also be spatially compressed, as it could be useful to generate a larger sample size from just three informal settlements to allow for more effective comparisons regarding which attributes are more important and why. Alternatively, a survey could be implemented that targets specific age groups to facilitate design that cater for the most vulnerable in terms of age. The attributes used for this study might not include all features that are important for public transport users - further studies could be done to nominally understand the transport needs of the urban poor, before assessing them in terms of priority. Furthermore, a complementary survey could focus on the pedestrian experiences of public transport users in informal settlements. A final recommendation is to implement further analysis regarding variance in modal choice in the six informal settlements.
This study proves that the BWS technique can be an effective tool for rating and ranking preferences in the civil engineering domain and provides an opportunity for more studies of this nature to be conducted. The research has also shown that the BWS method can be an effective way to engage with communities to understand their prioritised areas of needs and to identify specific areas of concern.
REFERENCES
Beck, M J & Rose, J M 2016. The best of times and the worst of times: A new best-worst measure of attitudes toward public transport experiences. Transportation Research Part A - Policy and Practice, 86: 108-123. [ Links ]
Beck, M J, Rose, J M & Greaves, S P 2016. I can't believe your attitude: A joint estimation of best worst attitudes and electric vehicle choice. Transportation, 44(4): 753-772. [ Links ]
Behrens, R & Del Mistro, R 2010. Shocking habits: Methodological issues in analyzing changing personal travel behavior over time. International Journal of Sustainable Transportation, 4(5): 253-271. [ Links ]
Behrens, R & Schalekamp, H 2010. Public transport mode satisfaction in Cape Town: Findings of a passenger intercept survey. Proceedings, 29th Southern African Transport Conference, 18-19 August, Pretoria, pp 733-748. [ Links ]
Beirão, G & Sarsfield Cabral, J A 2007. Understanding attitudes towards public transport and private car: A qualitative study. Transport Policy, 14(6): 478-489. [ Links ]
Bettman, J R, Johnson, E J & Payne, J W 1990. A componential analysis of cognitive effort in choice. Organizational Behavior and Human Decision Processes, 45(1): 111-139. [ Links ]
Byrnes, J P, Miller, D C & Schafer, W D 1999. Gender differences in risk taking: A meta-analysis. Psychological Bulletin, 125(3): 367-383. [ Links ]
Chrzan, K & Peitz, M 2015. Advanced MaxDiff Topics. Sawtooth Software Webinar. Available at: https://www.sawtoothsoftware.com/.../webinars/1606-webinar-advanced-maxdiff-topics. [ Links ]
Del Mistro, R & Behrens, R 2015. Integrating the informal with the formal: An estimation of the impacts of a shift from paratransit line-haul to feeder service provision in Cape Town. Case Studies on Transport Policy, 3(2): 271-277. [ Links ]
de Ona, J & de Ona, R 2014. Quality of service in public transport based on customer satisfaction surveys: A review and assessment of methodological approaches. Transportation Science, 49(3): 605-622. [ Links ]
Department of Transport (South Africa) 1996. National Transport Policy White Paper. Available at: http://www.gov.za/documents/National-transport-policy-white-paper. [ Links ]
Donoso, P, Munizaga, M & Rivera, J 2013. Measuring user satisfaction in transport services: methodology and application. In: Zmud, J. (Ed.), UK, Transport Survey Methods: Best Practice for Decision Making, Bingley, UK: Emerald Group, 603-623. [ Links ]
Efthymiou, D & Antoniou, C 2017. Understanding the effects of economic crisis on public transport users' satisfaction and demand. Transport Policy, 53: 89-97. [ Links ]
Ferro, P S & Golub, R B A 2012. Planned and paratransit service integration through trunk and feeder arrangements: An international review. Proceedings, 31st Southern African Transport Conference, 8-11 July, Pretoria, pp 604-618. [ Links ]
Ferro Salazar, P & Behrens, R 2015. From direct to trunk-and-feeder public transport services in the urban south: Territorial implications. Journal of Transport and Land Use, 8(1): 123-136. [ Links ]
Flynn, T N & Marley, A A J 2014. Best worst scaling: Theory and methods. In Hess, S (Ed.), Handbook of Choice Modelling, 178-199. Available at: https://www.unisa.edu.au/Global/business/centres/i4c/docs/papers/wp12-002.pdf[accessed on 4 May 2017]. [ Links ]
Golub, A, Balassiano, R, Araújo, A & Ferreira, E 2009. Regulation of the informal transport sector in Rio de Janeiro, Brazil: Welfare impacts and policy analysis. Transportation, 36(5): 601-616. [ Links ]
Green, P E, Krieger, A M & Wind, Y 2001. Thirty years of conjoint analysis: Reflections and prospects. Interfaces, 31(3): 56-73. [ Links ]
Guiver, J W 2007. Modal talk: Discourse analysis of how people talk about bus and car travel. Transportation Research Part A: Policy and Practice, 41(3): 233-248. [ Links ]
Gustafsson, A, Herrmann, A & Huber, F (Eds.) 2003. Conjoint Measurement : Methods and Applications. Dordrecht, Germany: Springer. Available at: https://books.google.co.za/books?id=meQFCAAAQBAJ&dq=hierarchical+bayes+conjoint+analysis&lr=&source=gbs_navlinks_s[accessed on 8 May 2017]. [ Links ]
Hess, S & Daly, A J 2014. Handbook of Choice Modelling, 1st ed. Cheltenham, UK: Edward Elgar. Available at: http://www.e-elgar.com/shop/eep/preview/book/isbn/9781781003152[accessed on 4 May 2017]. [ Links ]
Hinz, O, Schlereth, C & Zhou, W 2015. Fostering the adoption of electric vehicles by providing complementary mobility services: A two-step approach using best-worst scaling and dual response. Journal of Business Economics, 85(8): 921-951. [ Links ]
Howell, J R 2009. CBC/HB for Beginners. Sawtooth Software-Research Paper Series, 98382(360): 1-6. [ Links ]
Louviere, J J, Flynn, T N & Marley, A A J 2015. Best-Worst Scaling: Methods and Applications. Cambridge, UK: Cambridge University Press. [ Links ]
Lucas, K 2011. Making the connections between transport disadvantage and the social exclusion of low income populations in the Tshwane Region of South Africa. Journal of Transport Geography, 19(6): 1320-1334. [ Links ]
Mahapa, S M & Mashiri, M 2001. Social exclusion and rural transport: Gender aspects of a road improvement project in Tshitwe, Northern Province. Development Southern Africa, 18(3): 365-376. [ Links ]
Paulhus, D L 1991. Measurement and control of response bias. In Robinson, J P, Shaver, P R, Wrightsman, L S & Andrews, F M (Eds), Measures of Personality and Social Psychological Attitudes, San Diego, CA, 17-59. [ Links ]
Peitz, M & Mcewan, B 2016. An Introduction to Max Diff. Sawtooth Software Webinar. Available at: https://www.sawtoothsoftware.com/.../webinars. [ Links ]
Potgieter, C-A, Pillay, R & Rama, S 2006. Women, Development and Transport in Rural Eastern Cape, South Africa. Cape Town: Human Sciences Research Council. Available at: http://uloitopob.ru/hityq.pdf. [ Links ]
Sam, E F, Hamidu, O & Daniels, S 2017. SERVQUAL analysis of public bus transport services in Kumasi metropolis, Ghana: Core user perspectives. Case Studies on Transport Policy, 6(1): 25-31. [ Links ]
Schalekamp, H & Behrens, R 2010. Engaging paratransit on public transport reform initiatives in South Africa: A critique of policy and an investigation of appropriate engagement approaches. Research in Transportation Economics, 29(1): 371-378. [ Links ]
Statistics SA 2013a. National Household Travel Survey February to March 2013. Pretoria: Statistics South Africa, 1-179. [ Links ]
Statistics SA 2013b. Measuring household expenditure on public transport: In-depth analysis of the National Household Travel Survey 2013 data. Pretoria: Statistics South Africa. [ Links ]
Statistics SA 2013c. Gender Series Volume III: Gender patterns in transport. Pretoria, Statistics South Africa. [ Links ]
Statistics SA 2013d. Population Census 2011. Pretoria: Statistics South Africa. Available at: http://www.statssa.gov.za. [ Links ]
Transport for Cape Town 2013. Comprehensive Integrated Transport Plan 2013-2018. p 407. Available at: http://www.tct.gov.za/docs/categories/1258/CTIP2013-2018 (20131112)1.pdf. [ Links ]
Wong, R C P, Szeto, W Y, Yang, L & Li, YC 2017. Elderly users' level of satisfaction with public transport services in a high-density and transit-oriented city. Journal of Transport & Health, 7(B): 209-217. [ Links ]
 Correspondence:
M Teffo
Transnet Group Capital
9 Country Estate Drive
Waterval 5-lr
Midrand 1662
South Africa
T: +27 11 308 1283
E: moneri.teffo@transnet.net
A Earl
Imperial College London
United Kingdom Flat 7
Exford Court Bolingbroke Walk
SW11 3NJ, London
United Kingdom T: +44 77 8012 6131
E: andrew.earl@network.rca.ac.uk / a.earl17@imperial.ac.uk
M H P Zuidgeest
Centre for Transport Studies
Department of Civil Engineering
University of Cape Town
Private Bag X3
Rondebosch 7701
South Africa
T: +27 21 650 4756
E: mark.zuidgeest@uct.ac.za

MONERI TEFFO is an engineer at the Transnet Group Capital (Transnet SOC Ltd) Civils and Perway Design Office, Johannesburg. He graduated with a BSc (Hons) (Civil Engineering) from the University of Cape Town in 2016, and has an interest in Transportation Engineering and Planning, particularly the interaction thereof with the socio-economic indices of urban areas.

ANDREW EARL is currently pursuing a double Master's (Ma and MSc) in Innovation Design Engineering between the Royal College of Art and Imperial College London. Prior to undertaking his Master's, he graduated (BSc (Hons)) from the University of Cape Town Civil Engineering Department in 2016. He maintains a keen interest in urban issues, particularly those around transport in the South African context. During his time in the United Kingdom he is learning new approaches to problem solving in a variety of contexts and aims to bring this knowledge home after graduating.

PROF MARK H P ZUIDGEEST is a member of SAICE, and is the SANRAL Chair of Transportation Planning and Engineering at the University of Cape Town. He graduated with an MSc (Civil Engineering) from the University of Twente, The Netherlands, in 1997, and a PhD from the Netherlands Research School for Transport, Infrastructure and Logistics (TRAIL) in 2005. His fields of interest include land use - transport systems analysis, with an emphasis on questions around sustainability, equity and accessibility.
APPENDIX A
Which of the following public transport mode features most concerns you and which concerns you the least?

