


Serviços Personalizados
Artigo
 Inglês (pdf)
 Artigo em XML
 Referências do artigo
Indicadores

Links relacionados
-
 Citado por Google
 -
 Similares em Google
Compartilhar

 Permalink
Journal of the South African Institution of Civil Engineering
versão On-line ISSN 2309-8775
versão impressa ISSN 1021-2019
J. S. Afr. Inst. Civ. Eng. vol.61 no.2 Midrand Jun. 2019
http://dx.doi.org/10.17159/2309-8775/2019/v61n2a3
TECHNICAL PAPER
Artificial aeration of stepped spillways by crest piers and flares for the mitigation of cavitation damage
J Koen; D E Bosman; G R Basson
ABSTRACT
Stepped spillways are one of the oldest spillway designs dating back to 500 B.C. With technical advances in Roller Compacted Concrete (RCC) construction, the stepped spillway has become increasingly popular over recent decades. However, the use of this spillway is limited to a maximum safe unit discharge of 25 m2/s due to the risk of cavitation.
In order to increase the discharge capacity on stepped spillways, various crest pier designs were introduced for flow aeration, thereby reducing the risk of cavitation damage. These pier designs were investigated on two physical models, constructed on a scale of 1:15 and 1:50, both with a standard ogee crest profile which transit to a stepped spillway chute. Air concentration was recorded along the pseudo-bottom, while pressures were measured at the step riser. The results of the 1:15 scale model indicated that the implementation of a short bullnose pier increased the safe unit discharge capacity to 30 rm/s. The innovative Flaring Gate Pier design, which was adapted on existing spillways in China, with reported design prototype unit discharges exceeding 200 m2/s, was investigated on the 1:50 scale model. Based on the experimental results of the current study, the safe unit discharge capacity (i.e. a discharge satisfying the relevant criteria defined for this study) was increased to 50 m2/s with an X-shape Flare Gate Pier (FGP) on the spillway crest.
Keywords: stepped spillway, cavitation, aeration, flaring gate pier, crest pier
INTRODUCTION
A study by Nortjé (2002) attributed the main cause of dam failures to insufficient spillway capacity, which is responsible for 39% of the total dam failures in South Africa. This emphasises the need and importance for further studies of the hydraulic related characteristics of spillways in general. Typical modes of dam failure include foundation failures, flow erosion and concrete deterioration of spillways. The study of cavitation on stepped spillways, which could lead to damage of the concrete surface, is the subject of this investigation.
As excessive amounts of water discharge over the spillway crest and accelerate down the spillway face, high velocities are induced. These high velocities generate low pressure regions in which cavitation may be imminent, and which can cause major damage to the spillway or even endanger the dam's structural integrity. A pre-emptive measure to combat cavitation damage is to artificially introduce flow aeration at the pseudo-bottom. In order to aerate the flow, various crest pier aeration structures were investigated to ultimately increase the maximum safe unit discharge capacity of stepped spillways.
Flow aeration is defined as the entrapment of air bubbles and pockets that are transported within the flow. Natural air entrainment or self-aeration arises due to the growth of a turbulent boundary layer. As the turbulent boundary layer grows, a point is reached where the boundary layer breaches the free surface. If the turbulence overcomes the surface tension, air is entrained into the flow (Pfister & Hager 2011).
This study investigated the artificial aeration of piers and flares on two types of stepped spillway models, referred to as Type A and B:
A. A standard USBR (1987) spillway with a design discharge head of 4.2 m, step height of 1.5 m, chute slope of 51.3° and transitional crest steps
B. A standard WES (1959) spillway with a design discharge head of 17.9 m, step height of 1.0 m, chute slope of 55° and smooth ogee profile.
BACKGROUND
Experiments performed by Peterka (1953), and Russell and Sheehan (1974) indicated that a minimum air concentration of 5-8% is required to protect a concrete specimen of 10-20 MPa compressive strength. A simple and effective way to prevent cavitation damage is to introduce air near the spillway surface by artificial aeration. This is achieved by installing an aerator, which would deliberately cause a large cavity or void to be formed on the underside of a high velocity jet (Khatsuria 2004). Different types of aerators exist, such as deflectors or ramps, offsets, steps, grooves, crest piers or Flaring Gate Piers (FGP). The focus of this paper was specifically aimed at the addition of piers and FGP aerators.
Crest piers
Calitz (2015) conducted a physical hydraulic model study to investigate whether the introduction of a crest pier could initiate an earlier onset of air entrainment. Two different piers were used in this study, both designed as bullnose piers, which consisted of different lengths. Calitz found that the addition of a short bullnose pier alleviated the risk of cavitation damage and the safe unit discharge capacity was increased to 30 m2/s. As only one pier nose design and two pier lengths were investigated, a potential limitation was noticed. The authors attempted to optimise the pier design with alterations to the pier nose shape and pier length.
Flaring Gate Pier (FGP)
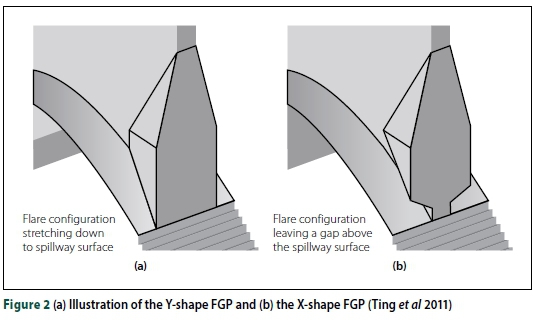
The pioneering design of flaring gate piers (FGP) was first introduced by Zhenying Gong in 1974, China. This innovation arose from simply reversing the conventional trend of gate pier design. Instead of square butt ends or tapering of the pier tail, the ends were substantially flared (Lin et al 1987). The design principle is to rapidly contract the flow and force it into a narrow, high-velocity jet. There are various FGP designs, such as the X-shape, Y-shape, V-shape and T-shape, but the X- and Y-shape are more commonly used.
Prototype applications of the Flaring Gate Pier
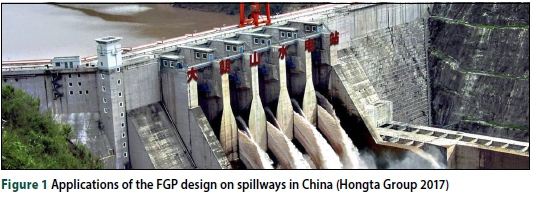
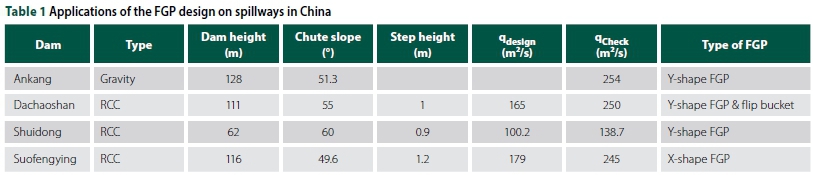
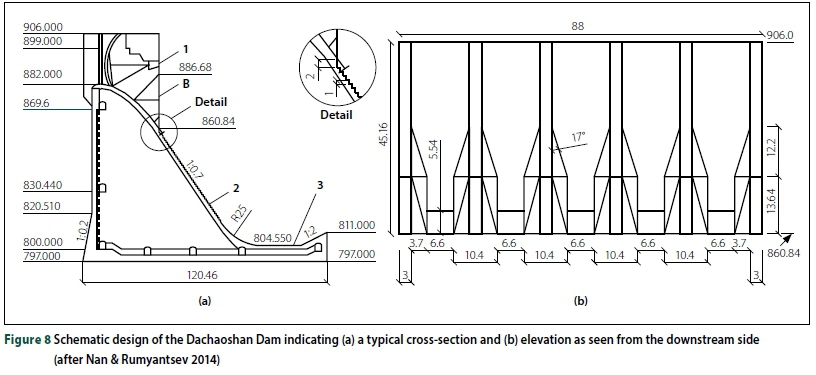
The FGP design has been applied in prototype on high head/velocity spillways in China. A few of these applications are tabulated in Table 1. The design and check unit discharges of the FGP applications imply significantly increased safe unit discharges when compared to a standard stepped spillway. Both the Dachaoshan Dam (Figure 1) and and the Shuidong Dam have experienced large floods close to the design unit discharge. The Dachaoshan Dam experienced a 93 m2/s flood, whereas the Shuidong Dam experienced a maximum unit discharge of 90 m2/s. Both of these stepped spillways were inspected after each of the respective floods, which led to the conclusion that no significant damage had occurred (Shen 2003).
X-and Y-shape FGP
The most widely used flare design in China is the Y-shape FGP, which is located approximately a third of the way downstream from the spillway crest. This specific flare design is characterised by frequent low or medium discharge floods. The piers constrict the flow, which result in narrow, supercritical flow past the FGP. Due to the narrowed flow width down the chute, the Y-shape FGP only uses a small area of the spillway for energy dissipation. In the case of the Dachaoshan Dam (Figure 1), only 30% of the stepped spillway surface is utilised for energy dissipation.
The X-shape FGP was designed to utilise more of the stepped spillway surface compared to the Y-shape FGP, as illustrated in Figure 2. The bottom outlet width of the X-shape FGP is wider than that of the Y-shape FGP. In the case of a low discharge, the flow is not contracted, and nearly all of the available stepped spillway surface area is used for aeration and energy dissipation. Since the flow passes mainly from the bottom outlet, at a low rate of discharge, a thin nappe develops (Bo et al 2007).
Air detrainment in impact regions
As the performance of the FGPs is characterised by the deflection of water in a ski-jump manner, an impact zone is located either on the spillway or downstream there of. Chanson (1994) conducted a physical model investigation in which the processes of aeration and de-aeration or detrainment were identified for a bottom aeration device. As the performance of the FGP is somewhat similar to the bottom aerator, the same five distinct flow regions were introduced as illustrated in Figure 3, which are:
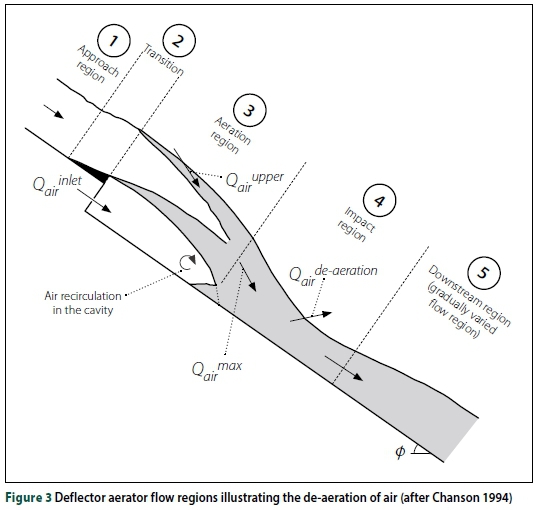
1. The approach flow region upstream of the aerator
2. The transition region which coincides with the length of the aerator
3. The aeration region downstream of the aerator
4. The impact region
5. The downstream flow region.
Air is entrained at both the upper and lower air-water interfaces, as well as by plunging jet entrainment at the intersection of the jet with the recirculating pool, formed at the end of the cavity within the aeration region. Downstream of the aeration region, within the impact region, air is detrained. This detrainment is subject to a rapid, pulsating change in pressure from a negative to a positive pressure at the impact point. Chanson (1994) found that up to 80% of the entrained air along the jet was detrained within the impact region. The quantity of de-aeration is based on the jet velocity at impact, jet thickness at impact, gravity, angle of the jet with the spillway at impact, spillway inclination angle and the quantity of air entrained.
LABORATORY FACILITIES AND INSTRUMENTATION
The hydraulic model experiments were performed at the Civil Engineering Hydraulic Laboratory at Stellenbosch University. Both of the Type A and Type B stepped spillway models were scaled according to the Froude Model Law, as the fluid motion is predominantly influenced by gravity and a free surface gradient is present.
Instrumentation
Pressure measurement
WIKA S-10 pressure transducers were installed in the step riser to measure the pressure on the upper part of the step riser. This specific type of pressure transducer has a working range of ±1 m and assured an accuracy of ±0.5%. These sensors captured the pressure data at a frequency of 100 Hz and an acquisition period of 10 minutes was used. The 0.15 percentile was used as the minimum pressure parameter in the cavitation evaluation.
Air concentration
A Thermo Needle Probe system, supplied by Teletronic, was used to measure the spillway air concentration at the pseudo-bottom. The air concentration was recorded with a stimulation fixed frequency of 10 kHz over a sampling period of one minute. The raw data was evaluated and visualised by using the VoidWizard software package, which was supplied by HZDR innovation. The processed data provided information such as the air concentration, the conductivity of the medium and the bubble count over a preselected time step. The probe measures a different conductivity, as the medium changes between water and air. The upper conductivity threshold is characterised as the liquid phase, while the lower threshold is characterised as the gaseous phase. The difference in conductivity between subsequent measurements was thus used by the VoidWizard software package to distinguish between liquid and air. The mean air concentration was used as the air concentration parameter in the cavitation evaluation (refer to Figure 4).
Avoidance of scale effects
Various researchers such as Pinto (1984), Vischer (1982), Speerli (1999), Pegram (1999) and Boes (2000), who were all cited in Boes (2000), identified a minimum scale of 1:15 to faithfully represent the prototype behaviour of a stepped spillway. The model scale of 1:15 for the Type A stepped spillway was considered large enough to neglect the aeration scale effects.
The Type B stepped spillway model was designed with a scale of 1:50, which exceeds the recommendations of the previously mentioned researchers. Although the small scale induced aeration scale effects, the air concentration was accurately scaled and captured, as it conformed to the law of self-similarity (Chanson & Carosi 2007; Chanson 2008; Felder & Chanson 2017). The phenomenon of self-similarity is defined as the spatial distribution of properties at various instances of time and spatial locations to be obtained from one another by a similarity transformation. Carosi, Chanson and Felder found that the void fraction remained invariant under scale changes for model Reynolds numbers greater than 8 χ 104.
EVALUATION OF CREST PIERS ON THE TYPE A STEPPED SPILLWAY
Spillway design
The 1:15 scale hydraulic model consisted of an uncontrolled ogee crest and stepped spillway. The ogee crest profile was designed according to the United States Bureau of Reclamation (USBR 1987) specifications. The spillway was constructed with a constant prototype step tread of 1.2 m and a step height of 1.5 m, resulting in an inclination angle of 51.3°, typical for RCC dams. To achieve adequate performance of the spillway for a range of discharges, a transitional step profile was introduced downstream of crest apex. The transitional profile provides increasing step treads, based on the design head, until the point of tangency is reached, whereafter a constant step design is implemented.
Crest pier design
Although crest piers are usually required to support a bridge or gates on a spillway crest, the purpose of the pier inclusion in this study was to induce artificial aeration into the flow. This paper considered variations of the pier design, comprising two different pier nose designs and two pier lengths.
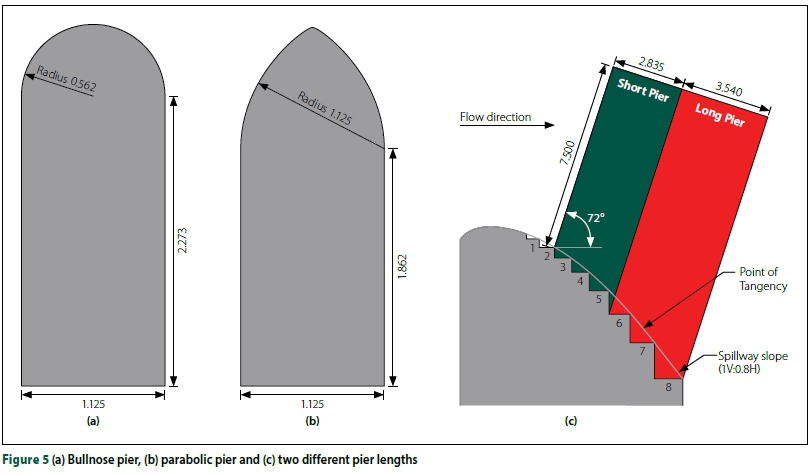
The pier nose shape was designed in accordance with the guidelines provided by the American Society of Civil Engineers (ASCE 1995). A constant prototype pier width of 1.125 m was advised in relation to the design head (0.267 Hd) and a bullnose and parabolic nose shape were selected. Two pier lengths were identified as suitable in order to investigate the effect thereof on the spillway aeration. The pier designs consisted of a short pier which extended 2.8 m downstream, and a long pier which extended 6.4 m downstream of the pier nose position. To ensure that the piers caused minimal additional head, they were placed downstream of the ogee crest at an angle of 72° to the horizontal. This concept was based on the pier design of the Gariep Dam in South Africa, where the piers were placed downstream of the crest, within the supercritical flow region, to eliminate any additional discharge head. Refer to Figure 5 (page 31) for a schematic illustration of the pier designs.
Model setup
The experimental area was defined to enclose the inception point, as the most severe minimum pressures had previously been measured in this location (Sànchez-Juny et al 2000). Four pressure sensors were installed on each measuring step, with the first sensor being installed in the middle of the spillway and subsequent sensors equally spaced. These pressure transducers were installed on the vertical step risers at a height approximately 0.9 times the step height. Due to the similarity of the model, the results were only measured on half of the spillway width. The air concentration was recorded at each of the pressure measuring positions, at the pseudo-bottom.
In order to eliminate variability in the measurements and ensure accurate results, 30% of the experiments were repeated. An average variation of 6.5% and 5% was measured for the air concentration and pressure results, respectively. The variation within the repeated experiments was considered acceptable, therefore not requiring the repetition of all tests.
Results
The experimental investigation consisted of four different pier model designs and a standard stepped spillway which acted as the control experiment. The experiments were conducted for a unit discharge of 30 m2/s, as Calitz (2015) had previously established the maximum safe unit discharge capacity of a standard stepped spillway to be 25 m2/s.
Visual observations
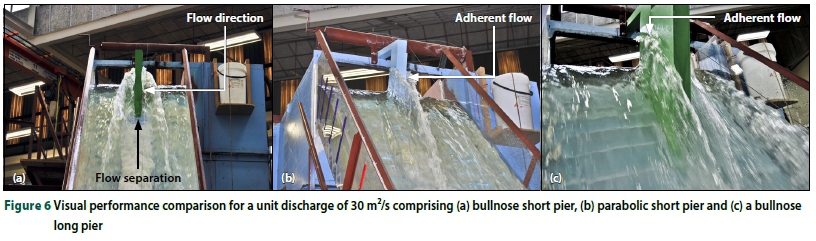
The performance of the bullnose short pier was characterised by a sharp redirection of flow, which was caused by the interaction of water on the blunt pier nose. The redirected flow allowed for a larger air void to form behind the pier, in turn permitting for a significant amount of air to be entrained. The parabolic short pier illustrated a variation in performance where the water flowing past the pier adhered to the pier sides. This was caused by the sharper pier nose which gradually redirected the flow past the pier. Adherent flow was observed for both the bullnose and parabolic long piers. The additional pier length removed the aeration which was observed on the side of the bullnose short pier, and subsequently an unaerated flow regime was experienced. Refer to Figure 6 (page 31) for the visual performance of the different crest pier designs.
Cavitation analysis
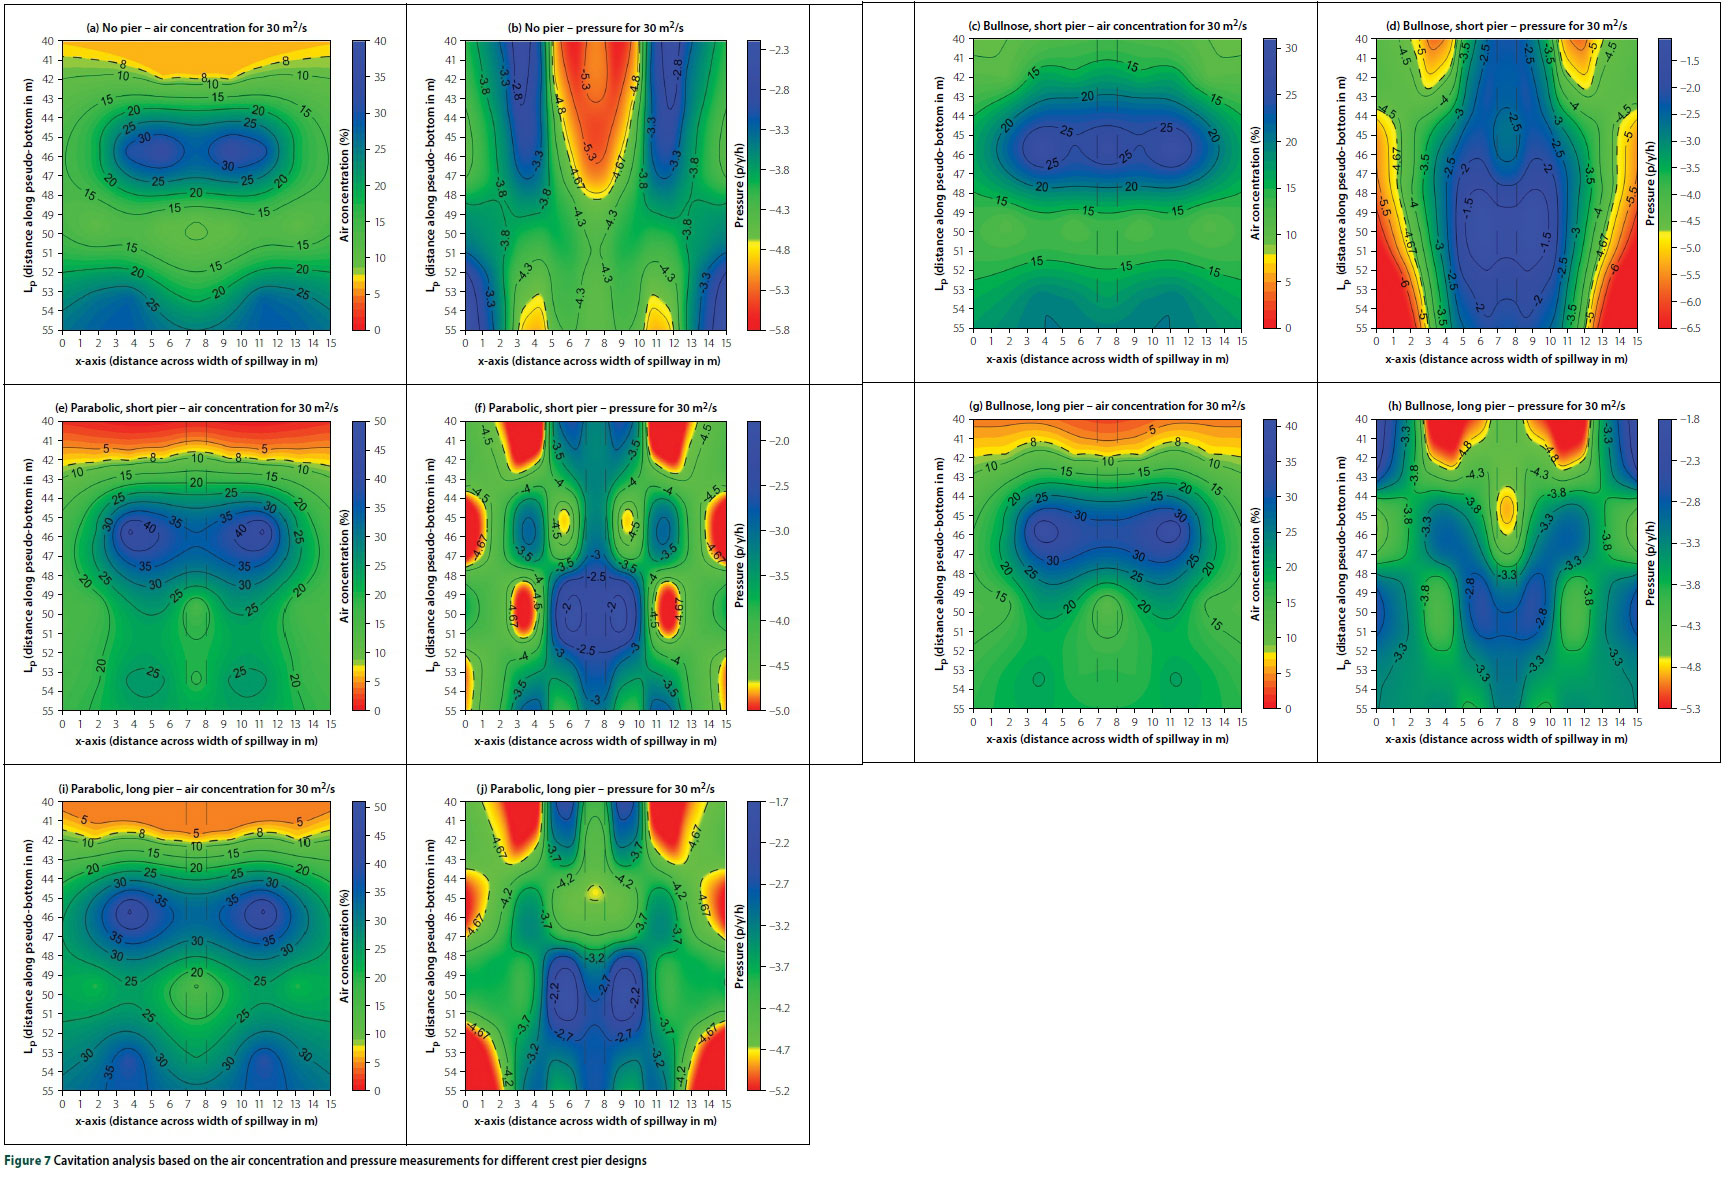
Analysis of the air concentration and pressure results was conducted to evaluate the potential of cavitation damage occurring on the spillway surface. The cavitation analysis comprised a visual presentation of the air concentration and pressure results for each of the model setups. The critical cavitation limits in terms of air concentration and pressure results were defined as 8% and -7 m, respectively. Peterka (1953) stated that a local air concentration of 8% is sufficient to avoid cavitation damage, due to the compressibility of the induced air, which absorbs the shock generated by the imploding vapour bubbles. The cavitation pressure limit of -7 m was transformed to a dimensionless pressure parameter (p/y/h) of -4.67, for a constant step height (h) of 1.5 m. Contour plots were used for the graphical presentation of the experimental results, which implemented a distinct colour scale where the boundary between yellow and green represented the critical cavitation limits for both the air concentration and pressure results. Refer to Figure 7 (page 32) for the air concentration and pressure results for various crest pier designs.
Through analysis of the experimental results, the bullnose short pier was identified as the best performing of the different piers in terms of air concentration, and it should be able to operate at a unit discharge of 30 m2/s without any risk of cavitation damage. This finding supports the similar conclusion of Calitz (2015). This was the only pier model to introduce an earlier onset of entrained air, compared to the control experiment. It should also be mentioned that the pressure results indicated that the introduction of crest piers relieved the negative pressures, relative to those experienced in the control experiment, but did not remove them.
EVALUATION OF FGPs ON THE TYPE B STEPPED SPILLWAY
Spillway design
A high head, stepped spillway of the Dachaoshan Dam (Figure 1) (page 29) in China was constructed to evaluate the performance of the spillway surface with different FGP designs. The Dachaoshan Dam was constructed as an RCC gravity dam with a height of 111 m. The dam became operational in 2002 and has since experienced a large flood which resulted in a maximum unit discharge of 93 m2/s. The dam discharges through five discharge bays which comprise Y-shape FGPs in combination with a slit-type flip bucket and three bottom outlets. A schematic design of the Dachaoshan Dam is illustrated in Figure 8.
The 1:50 scale hydraulic model utilised a smooth ogee crest, terminating at the downstream edge of the crest piers, whereafter it was succeeded by a stepped profile. The experiments were conducted on an uncontrolled ogee crest with the omission of radial gates between the piers. The crest design was based on a WES (1959) profile, with a vertical upstream face and four crest piers, spaced at 17 m, to form three discharge bays. The stepped spillway downstream of the crest piers was designed with a constant prototype step height of 1 m and a step tread of 0.7 m, except for the first step which had a step height of 2 m. The higher first step was included so that the flow would project over several steps, forming a large air cavity underneath the jet.
Flaring Gate Pier designs
The crest piers on the Dachaoshan Dam have two main functions. The first is to support the radial gates, since the dam is designed with a controlled crest. The second function is to support the FGPs, which are located at the downstream end of the crest piers, just upstream of the stepped spillway. This dam consists of six crest piers, each 45 m in length, which form five discharge bays over the crest. The pier design and spacing were based on the hydraulic design guidelines of the US Army WES (US WES 1959), i.e. a bullnose pier for high head dams which protrude upstream of the crest to increase the discharge efficiency.
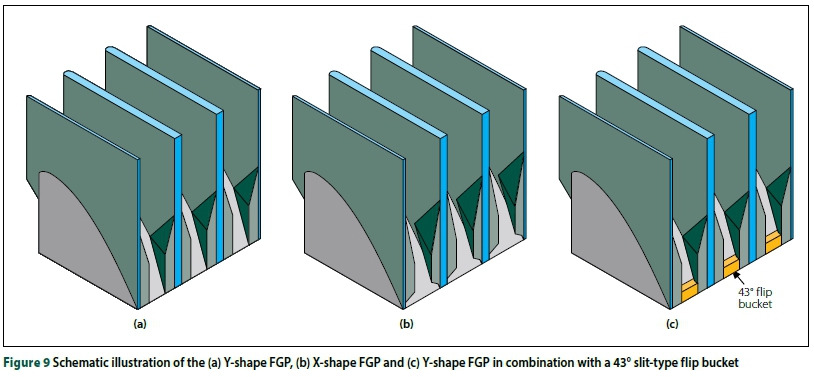
The FGP designs for this model study consisted of three cases, an X-shape FGP, a Y-shape FGP and a Y-shape FGP in combination with a 43° slit-type flip bucket as indicated in Figure 9. The purpose of the flares was to contract the flow, resulting in a narrow, high-velocity jet, which created several air-water surfaces where air could be entrained. The X-shape (Figure 9(b)) has a wider bottom outlet width than the Y-shape FGP (Figure 9(a)). The wide outlet was designed to safely pass a unit discharge of 30 m2/s without the influence of the flares. At increased unit discharges the flare would contract and deflect the water. The addition of the slit-type flip bucket, in combination with the Y-shape FGP (Figure 9(c)), forces the departing jet to disperse in a vertical plane resulting in a long, narrow impact area. Scour in the downstream bed is greatly reduced and model studies for the Dongjiang Dam, which is in the Hunan Province, China, reported a reduction of up to 80% (Lin et al 1987).
Model setup
The air concentration and pressure results were measured within the central discharge bay, along the length of the spillway. Three pressure sensors were located on each measuring step within the central bay, with the first sensor being installed in the middle of the bay and the two subsequent sensors equally spaced. These pressure transducers were installed on the vertical face of the step risers, at a height of approximately 0.75 times the step height. The results were measured on only half of the central discharge bay, as the similarity that was present in the physical model allowed for the mirroring of the results. The air concentration was recorded only on the centreline of the central bay, because of the time-consuming recording procedure.
To check the consistency of the model results, 40% of the experiments were repeated. An average error of 6.6% and 7.5% was recorded for the air concentration and pressure results, respectively. The repeatability of the recordings was deemed acceptable, hence all of the tests were not repeated.
Results
The experiments were conducted for unit discharges of 50, 100, 150 and 200 m2/s. The results presented in this paper are only for the 50 m2/s unit discharge, since safe unit discharges larger than 50 m2/s with the aerators were not attained experimentally. It is believed that the higher prototype unit discharges which were experienced at both the Dachaoshan Dam (93 m2/s) and the Shuidong Dam (90 m2/s), with minimal damage to the spillway, could be due to the high tail water level generally experienced within the narrow valleys in China.
Visual observations
The Y-shape FGP's performance is characterised by large, unused spillway areas for energy dissipation and the substantial deflection (contraction and upward deflection in a ski-jump manner) of water (Figure 10 (a)) (page 36). These ski-jump flow regimes were combined with longitudinal impact regions, which impinged on the stepped profile. Not only do these impact regions generate severe negative pressures, but they also lead to a decreased air concentration, according to Chanson (1994).
The design and performance of the X-shape FGP is very similar to that of the Y-shape FGP. The X-shape FGP was designed with a reduced flow blocking effect (i.e. water in the bottom part of the flow depth is not deflected) compared to the Y-shape FGP. The reduced blockage led to a decreased water deflection, as only the upper part of the flow is deflected by the flare, which is indicated in Figure 10(b) (page 36). The reduced deflection should be beneficial, since it would result in a smaller, dampened, impact region. These regions where the impact had been dampened would decrease the effect of impact detrainment, resulting in a higher, entrained air concentration.
The performance of the Y-shape FGP, combined with the slit-type flip bucket, was such that the water was not in contact with the stepped spillway. For all the tested unit discharges, the water was projected over the length of the spillway, as illustrated for the unit discharge of 50 m2/s in Figure 10(c). There was thus no energy dissipation by the stepped profile and the use of the steps would only be for economic benefit and the reduced construction time of RCC.
Cavitation analysis
The evaluation and interpretation of the cavitation analysis were based on the graphical presentation of the air concentration and pressure results. The cavitation analysis was based on the comparison of the air concentration and pressure results on the centreline, along the length of spillway. As the spillway pressures were recorded along the length and across the width of the spillway, pressure contour plots were used to illustrate the spillway performance. The performance for the FGPs was also compared with a stepped spillway without piers or flares, which acted as a control.
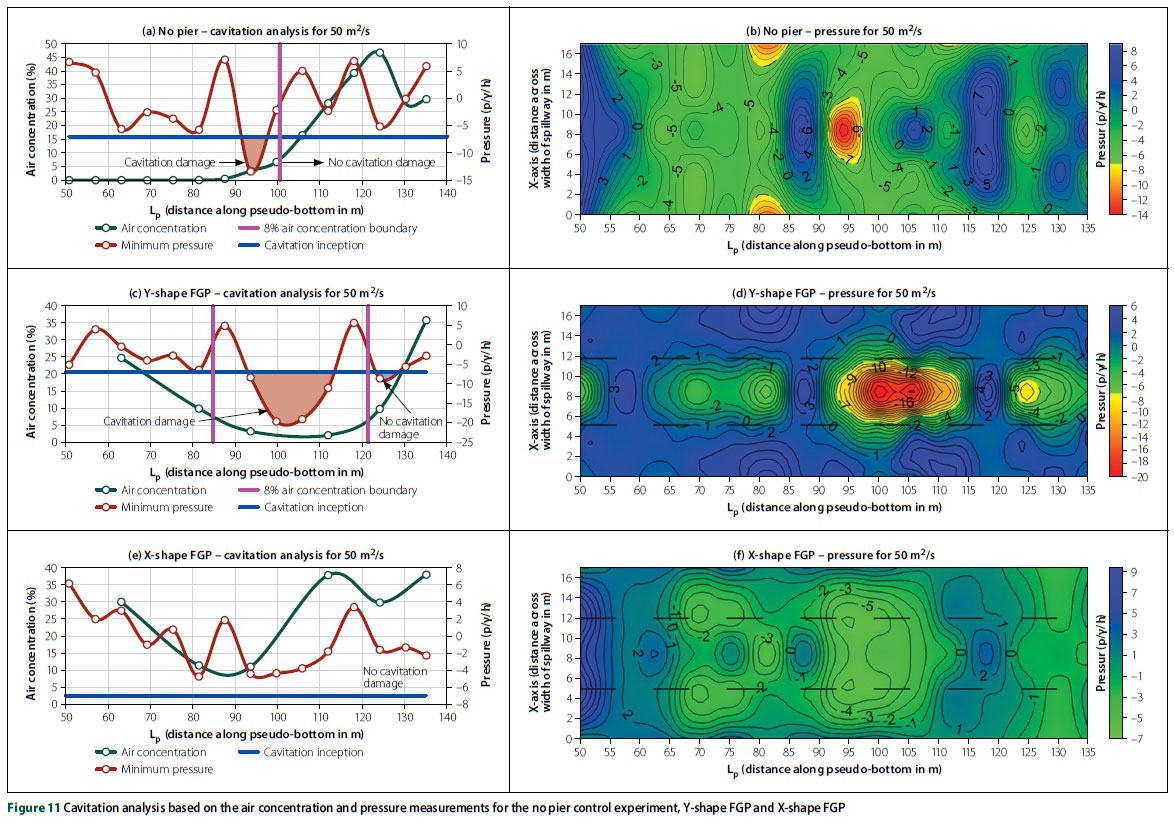
The critical air concentration and pressure values were defined as 8% and -7 m, respectively. The cavitation pressure limit of -7 m atmospheric pressure head was transformed to represent a dimensionless pressure parameter (p/y/h) of -7 for a constant prototype step height (h) of 1 m. The contour plots implemented a distinct colour scale, where the boundary between yellow and green represented the -7 m water pressure (dashed contour). The dashed, horizontal lines on the Y- and X-shape FGP contour plots define the flare extremities on either side of the central discharge bay. The cavitation analyses of the X- and Y-shape FGPs were based on the air concentration and pressure results along the spillway centreline for a unit discharge of 50 m2/s as seen in Figure 11.
For the no pier control case with the unit discharge of 50 m2/s, air was entrained and the pseudo-bottom inception point was located at Lp = 88.6 m. The lack of air entrainment between Lp = 50 and 90 m was attributed to the relatively small steps, compared to the flow depth which had a negligible effect on the development of the boundary layer. The centreline pressure results can be described as a wavy pattern, which illustrated that a portion of the flow was slightly redirected by the steps. The contour plots indicated regions of cavitation pressure which were first observed at a position approximately 80 m (Lp) downstream of the spillway crest. These regions coincided with areas of insufficient air concentration, which implies a likelihood of cavitation damage. This was observed for all the unit discharges tested.
For the Y-shape FGP case with the unit discharge of 50 m2/s, an increased air concentration was measured as compared to the control experiment at the upstream section of the spillway. It is considered that the increased air concentration is attributable to the larger first step, in combination with the Y-shape FGP. An air cavity is formed on the first step niche, from which air is entrained at the pseudo-bottom. A decreasing trend in the air concentration was observed in a downstream direction along the length of the spillway centreline, reaching a minimum in the impact zone. Overall, the Y-shape FGP entrained more air compared to the control experiment in the zone between Lp = 60 and 90 m; however, air was detrained within the impact regions. The Y-shape FGP pressure contour plot displayed two cavitation regions which occurred predominantly in the centre of the discharge bay, between the flare extremities. The cavitation evaluation identified one area (Lp = 93 to 113 m) which was vulnerable to cavitation damage. The overall performance of the spillway was therefore not improved with the addition of the Y-shape FGP, and the safe unit discharge capacity would be less than 50 m2/s.
For the X-shape FGP case with the unit discharge of 50 m2/s, a significant improvement in the spillway performance was noticed. Sufficient amounts of air were entrained along the entire spillway length, whilst a minimum air concentration of 11% was recorded at Lp = 93.6 m (minimum value on the graph is an interpolation). Similar to the air concentration performance, a significant improvement in terms of the spillway pressures was noticed for the unit discharge of 50 m2/s. No cavitation pressures were recorded along the length (Lp ranging from 50 to 135 m) or across the width of the discharge bay. At higher discharges, severe negative pressures were measured in the downstream region of the spillway, which are highly unfavourable. Therefore, the X-shape FGP increased the safe unit discharge capacity of the stepped spillway to 50 m2/s.
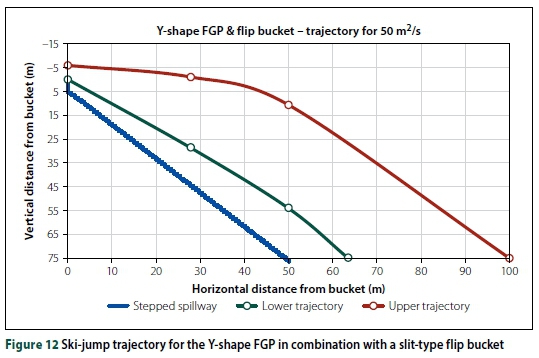
Ski-jump trajectory of the Y-shape FGP in combination with a slit-type flip bucket
The ski-jump type trajectory (upper and lower edges of the projected nappe) for the Y-shape FGP in combination with the flip bucket is illustrated in Figure 12 (page 38). This combination significantly altered the flow pattern and projected all of the water over the entire length of the spillway. For the unit discharge of 50 m2/s, the water was horizontally deflected by 13 m at the spillway toe. As the investigation of the impact regions downstream of the spillway toe is beyond the scope of this study, it suffices to state that a stilling basin with a minimum tail water level would probably be required in order to absorb the impact forces on the toe foundation.
CONCLUSIONS
Type A stepped spillway investigation
The most important conclusion from the Type A stepped spillway investigation is summarised as follows:
■ The maximum, safe unit discharge capacity of a stepped spillway without crest piers was previously determined to be 25 m2/s (Calitz 2015). The implementation of the short, bullnose pier at the spillway crest increased the safe unit discharge capacity to 30 m2/s, by eliminating the risk of cavitation damage. This was the only crest pier design that increased the discharge capacity.
Type B stepped spillway investigation
The Type B stepped spillway was investigated to determine how the existing, high unit discharge, stepped spillways in China performed with respect to aeration and pressure on the pseudo-bottom for each of the aeration structures. The conclusions are summarised as follows:
■ The most notable improvement was the increase of the safe unit discharge capacity to 50 m2/s in the case of the X-shape FGP. Air concentrations above the 8% limit were recorded along
the length of the spillway, whilst the entire spillway area (Lp= 50 m and Lp= 135 m) was free of cavitation pressures. This design is not advised for higher unit discharges, since it generated severe negative pressures at Lp = 135 m.
■ The spillway performance of the Y-shape FGP was the most consistent, irrespective of the unit discharge. Not only were the air concentration and pressure results similar, but at higher unit discharges, the Y-shape FGP out performed the X-shape FGP. However, cavitation regions were observed in a small section on the downstream end of the spillway (Lp = 91 m to 135 m). Future research is required to determine the tail water level, which would prevent cavitation damage in the downstream region.
■ The Y-shape FGP, together with the slit-type flip bucket, projected the flow over the entire length of the stepped spillway for all the tested unit discharges (50 m2/s to 200 m2/s). As no water was discharged via the stepped spillway, it was free of exposure to cavitation damage.
■ The Type B stepped spillway investigation did not improve the safe unit discharge capacity to the design capacity of 200 m2/s like some of the Chinese Dams. Nonetheless, the results were of value, as they enhanced the understanding of the FGP performance and design. The impact regions should ideally be located downstream of the spillway toe, to avoid the de-aeration of the flow and the accompanying cavitation pressures on the step edges.
REFERENCES
ASCE (American Society of Civil Engineers) 1995. Hydraulic Design of Spill-ways. Reston, VA: ASCE. [ Links ]
Boes, R M 2000. Scale effects in modelling two-phase stepped spillway flow. International Workshop on Hydraulics of Stepped Spillways. Leiden, Netherlands: Balkema, 53-60. [ Links ]
Bo, W, Chao, W, Hu, Y & Mo, Z 2007. Relationship of first step height, step slope and cavity in X-shaped flaring gate piers. Journal of Hydrodynamics, 19: 349-355. [ Links ]
Calitz, J 2015. Investigation of air concentration and pressures of a stepped spillway equipped with a crest pier. MEng Dissertation. Stellenbosh University. [ Links ]
Chanson, H 1994. Aeration and deaeration at bottom aeration devices on spillways. Canadian Journal of Civil Engineering, 21: 404-409. [ Links ]
Chanson, H 2008. Physical modelling, scale effects, and self-similarity of stepped spillway flows. World Environment and Water Resources Congress, 1-10. [ Links ]
Chanson, H & Carosi, G 2007. Turbulent time and length scale measurements in high-velocity open channel flows. Experiments in Fluids, 42: 385-401. [ Links ]
Felder, S & Chanson, H 2017. Scale effects in microscopic air-water flow properties in highvelocity free surface flows. Experimental Thermal and Fluid Science, 83: 19-36. [ Links ]
Hongta Group 2017. Dachaoshan Dam. Available at: http://www.hongta.com/language/en/aboutus/htcy/201110/t20111012_148018.htm[accessed on 1 January 2017]. [ Links ]
Khatsuria, R M 2004. Hydraulics of Spill-ways and Energy Dissipators. Boca Raton, FL: CRC Press. [ Links ]
Lin, B, Li, G & Chen, H 1987. Hydraulic research in China. Journal of Hydraulic Engineering, 113: 47-60. [ Links ]
Nan, F & Rumyantsev, I 2014. Modelling of flood routing through stepped spillway of water reservoir dam. Proceedings, 11th International Conference on Hydroinformatics (HIC 2014), 8 January, New York. CUNY Academic Works. Available at: http://academicworks.cuny.edu/cc_conf_hic/375. [ Links ]
Nortjé, J 2002. Dam safety legislation and programme in the Republic of South Africa. In Design and Rehabilitation of Dams. Short course presented by the Institute for Water and Environmental Engineering, Stellenbosch University. [ Links ]
Peterka, A J 1953. The Effect of Entrained Air on Cavitation Pitting. Reston, VA: ASCE, 507-518. [ Links ]
Pfister, M & Hager, W H 2011. Self-entrainment of air on stepped spillways. International Journal of Multiphase Flow, 37(2): 99-107. [ Links ]
Russell, S & Sheehan, G 1974. Effect of entrained air on cavitation damage. Canadian Journal of Civil Engineering, 1(2): 97-107. [ Links ]
Sànchez-Juny, M, Pomares, J & Dolz, J 2000. Pressure field in skimming flow over a stepped spillway. In Minor, H E & Hager, W H, Proceedings, International Workshop on Hydraulics of Stepped Spillways, 22-24 March, Zurich, Switzerland, Rotterdam: Balkema, pp 137-146. [ Links ]
Shen, C 2003. RCC dams in China. Proceedings, 4th International Symposium on Roller Compacted Concrete, 17-19 November, Madrid, Spain. [ Links ]
Ting, Z, Chao, W & Qi, Z 2011. Comparison on somatotype of X- and Y-shape flaring gate pier connected with stepped spillway. Advanced Materials Research, 3661-3665. [ Links ]
US WESS (US Army Waterways Experimenal Station) 1959. Hydraulic Design Criteria. Ficksburg, MS: US WESS. [ Links ]
USBR (United States Bureau of Reclamation) 1987. Design of Small Dams. Water Resources Technical Publication No. 2. Washington, DC: USBR. [ Links ]
 Correspondence:
J Koen
Department of Civil Engineering
Stellenbosch University
Private Bag X1
Matieland 7602
South Africa
City of Cape Town Water and Sanitation Head Office
8 Voortrekker Road
Bellville 7535
South Africa
T: +27 21 400 5777
E: jaco.koen@capetown.gov.za / jacokoen2@gmail.com
D E Bosman
Water Division (Retired Lecturer)
Department of Civil Engineering
Stellenbosch University
Private Bag X1
Matieland 7602
South Africa
T: +27 21 886 4193
E: debosman@sun.ac.za
G R Basson
Water and Environmental Engineering Division
Department of Civil Engineering
Stellenbosch University
Private Bag X1
Matieland 7602
South Africa
T: +27 21 808 4355
E: grbasson@sun.ac.za

JACO KOEN, who is an Associate Member of SAICE, is currently employed by the City of Cape Town as a project engineer within the Water and Sanitation Department. He obtained his BEng and MEng in Civil Engineering (cum laude) from Stellenbosch University in 2015 and 2017, respectively. His research interests include hydraulic structures, dam spillways and open channel hydraulics.

EDDIE BOSMAN obtained his BSc and BEng degrees from Stellenbosch University, and a post-graduate Diploma in Hydraulic Engineering from the International Institute for Hydraulic and Environmental Engineering in Delft, The Netherlands. He has 48 years' professional experience in research, private consulting and lecturing. At the end of 2009 he retired from the chair in Port & Coastal Engineering in the Water Division of Stellenbosch University, and is presently practising on an ad hoc basis.

PROF GERRIT R BASSON Pr Eng, who is a Member of SAICE, is a professor in Hydraulic Engineering in the Civil Engineering Department at Stellenbosch University. He obtained a PhD from Stellenbosch University in 1996 and has more than 30 years' experience mainly in the fields of river hydraulics, fluvial morphology and the design of large hydraulic structures. He has worked on projects in 21 countries.

