


Serviços Personalizados
Artigo
 Inglês (pdf)
 Artigo em XML
 Referências do artigo
Indicadores

Links relacionados
-
 Citado por Google
 -
 Similares em Google
Compartilhar

 Permalink
Journal of the South African Institution of Civil Engineering
versão On-line ISSN 2309-8775
versão impressa ISSN 1021-2019
J. S. Afr. Inst. Civ. Eng. vol.61 no.2 Midrand Jun. 2019
http://dx.doi.org/10.17159/2309-8775/2019/v61n2a2
TECHNICAL PAPER
The influence of gradient on saturation flow rate at signalised intersections
M M Bruwer; C J Bester; E S Viljoen
ABSTRACT
Saturation flow rate is the maximum hourly traffic volume per lane that can be accommodated through an intersection, and is used in the design and analysis of signalised intersections and traffic signal plans. The most widely applied method to estimate saturation flow rate is provided by the Highway Capacity Manual (HCM), which proposes default values obtained from USA empirical data for application in saturation flow rate calculations. This study considers the applicability of the HCM proposed base saturation flow rates, and particularly the adjustment factors for gradient on saturation flow in the South African context. The data for this research was collected by author ES Viljoen for use in her dissertation conducted in the final year of the BEng degree at Stellenbosch University.
The influence of approach lane gradient on saturation flow rate was investigated for application in the South African environment. The results of this research indicate that the HCM underestimates the influence of approach gradient on saturation flow rate, a similar finding to other international research. The standard use of a base saturation flow rate of 1 900 passenger cars per hour per lane for South African conditions was also commented on. HCM methods do not take into account the influence of speed limit on saturation flow rate, which has been shown to significantly affect saturation flow rate in numerous research projects, and is also commented on in this paper for zones with a 60 km/h and 80 km/h speed limit.
Keywords: saturation flow, gradient, traffic signal
INTRODUCTION
Saturation flow rate is the maximum flow of vehicles per hour that could traverse a single approach lane of a signalised intersection if the approach were allocated green time for a full hour. Saturation flow rate is a critical value in the design and capacity analysis of signalised intersections and the determination of traffic signal phasing plans. It is important that the saturation flow rate used in the design and Level of Service (LOS) analysis of a signalised intersection is representative of actual flow rates, as this value can have a significant impact on the number of vehicles that can be accommodated at an intersection, and therefore the appropriate design of the intersection itself.
A number of factors influence the saturation flow rate of an intersection approach lane, including the location of the intersection, the vehicle composition of the traffic stream and the presence of parking or public transport facilities near the intersection. Geometric elements that are important for saturation flow rate estimation include number of lanes, lane width, accommodation of turning movements and the gradient of the approach.
The Highway Capacity Manual (TRB 2010, referred to further as HCM2010), describes a method to calculate saturation flow rate that is applied by traffic engineers worldwide, including in South Africa. The HCM2010 method is also used in the majority of traffic simulation packages, including SIDRA, PTV Vistro and Aimsun (Akcelik and Associates (Pty) Ltd 2016; PTV Group 2016; Transport Simulation Systems 2015). The universally applicable equation recommended by HCM2010 to estimate saturation flow rate is accompanied by proposed default values obtained from empirical analysis conducted in the United States of America, detailing typical USA traffic conditions. The applicability of the HCM2010 default values to estimate saturation flow rate for South African traffic conditions is considered in this paper, particularly regarding the impact of approach gradient on saturation flow rates for arterial roads. Base saturation flow rates, as well as the impact of speed limit on base saturation flow, are also commented on.
SATURATION FLOW RATE
Traffic flow at signalised intersections
The headway between vehicles passing through a signalised intersection during the green phase decreases until a typical minimum headway, or saturation headway, is reached (Bester & Meyers 2007). This minimum headway is inversely representative of the saturation flow rate. The first headway, i.e. the time interval between the traffic light changing to green and the rear wheels of the first vehicle passing the stop line, is generally longer than subsequent headways between vehicles due to start-up lost time. The driver at the head of the queue must observe the signal changing to green and then accelerate from standstill, and so passes the stop line with some delay after the signal had changed to green. The second driver in the queue has the opportunity to observe and react to the change in traffic signal during the start-up time of the first driver, and so the headway between the second and first vehicle is shorter. This is repeated by subsequent vehicles until headways reduce to a typical minimum headway, which is observed to remain virtually constant until the queue has dissipated.
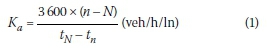
The minimum headway, or saturation headway, is usually achieved by the time that the fourth to sixth vehicle in the queue has passed the stop line (Garber & Hoel 2015). If a near constant headway is observed after the Nth vehicle, Equation 1 can be used to calculate the saturation flow rate (S) in vehicles per hour per lane from observed data; where n is the total number of vehicles queued, tnis the time in seconds from the start of the green light to when the rear wheel of the Nth vehicle passes the stop line, and tnis the time until the rear wheel of the last queued vehicle passes the stop line in seconds:
Use of saturation flow rate
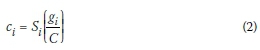
Saturation flow rate is a key variable used to calculate the capacity of an approach at a signalised intersection, and is therefore a principal requirement for the correct design of signalised intersections. The capacity c of lane group i is a function of the saturation flow rate (Si) of the lane group and the proportion of green time giallocated to that lane group and cycle length C, as described by Equation 2 (Garber & Hoel 2015).
Optimal cycle length can be determined according to the Webster Method, which uses the ratio of the actual or anticipated lane group traffic volume to saturation flow rate. This ratio is then also used to allocate green time to the various signal phases (Garber & Hoel 2015). Similarly, the HCM2010 uses the ratio of traffic volume to saturation flow rate to determine cycle length and green time allocation (TRB 2010).
HCM2010 method for saturation flow rate estimation
As saturation flow rate is used to design new signalised intersections, the majority of saturation flow rates used by traffic engineers must be estimated, rather than empirically determined using Equation 1.
The HCM2010 method to estimate saturation flow is generally accepted and used for this purpose. The HCM2010 adjusts a selected base saturation flow rate according to conditions of traffic and intersection design. Base saturation flow rate is assumed to be the flow that could be accommodated at the approach of an intersection under ideal or base conditions, listed below (TRB 2010):
■ Traffic lanes of at least 3.6 m width
■ No heavy vehicles in traffic stream (only passenger vehicles)
■ Flat gradient at approaches
■ No parking or bus stops near the intersection
■ No pedestrian crossing activity
■ No vehicular turning movements (base saturation flow for straight-through movement).
The base saturation rate is proposed to be 1 900 passenger cars per hour per lane (pc/h/ln) in large metropolitan areas with more than 250 000 population, and 1 750 pc/h/ln in other areas.
The base saturation flow rate is adjusted using a number of factors that take into account departure from the base conditions. Eleven factors in total are proposed for consideration by the HCM2010, including factors to adjust for lane width, heavy vehicle proportion, approach grade, parking and bus stops, the area in which the intersection is located, lane utilisation (for multiple movement type lanes) and adjustments for the impact of pedestrians and cyclists on turning movements (TRB 2010). Base saturation flow rates are expressed in terms of passenger cars per hour per lane (pc/h/ln). Once the percentage of heavy vehicles is accounted for, saturation flow is expressed as vehicles per hour per lane (veh/h/ln).
South African studies of saturation flow rate
Very little research regarding empirical surveys of saturation flow rate in South Africa is available (Bester & Meyers 2007). This is problematic, as it requires traffic engineers in South Africa to apply the HCM2010 base saturation flow rates based on default USA values and adjustment factors without knowledge of their applicability to local conditions.
The study conducted by Bester and Meyers (2007) reported on observed saturation flow rate at ten intersections in Stellenbosch. A multiple regression analysis was performed to determine the cumulative influence of gradient, number of lanes and speed limit on saturation flow rate. The study determined that each variable had a statistically significant influence on saturation flow rate. Increase in speed limit and number of through lanes were shown to increase saturation flow rate, while an increase in positive approach gradient reduced saturation flow rate (Bester & Meyers 2007).
The 2007 Bester and Meyers study reported a base saturation flow rate higher than that described in the HCM2010. This was specifically based on observations in the Stellenbosch area. They concluded that South African drivers are possibly more aggressive, maintaining shorter following distances (Bester & Meyers 2007). They recommend a base saturation flow rate of 2 246 pc/h/ln for a speed limit of 80 km/h and 2 076 pc/h/ln for a speed limit of 60 km/h. Another 1994 study done in South Africa, conducted for the Department of Transport, reported a base saturation flow rate of 1 928 pc/h/ln (Allers & Stander 1994), which is similar to the HCM2010 suggested value.
The Bester and Meyers (2007) study considered the influence of speed limit and number of through lanes on saturation flow rate. The HCM2010 method does not account for these factors. However, other international studies have indicated these factors to have a significant influence on saturation flow rate. A study conducted by the Texas Transportation Institute in 2005 determined a base saturation flow rate of 1 905 pc/h/ln (similar to the HCM2010), and found that this rate decreased by 9 pc/h/ln per 1 mph (5.6 pc/h/ln per 1 km/h) decrease in speed limit, and increased by 130 pc/h/ln when the number of through lanes are increased from one lane to two (Bester & Meyers 2007). The 2007 Bester and Meyers study found that speed limit and number of lanes have a similar, albeit greater, effect on saturation flow rate. The saturation flow rate increases with 8.5 pc/h/ln per 1 km/h increase in speed limit, and increases with 288 pc/h/ln when two through lanes are available instead of one.
The influence of gradient
The factor used by the HCM2010 to adjust the base saturation flow rate for the gradient of the approach (fg) is determined by Equation 3, where Pgis the gradient of the approach in percentage. An uphill gradient is annotated to be positive, and a downhill gradient is negative. Equation 3 is applicable to gradients ranging from -6% to +10% (TRB 2010).
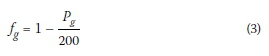
The gradient adjustment factor results in a decrease in saturation flow rate for positive, uphill gradients, and an increase in saturation flow rate for downhill approaches. Essentially, a 1% gradient will result in a 0.5% change in flow rate (10 pc/h/ln from base saturation flow rate of 1 900 pc/h/ln).
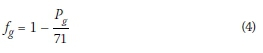
The 2007 South African study determined the influence of gradient on saturation flow to be nearly three times more than predicted by the HCM2010 approach when applied to a base saturation flow rate of 1 900 pc/h/ln (Bester & Meyers 2007). Their suggested adjustment factor for gradient is provided in Equation 4, which results in an adjustment of 1.4% change in flow rate for a 1% change in gradient.
Research conducted in 2009 that considered a number of international studies on saturation flow rate, found that the majority of studies indicated a greater influence of gradient on saturation flow rate than indicated by the HCM (Iqbal 2009).
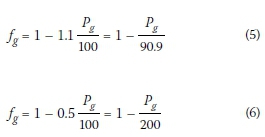
A 1982 study conducted in Kentucky, USA, considered the influence of positive and negative gradients on saturation flow separately. This study determined that positive gradients (uphill) have less influence on saturation flow rates than negative (downhill) gradients (Agent & Crabtree 1982). The equations for the gradient adjustment factors determined from this study are presented below. Equation 5 indicates the factor for downhill gradients (Pgis negative) and Equation 6 for uphill gradients (Pgis positive). When the equations are written in the same form as the HCM2010 gradient adjustment factors, it is clear that the Agent and Crabtree (1982) factor for positive gradients is the same as suggested by HCM2010 for all gradients (Equation 6), while the negative gradient adjustment factor will have a greater impact on saturation flow rate.
From previously conducted South African and international research, it appears that the HCM2010 method underestimates the influence of gradient on saturation flow rate.
DATA COLLECTION
Study area
A headway study was done at 12 approaches of six intersections in Stellenbosch, South Africa, during September 2015. All intersections were located along the same route, the R44, an arterial road heading south from Stellenbosch. Only approaches of the R44 were analysed; minor road approaches were not considered. Intersections with similar properties were selected, and as many factors as possible that influence saturation flow rate were excluded, or were ensured to remain constant to isolate the influence of gradient.
All the study intersections are located outside of the CBD area of Stellenbosch in suburban or peri-urban zones. The lane width along the route remained consistent at an average of 3.6 m. Only phases with no heavy vehicles present in the queue were observed, and phases were not observed if pedestrians or cyclists were present. None of the intersections had parking or bus stops in the immediate vicinity. Finally, only lanes with exclusive through movements and two through lanes per approach were analysed. The only characteristic from the HCM2010 method that varied appreciably along the route was approach gradient.
The speed limit varied from 60 km/h at two intersections closest to Stellenbosch, to 80 km/h at the remaining four intersections. Because speed limit influence is not considered in the HCM, the influence of speed on base saturation flow rate was also not isolated in this study. Comment is, however, made later in this paper on the apparent effect of speed limit on base saturation flow.
Gradient measurement
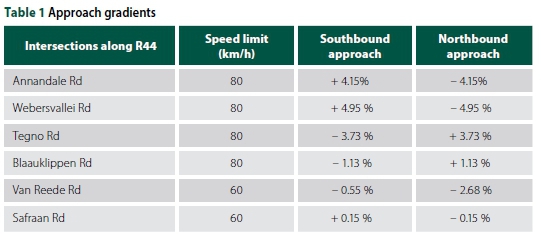
The gradient of the intersection approaches was measured using a dumpy level. The level difference was measured over a 20 m distance from the stop line of the approach, and the gradient in percentage was calculated as the change in height over the change in distance. Table 1 indicates the gradient observed at the various approaches.
Vehicle headway analysis
Traffic streams at the intersection approaches along the R44 were recorded with a GoPro Camera. The study was conducted during peak hours to ensure that adequate vehicles were queued to allow saturation headway to be reached, while downstream congestion was monitored to exclude influence. Adobe Photoshop Element was used to analyse the footage. This software package has a split-second function and can play back footage at a slower speed, so that the exact time stamp (to the nearest 0.01 seconds) at which the back wheel of a vehicle crosses the stop line can be observed with no human error incurred from stopwatch timing. Any phases with heavy vehicles or pedestrian and cyclist activity were excluded from the study. It was also necessary to ignore some phases where downstream congestion prevented vehicles driving freely through the intersection.
Figure 1 indicates the progression of vehicle headways for illustration purposes as the queue of vehicles dispersed from two opposing approach lanes of a single intersection (R44 and Tegno Road intersection). The first vehicle in the queue had a relatively long headway from the time that the traffic signal turned green until the back wheels of that vehicle passed the stop line. The headways between subsequent vehicles then reduced systematically, as anticipated.
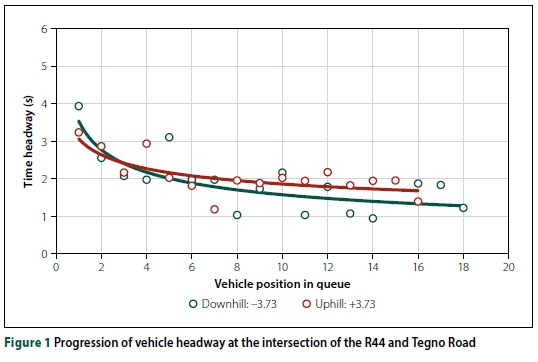
Figure 1 presents the headways of vehicles at both the southbound and northbound approaches of the intersection of Tegno Road and the R44, which has a downhill and uphill gradient of 3.73% respectively. Also indicated are trend lines demonstrating the tendency of the headways to reduce as the queue disperses. The trend lines indicate that the headways reach a relatively constant value from the sixth departure from the queue. Saturation headway was consistently found to be longer on the uphill approach than on the downhill approach at the same intersection.
SATURATION FLOW RATE RESULTS
Saturation headway results
The results of the headway and saturation flow analysis of six intersections in Stellenbosch are presented in Table 2. Saturation flow rate is indicated in terms of passenger cars per hour per lane, because no heavy vehicles were present in analysed queues.
Four queues were analysed per intersection approach, and the average saturation flow rate and standard deviation of saturation flow rates were determined. In each case, the vehicle number at which saturation flow was reached (when headways became constant) was evaluated and saturation flow calculated according to Equation 1. The saturation flow was calculated only using vehicles that were in the initial stationary queue. As soon as a gap was measured that was longer than double the gap during saturation flow, the queue was considered spent, and no further headways were included in the analysis. As queue length varied per cycle, the number of headways considered to calculate saturation flow varied in each case. No standard deviation is provided for the northbound approach of Van Reede Street, as only one valid saturation flow rate value was obtained due to downstream congestion.
The average saturation headways between vehicles are less than 2 seconds per vehicle on all approaches, except the southbound approach of the intersection of the R44 with Annandale Road. This intersection represents the minimum and maximum saturation flows that were observed - 1 766 pc/h/ln and 2 386 pc/h/ln respectively. The saturation flows measured at the intersection of the R44 with Safraan Road are essentially equal for the two approaches (1 850 pc/h/ln), which are relatively level.
The influence of gradient on saturation flow rate
It is obvious from the results indicated in Table 2 that gradient has a significant effect on saturation flow rate, with a clear difference in the saturation flow rates on the northbound and southbound approaches of intersections with steep gradients. The highest flow rate is always observed on downhill approaches.
Figure 2 indicates saturation flow rate as a function of gradient resulting from the 2015 acquired Stellenbosch data. Also indicated are HCM2010 saturation flows at different gradients for large cities and other areas. As gradient increases positively, saturation flow rate is observed to decrease, indicated by the linear regression line. The R2 value of the regression curve indicates that the relationship between gradient and saturation flow rate can be relatively well described, with 75% of variation accounted for. The equation of the regression line indicates an intercept of 2 000 pc/h/ln. This is representative of base saturation flow rate at a gradient of 0% with all other influencing factors constant. It would therefore appear that this study corroborates the findings of Bester and Meyers (2007), that saturation flow in South Africa is higher than is suggested by the HCM (1 900 pc/h/ln in large metropolitan areas with more than 250 000 population, or 1 750 pc/h/ln in other areas) (Transportation Research Board 2010).
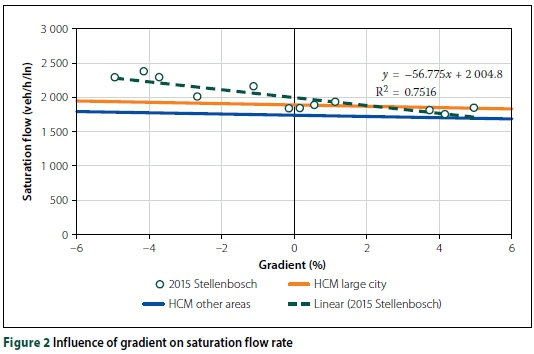
From the regression equation presented in Figure 2, the adjustment factor of gradient on saturation flow rate, according to the form of the adjustment factors presented by the HCM2010, is described by Equation 7, as applied to a base saturation flow of 1 900 pc/h/ln. The effect of gradient in this study is six times greater than proposed by the HCM2010, and also higher than the influence determined by the 2007 South African study. The adjustment factor presented by Equation 7 results in a 3% decrease in saturation flow rate for a 1% increase in gradient, similar to the international findings of Iqbal (2009).
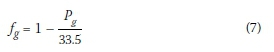
The influence of positive and negative gradients was then separately considered to determine if uphill and downhill slopes influence saturation flow rate differently. Figure 3 indicates a separate linear regression analysis conducted for positive and negative gradients respectively. From this figure it is evident that negative gradients have a greater influence on saturation flow rate than positive gradients according to the steepness of the regression lines, similar to the findings of the 1982 Kentucky study (Agent & Crabtree 1982).
The intercept of both regression curves, representative of the base saturation flow rate, is close to 1 900 pc/h/ln. For negative gradients, the saturation flow rate was increased by nearly 5% for every 1% increase in approach steepness, while at positive gradients, a 1% increase in steepness results in only a 1% reduction in flow rate. The R2 values for these regression analyses are, however, substantially lower than were obtained for the single regression analysis (Figure 2), indicating that the smaller sample for uphill and downhill gradients results in larger variation and less confidence in the outcome.
The influence of speed limit on saturation flow rate
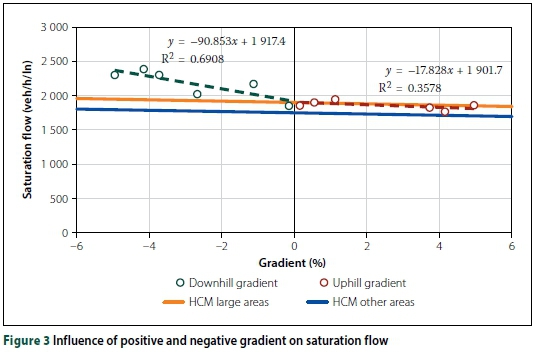
The Highway Capacity Manual does not take speed limit into account when determining saturation flow rate. However, previous research (Bester & Meyers 2007) indicated that speed limit influences saturation flow rate. Higher speed limits tend to increase saturation flow rate and vice versa.
In Figure 4 the data sets representing 80 km/h and 60 km/h speed limit zones were analysed separately. A linear regression analysis conducted for each set of data indicates that the influence of gradient on saturation flow rate (indicated by the gradient of the regression line) stays relatively constant at different speed limits. Similar to the model that did not separate speed limit zones (Equation 7), the regression analysis for both 60 km/h and 80 km/h zones represented in Figure 4 results in approximately a 3% decrease in saturation flow rate per 1% increase in gradient.
It must be noted that the sample of four approach lanes in the 60 km/h range is inadequate for a statistical analysis to provide reliable conclusions as to the base saturation flow rate of intersection approaches at this speed limit. Further, analysis of the influence of gradient at a 60 km/h speed limit from the data presented in this research is also not statistically reliable, due to the narrow range of gradients, most of which are close to 0% gradient. The analysis of speed limit influence was not the primary objective of this research (which was to determine the accuracy of USA-based data to describe the influence of gradient on saturation flow in South Africa); however, it is considered relevant to comment on the influence of speed limit, considering previous research.
While the influence of gradient on saturation flow rate stays relatively constant at different speed limits, the base saturation flow rate, indicated by the intercept of the regression lines, appears to be influenced. In the 60 km/h zone, base saturation flow is 1 880 pc/h/ln, but 2 070 pc/h/ln in 80 km/h zones (190 pc/h/ln difference). This difference in base saturation flow is very similar to the findings of the 2007 South African study, which estimated an increase of 8.5 pc/h/ln per 1 km/h increase in speed limit (Bester & Meyers 2007), or 170 pc/h/ln for a 20 km/h increase in speed limit.
It is, however, important to note that this research determined significantly lower base saturation flows than the Bester and Meyers (2007) study (suggested base saturation flow rates of 2 076 pc/h/ln for a speed limit of 60 km/h and 2 246 pc/h/ln for a speed limit of 80 km/h). The sample size for intersection approaches with 80 km/h speed limit is limited in the Bester and Meyers (2007) study, with only three approaches considered, only one of which displayed a saturation flow of greater than 2 076 pc/h/ln (suggested for 60 km/h zones).
Summary of results
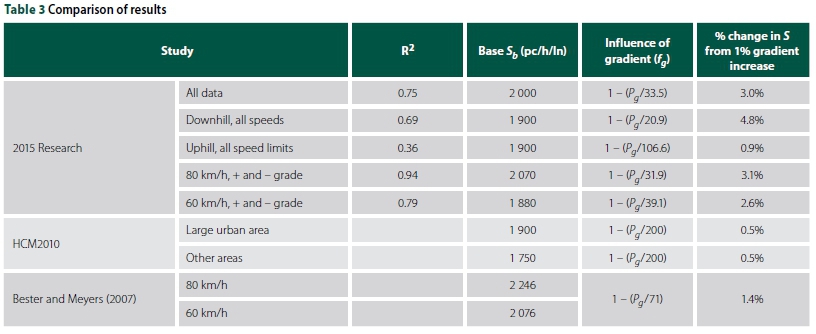
The results of this research (denoted 2015) are summarised in Table 3. Results are provided for all data grouped together, as well as data differentiated by positive and negative approaches and speed limit zones. Table 3 also compares base saturation flow rate (Sb) results obtained from the HCM2010, and the Bester and Meyers (2007) South African study.
Firstly, saturation flows observed in Stellenbosch in 2015 are closer to that proposed by the HCM2010 for large urban areas (defined to have a population of more than 250 000 people). Stellenbosch is a relatively small town. The population of Stellenbosch Local Municipality (including Stellenbosch, Franschhoek and Pniel) reported in 2016 was 173 419 (Statistics South Africa 2016). The definition in the HCM2010 of large urban areas is intended to provide information on commute behaviour, with more rushed, urgent driving behaviour anticipated in larger centres, leading to higher saturation flow than in smaller and non-urban areas. As such, it is important to consider that Stellenbosch experiences very high congestion rates during the morning and afternoon peak commute hours, and so behaviour similar to large urban areas, as defined in the HCM2010, should be expected. Figures 2 and 3 indicate clearly that Stellenbosch exhibits saturation flows well above those defined by smaller population areas in the USA.
Secondly, it is clear that gradient has a greater influence on saturation flow than suggested by the HCM2010, corroborating previous literature that the HCM appears to underestimate the influence of gradient (Bester & Meyers 2007; Iqbal 2009). The separation of positive (uphill) and negative (downhill) gradients reveals that downhill gradients exert a greater effect on saturation flow than uphill gradients, similar to the findings of Agent and Crabtree (1982).
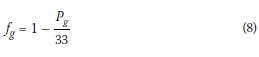
A single adjustment factor is proposed for both positive and negative gradients, according to Equation 10, which results in a 3.0% change in saturation flow per 1% increase in gradient (Pgis negative for downhill approaches, and positive for uphill approaches). This adjustment factor was determined for all data, as well as data separated according to speed limit. The factor proposed by Equation 8 is more conservative for both positive and negative gradients than the factors determined separately according to grade classification. Additionally, results of separated gradients as determined in this study are possibly not as reliable, due to reduced sample size.
Thirdly, separating data according to speed limit reveals that base saturation flow rate is influenced by speed limit, with lower speed limits resulting in lower base saturation flow rate. This is in support of previous literature (Bester & Meyers 2007). Separation of speed limit zones results in reduced variability between actual data and the regression equations. Most of the data in this research was obtained for an 80 km/h speed limit, which results in a regression equation that can account for 94% of the variation in observed data.
CONCLUSIONS AND RECOMMENDATIONS
Saturation flow rate is the maximum traffic flow of vehicles per hour that can be accommodated per approach lane of an intersection, and is used in the design and analysis of signalised intersections and traffic signal phasing plans. The most widely applied method to estimate saturation flow rate is provided by the HCM, developed by the Transportation Research Board. The universally applicable method recommended by HCM2010 to estimate saturation flow rates is accompanied by proposed default values obtained from empirical analysis in the USA, detailing typical USA traffic conditions. This research primarily considered the applicability of the HCM2010 proposed gradient estimation factors on saturation flow rate in the South African context, and commented on base saturation flow rate applicability and the influence of speed limit thereon.
The Highway Capacity Manual significantly underestimates the influence of gradient on saturation flow rate, as shown from the empirically determined results of this research, as well as previous research conducted internationally and in South Africa. A constant influence of gradient, irrespective of the approach being an uphill or downhill slope, is recommended to be 3% change in saturation flow rate per 1% change in gradient. Uphill gradients will decrease saturation flow rate, while downhill gradients will increase saturation flow rate. This influence of gradient is significantly higher than the proposed adjustment factor of the HCM2010, which results in 0.5% change in saturation flow per 1% change in gradient.
HCM methods do not take the influence of speed limit on saturation flow rate into account, which has been shown to affect saturation flow rate in a number of previous studies, and appears to be backed up by the data obtained in this research as well. It is recommended that speed limit be applied in the estimation of saturation flow rate by influencing the selection of the base saturation flow. Further research is required to determine acceptable levels of base saturation flow rate for different speed limit zones in South Africa, as the sample size in this study was not adequate to make recommendations in this regard.
It is recommended that caution be exercised when applying base saturation flow rate values described in the HCM2010 in South African conditions. Particularly, the population size of the town in which the analysis is being conducted should not be an indication alone of base saturation flow rate. Rather, congestion conditions and driver behaviour should be used to differentiate between high- and low-base saturation flow rates. Further research in towns and cities in South Africa that do not experience the high commute volumes experienced in Stellenbosch is required to make further recommendations on this trend.
REFERENCES
Agent, K R & J D Crabtree 1982. Analysis of saturation flow at signalized intersections. Lexington, KY: University of Kentucky, Kentucky Transportation Research Programme. [ Links ]
Akcelik and Associates (Pty) Ltd 2016. Sidra for HCM2010. Available at: http://www.sidrasolutions.com/Resources/SIDRA_HCM2010[accessed on 14 July 2016]. [ Links ]
Allers, S & Stander, H J 1994. Saturation flow rates at signalised intersections in South Africa. Report RR 88/208. Pretoria: Department of Transport. [ Links ]
Bester, C J & Meyers, W L 2007. Saturation flow rates. Proceedings, 26th Southern African Transport Conference (SATC 2007). Pretoria: Document Transformation Technologies, pp 560-568. [ Links ]
Garber, N J & Hoel, L A 2015. Traffic and Highway Engineering, 5th ed. Stamford, CT: Cengage Learning. [ Links ]
Iqbal, M J 2009. Estimation of saturation flow and lost time at selected intersections of Karachi (Pakistan). PhD thesis. Jamshoro, Pakistan: Mehran University of Engineering and Technology. [ Links ]
PTV Group 2016. PTV Products: PTV Vistro. Available at: http://www.vision-traffic.ptvgroup.com/en-us/products/ptv-vistro [accessed on 14 July 2016]. [ Links ]
Statistics South Africa 2016. Community survey 2016: Provinces at a glance. Pretoria: Statistics South Africa. [ Links ]
TRB (Transportation Research Board) 2010. Highway capacity manual. Washington, DC: National Academy of Sciences. [ Links ]
Transport Simulation Systems 2015. New features in Aimsun 8.1. Available at: https://www.aimsun.com/aimsun/new-features[accessed on 14 July 2016]. [ Links ]
 Correspondence:
M M Bruwer
Department of Civil Engineering
Stellenbosch University
Private Bag X1
Matieland 7602
South Africa
T: +27 21 808 4080
E: mbruwer@sun.ac.za
C J Bester
Department of Civil Engineering
Stellenbosch University
Private Bag X1
Matieland 7602
South Africa
T: +2 7 21 80 8 4377
E: cjb4@sun.ac.za
E S Viljoen
Aurecon Group South Africa
264 Main Street
Paarl 7646
South Africa
T: +27 21 860 2213
E: elzaan.viljoen@aurecongroup.com

MEGAN BRUWER, who is an Associate Member of SAICE, joined the Civil Engineering Department of Stellenbosch University as a lecturer in Transportation Engineering in 2015. Megan obtained a BEng in Civil Engineering in 2008 and an MEng in Transportation in 2010. Prior to returning to academics, Megan worked as a consultant engineer primarily involved in public transport systems and road-based traffic engineering. Her research interests include traffic flow theory and the application of ITS to improve data collection for transport planning and traffic management. She is currently completing a PhD in this field.

PROF CHRISTO BESTER, Pr Eng who is a Fellow of SAICE, graduated with a BEng and MEng from Stellenbosch University, and a DEng from the University of Pretoria. After about 20 years with Consulting Engineers and the CSIR he joined Stellenbosch University in 1994 where he lectured and supervised post-graduate students in Transportation and Traffic Engineering until the end of 2017 when he finally retired.

ELIZABETH VILJOEN, Candidate Civil Engineer and Associate Member of SAICE, graduated from the Stellenbosch University in 2015 with a BEng degree in Civil Engineering. Her final-year project focused on traffic engineering and defining the influence ofthe road gradient at an intersection on saturated flow. In February 2016 she joined Aurecon South Africa and is currently based in their Paarl Office focusing on Land Infrastructure. She has designed projects in the field of municipal services and commercial developments, including bulk municipal infrastructure design, stormwater management and construction monitoring.

