


Services on Demand
Article
 English (pdf)
 Article in xml format
 Article references
Indicators

Related links
-
 Cited by Google
 -
 Similars in Google
Share

 Permalink
Journal of the South African Institution of Civil Engineering
On-line version ISSN 2309-8775
Print version ISSN 1021-2019
J. S. Afr. Inst. Civ. Eng. vol.61 n.1 Midrand Mar. 2019
http://dx.doi.org/10.17159/2309-8775/2019/v61n1a2
TECHNICAL PAPER
A research study of the impact testing of stainless steel reinforced concrete piers with different reinforcement ratios
X Zhou; R Zhang; G Zhang; R Xiong
ABSTRACT
In this study, a domestically advanced super-high heavy-hammer impact test machine system was used to perform horizontal impact tests on five 1/5 reduced scale models of stainless steel reinforced concrete piers with different ratios of longitudinal reinforcements. The impact velocity and force of the ship model, displacement of the specimen measurement point, reinforcement strain, cracks, and ultrasonic velocity data during the impact process were collected and analysed. The results showed that, under these test conditions, the increase of reinforcement ratio can improve the lateral impact resistance of reinforced concrete piers to a certain extent.
Keywords: reinforcement ratio, pier, stainless steel, lateral impact, impact property
INTRODUCTION
As the main components which support the vertical loads of bridges, reinforced concrete piers are exposed to the potential risk of ship collisions, and strong lateral impacts could potentially result in significant losses (Larsen 1993; Tongyu & Wu 2003; Zhibin & Qizhi 2007). Due to the known superiority (Huanxin et al 2011) of stainless steel reinforcements from the perspective of strength, ductility, corrosion resistance, maintenance costs, and so on, the main development trend has been to replace ordinary steel bars with stainless steel bars in marine environments in order to resolve durability problems.
In recent years, researchers in China and throughout the world have carried out various studies regarding the effects of impact loading on reinforced concrete structures. Thilakarathna et al (2010) did numerical research on the impact resistance of reinforced concrete axial loading columns under lateral impact loads, and put forward a method suitable for evaluating the impact resistance of columns under the most common impact mode. Remennikov and Kaewunruen (2006) also conducted tests on the impact resistance properties of reinforced concrete columns, and confirmed that the impact resistance of reinforced concrete columns was related to the impact velocity and specimen size. Jianguo et al (2016) studied the dynamic responses and mechanical properties of reinforced concrete structures under strong impact loads, and analysed the shortcomings of the research studies regarding the dynamic characteristics, penetration mechanism, and numerical methods of reinforced concrete under strong impact loads. Haibin et al (2009) studied the failure mode of reinforced concrete columns under impact loads, and obtained a formula for calculating the dynamic responses of two single degree-of-freedom models (bending deformation and direct shear deformation) of reinforced concrete columns undergoing the effects of impact loading. Nan et al (2010) studied the mechanical properties of reinforced concrete columns undergoing the effects of impact loading. The calculation results showed that the load durations and peak values were important factors which determined the failure mode of the structural members. Li and Cong (2013) carried out damage assessments and protection technology research for reinforced concrete columns undergoing the effects of impact loading. The research results indicated that the damages were related to the mass and speed of the impacting objects. Fan and Yuan (2012) examined the dynamic responses of bridge structures undergoing the effects of ship impacts through an impact spectrum analysis, which proved the correctness of the impact spectrum analysis method. Consolazio and Cowan (2003) compared and analysed the influences of pier shapes and sizes on the impact force and pier deformation. Sha and Hao (2012; 2013) obtained the influential effects of the weights and impact velocities of ships on the impact force through testing and numerical simulation. Junjie and Cheng (2007) analysed pier damage status under impact force using a finite element model. The results showed that the peak value of the ship-pier impact force was significantly reduced in the concrete damages. Linfeng and Wenliang (2013), and Hongxuan (2008) examined a calculation method for the impact forces of piers.
Studies regarding the effects of reinforcement ratios on reinforced concrete members have also achieved many results. For example, Tiejun et al (2014) examined the influences of reinforcement ratios on the elasticity modulus of reinforced concrete members through experimental testing processes. Haipeng et al (2010) performed an experimental study on the seismic behaviour of recycled concrete columns, and showed that the bearing capacity, stiffness and energy dissipation capacity of the recycled concrete columns were all improved with increases in the reinforcement ratios. Yu et al (2011) demonstrated through the lateral testing of concrete columns that increases in the ratios of longitudinal reinforcements could improve the lateral bearing capacities of frame columns. Li et al (2013) studied the dynamic responses and failure modes of reinforced concrete columns under the effects of impact loading. The results showed that increases in the ratios of longitudinal reinforcements and stirrups could effectively improve the impact resistance of reinforced concrete columns. Many of the previous studies confirmed that stainless steel materials display good practical performance. The results of the studies on the corrosion resistance of stainless steel reinforced concrete (Schnell & Bergmann 2007; Hartt et al 2006; Bertolini & Pedeferri 2002) have shown that the corrosion resistance of stainless steel reinforced concrete was much higher than that of ordinary reinforced concrete. The results of the tests performed by Yousef et al (2013) and Zhou (2008) indicated that stainless steel had better energy dissipation properties, resistance to fatigue damages, and ductility. Currently research results regarding the impact mechanical properties of stainless steel piers undergoing different reinforcement rates are rarely reported.
In this study, a domestically advanced super-high heavy-hammer impact test machine system was used to perform impact tests on stainless steel reinforced concrete piers under different reinforcement ratios. The influences of the different ratios of longitudinal reinforcements on the impact resistance of stainless steel reinforced concrete piers undergoing the effects of horizontal impact loading were also investigated in this study.
OVERVIEW OF THE EXPERIMENTAL TESTING PROCESS
Specimen design
The specimen for this study's experimental test was a reduced scale model of a pier which had been designed and fabricated to a 1:5 proportion. It was based on the principle of similarity (Min 2014) using the reinforced concrete piers of actual projects as prototypes. By the second theorem of similarity, the main mechanical properties of the pier model can be expressed as:

Where P, W, l, f, I, σ, E are impact, the modulus of bending at the cross section, length of bridge pier, central deflection, cross-sectional moment of inertia, stress and modulus of elasticity respectively.
Therefore, the corresponding π function can be set as follows:

Where α1- α7is the power of the corresponding physical quantity.
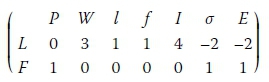
According to the basic dimension of force and length, the corresponding dimension relation matrix is as follows:
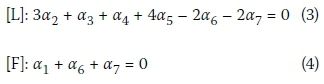
According to the dimensional analysis, it is concluded that:
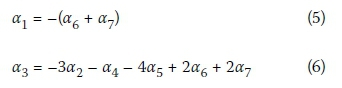
Taking a1, a3 as the basic unknown quantity, we can conclude that:
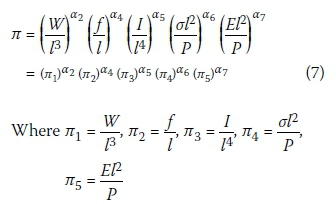
Then the π function is:
The following similarity conditions are determined according to the third theorem of similarity:
Where S is the similarity constant, i.e. the ratio of the model parameters to the actual pier parameters.
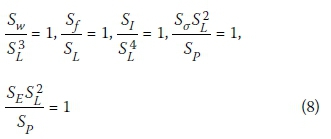
As a result, the similarity constants of this test are as follows:
■ Geometric dimensions: Sl= 1:5
■ Material physical constants and stresses: Se= Sσ = 1
■ Concentrated load: SP= Sl2 = 1:25 (9)
■ The modulus of bending at the cross section: SW= SL3= 1:125
■ Central deflection: Sf = Sl = 1:5
■ Cross-sectional moment of inertia: SI= SL4= 1:625
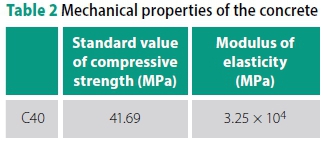
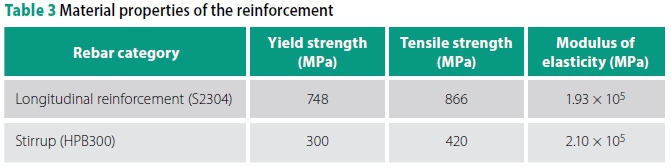
In total, five designed models of stainless steel reinforced concrete cylinder piers with different ratios of longitudinal reinforcements were completed. The design parameters are shown in Table 1. All the columns were made from a single concrete batch. The C40 concrete used in this test was provided by a large commercial concrete company with consistent production quality. In the production of the test piece, 12 cubes (150 mm χ 150 mm χ 150 mm) were made of the same batch of concrete and cured according to the specification standard. The mechanical properties of the concrete were measured with a pressure-testing machine, and the average value is shown in Table 2. A certain length was intercepted from the same batch of steel bar materials, and the corresponding material parameters were measured on the universal testing machine, as shown in Table 3.
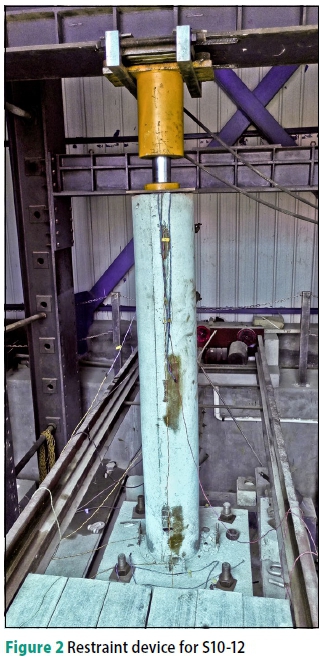
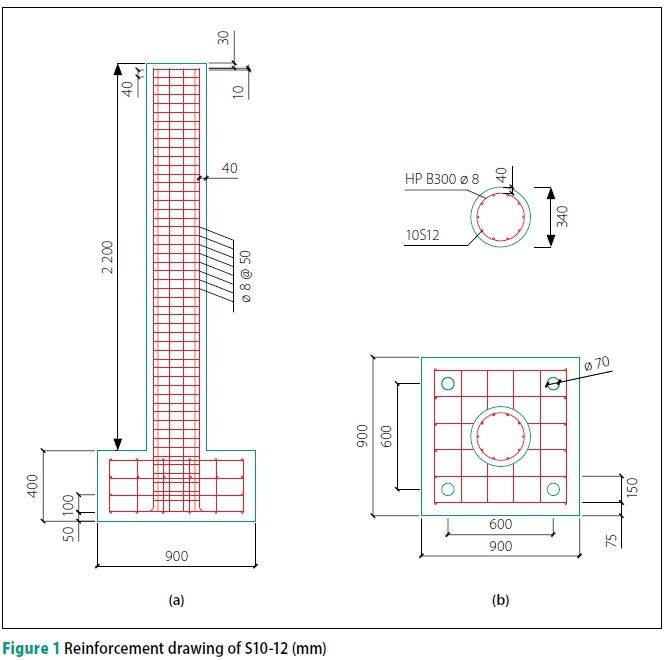
The pier model had a column height of 2 200 mm, and a sectional diameter of 340 mm. The bridge pier model concrete was the same as the actual bridge pier for C40 concrete, and the longitudinal reinforcement was S2304 duplex stainless steel (UGIGRIP1.4362), which was obtained from the UGITECH Co (France). The stirrup used I-grade ordinary steel bars (HPB300) with diameters of 8 mm. The ratio of stirrup reinforcement is the same as that of the actual pier, 1.55%. The longitudinal reinforcements which were used in the pier models adopted symmetri cal reinforcements along the direction of the circular sections, in line with welding construction procedures. In this study, the S10-12 pier model was selected as an example, and the main pier reinforcement is detailed in Figure 1. The bottom of the pier model was fixed with a high-strength bolt, and 250 KN vertical axial pressure was applied to the roof of the specimen.
The axial compression ratio was the same as that of the actual pier 0.15. The axial pressure was provided using a jack with a sliding connection to the reaction frame, as shown in Figure 2.
Test device
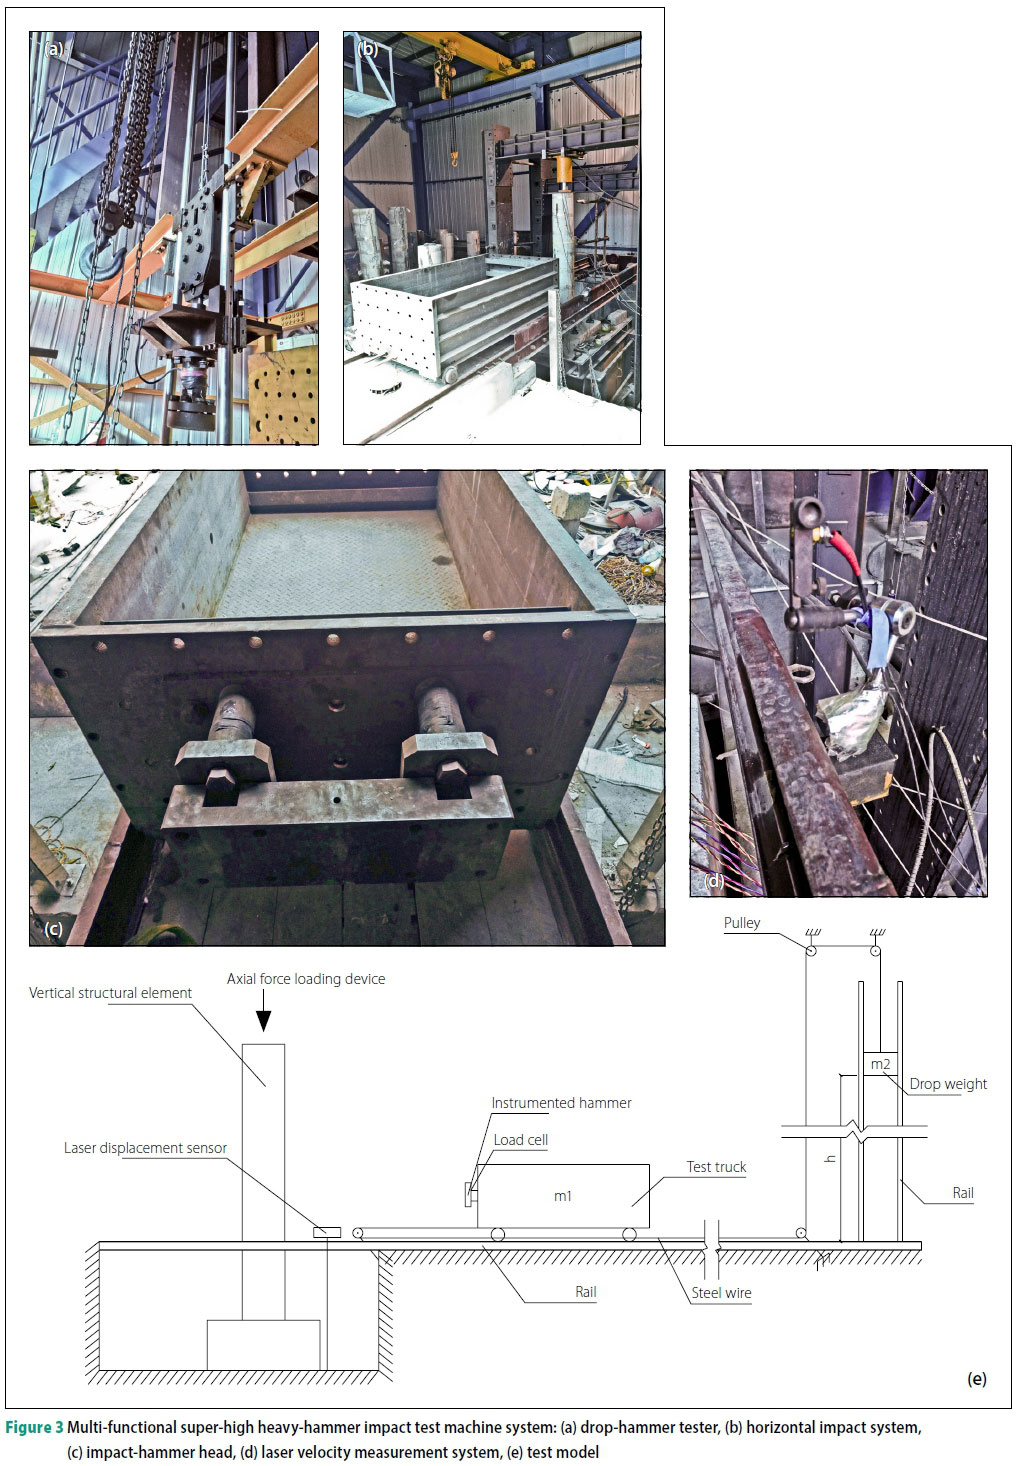
The loading device in this study's testing process was a multi-functional super-high heavy-hammer impact test machine system, as shown in Figure 3. The hammer drop drove the horizontally placed ship model, causing it to horizontally impact with the pier specimen along a fixed track through wire rope. The impact energy for the ship model test was provided by changing the counter weight and lifting height of the drop-hammer, as well as the mass of the ship model. The designed counter weight for the drop-hammer and the ship (impact body) weight were 196 kg and 1 200 kg, respectively.
In this study's experimental testing, a data acquisition instrument obtained from the National Instruments Corporation was used to acquire the data of the velocity, impact force, strain, displacement and damage. The main measurement instruments which were used in this test included a laser velocity measurement system, crack-width measuring instrument, non-metal ultrasonic detector, and high-speed camera. Origin8.5 software was also utilised for processing the acquired data.
Arrangement of the measurement points
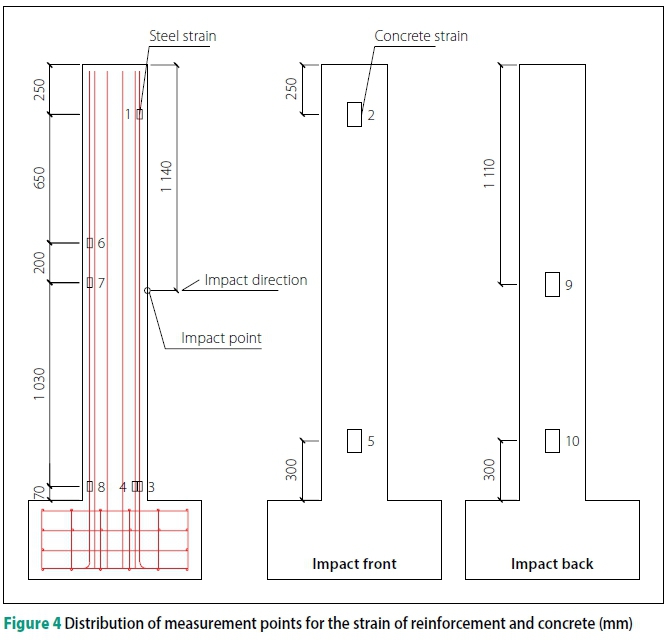
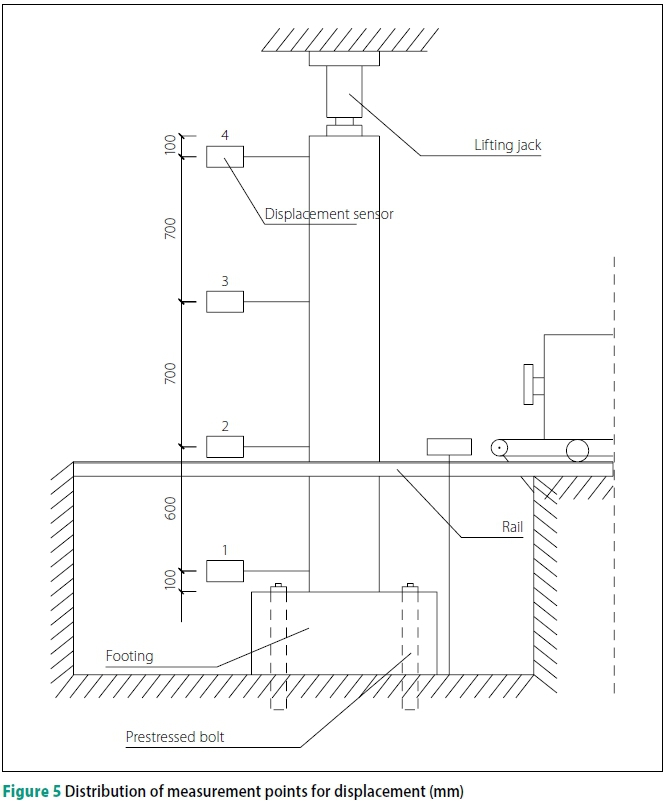
The impact point of the pier model was arranged at a location which was 1 140 mm from the roof of the model. Figures 4 and 5 detail the distribution and numbering of the measurement points for the strain of the reinforcement and concrete, and the displacement of the pier model. A laser velocity measurement system was used at a location close to the impact point in order to acquire the impact velocity of the ship model. Also, two pressure sensors were installed at the impact hammer head position of the ship model for the purpose of measuring the impact force.
Test procedure
After lifting the drop-hammer to heights of 2, 4, 6 and 8 m, respectively, the drophammer released in order to drive the ship model to impact into the pier model. During each of the impacts, measurements and records of the impact velocity of the ship model, impact force, displacement of the measurement points, strain of the reinforcement and concrete at the measurement points, ultrasonic damages to the concrete, and crack development were recorded.
TEST RESULTS AND ANALYSIS
In this research study, a comparative analysis of the impact time history curve, peak value of impact force, as well as the peak value of the roof displacement, peak value of the reinforcement strain at the measurement point, and damage status of the five pier models under the effects of different impact velocities, were completed in detail. Furthermore, an examination of the impact force and dynamic responses of the pier models with different reinforcement ratios under the effects of the same impact energy was conducted.
Impact force, displacement and strain response characteristics
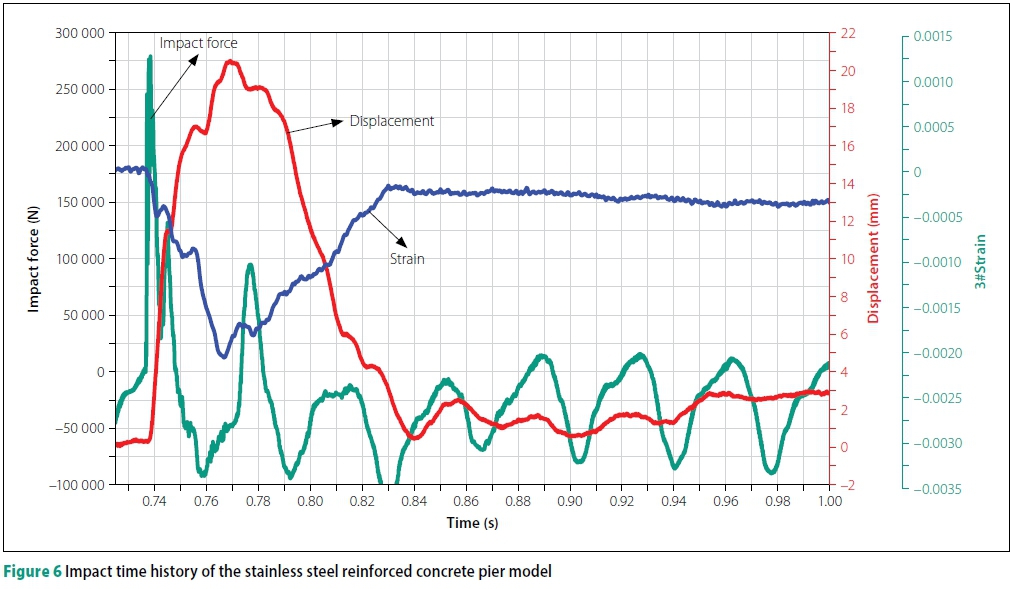
A summary of all of the test results showed that the reinforcement ratio had little influence on the variation trends of the impact force and dynamic responses of the pier model during impact. The impact process was analysed by taking the impact force, column roof displacement, and time history curve of the #3 reinforcement of specimen S6-20, at a drop-hammer height of 8 m, as detailed in Figure 6. Figure 6 shows that the ship model started to come in contact with the pier model at the time of 0.737 seconds. The impact force, displacement and strain responded at almost the same time. The impact force first experienced a pulse peak, and then vibrated.
The vibration peak value gradually decreased and tended to be zero. Finally, the impact force was totally unloaded, and the impact process was very short (about 0.00582 seconds). The displacement and strain did not stop when the impact was completed, and after a short delay (the difference between the peak reaching time of the impact force, and the peak reaching time of the displacement and strain, was 0.03110 seconds) they reached peak values at the same time, and then tended to be horizontal. The deformation recovered with a certain residual deformation. The peak duration was approximately 0.09563 seconds, and the ascending phase of the peak value was observed to be steeper than the descending phase.
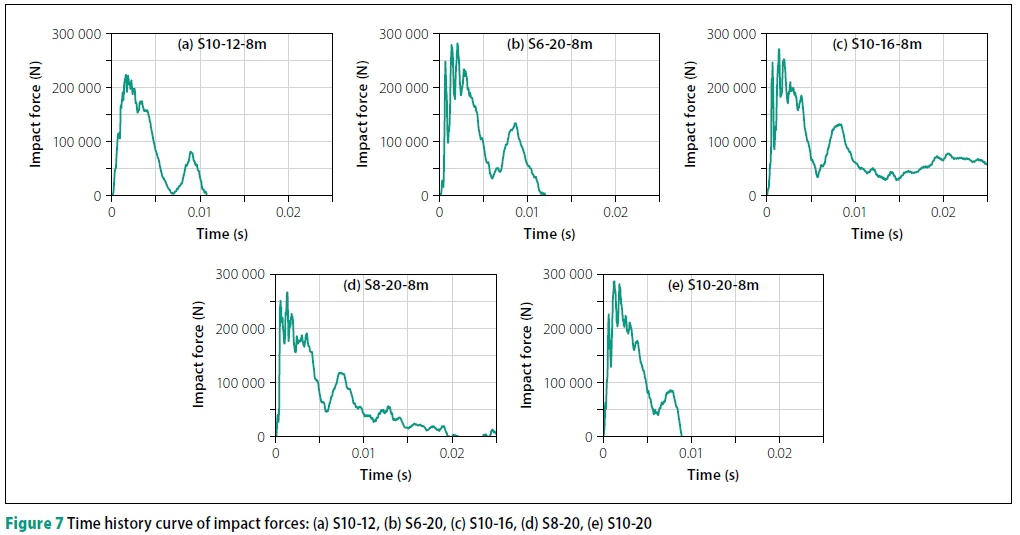
The displacement and strain history curves were relatively simple, that is, rising from the origin to the peak, then decreasing and becoming stable, the impact time history curve was slightly different. The influence of the reinforcement ratios on the impact force is discussed further on in this study. The time history curves of the impact forces of the five specimens under a drop-hammer height of 8 m were selected for comparison purposes, as shown in Figure 7.
As can be seen in Figure 7, the reinforcement ratios had only small effects on the durations of impact forces. The S10-12 specimen had the minimum reinforcement ratio, and the duration of the impact force was observed to be only slightly increased, with an obviously small peak value of the impact force. These findings indicated that the column had low rigidity, with large plastic deformation during the impact process. The time to reach the peak value of the impact force was observed to be reduced with the increases in the reinforcement ratios, which indicated that the increases in the reinforcement ratios improved the rigidity of columns, and reduced the impact times. When the time history curve of the impact force rises and reaches the peak, different degrees of oscillation appear, especially the oscillation degree of specimen S10-12 is weak, which is because the stiffness of S10-12 specimen is insufficient, the damage of S10-12 is large, and the impact energy consumption is larger. The time history curves of S10-16 and S8-20 were different from those of other specimens, indicating that the pressure sensors on the impact hammer were not stable after the impact, and had little influence on the test results.
Reinforcement ratio-impact force response analysis
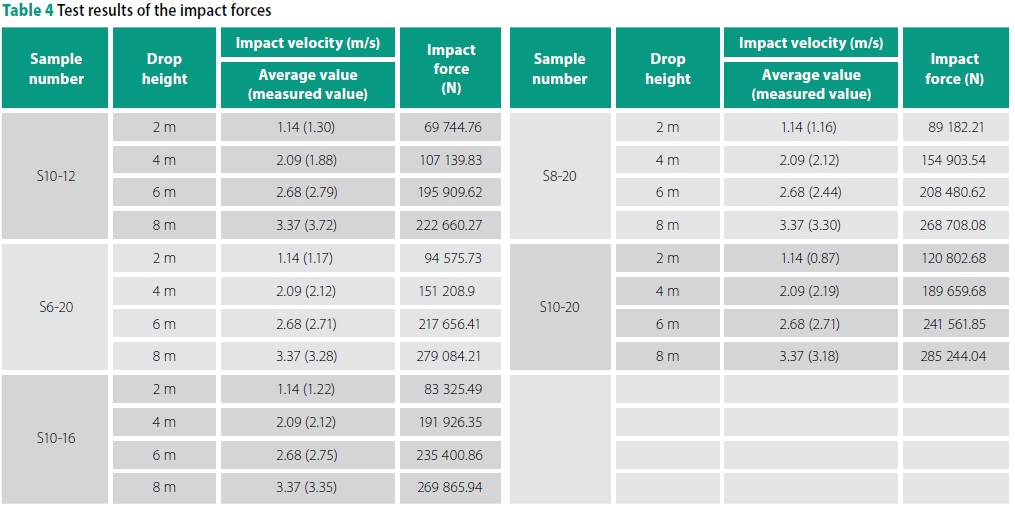
For each impact, the height of the drop weight was recorded, the speed of the boat model hitting the specimen was measured and recorded with the laser velocimetry system, and the peak impact force measured by the pressure sensor was recorded, as shown in Table 4.
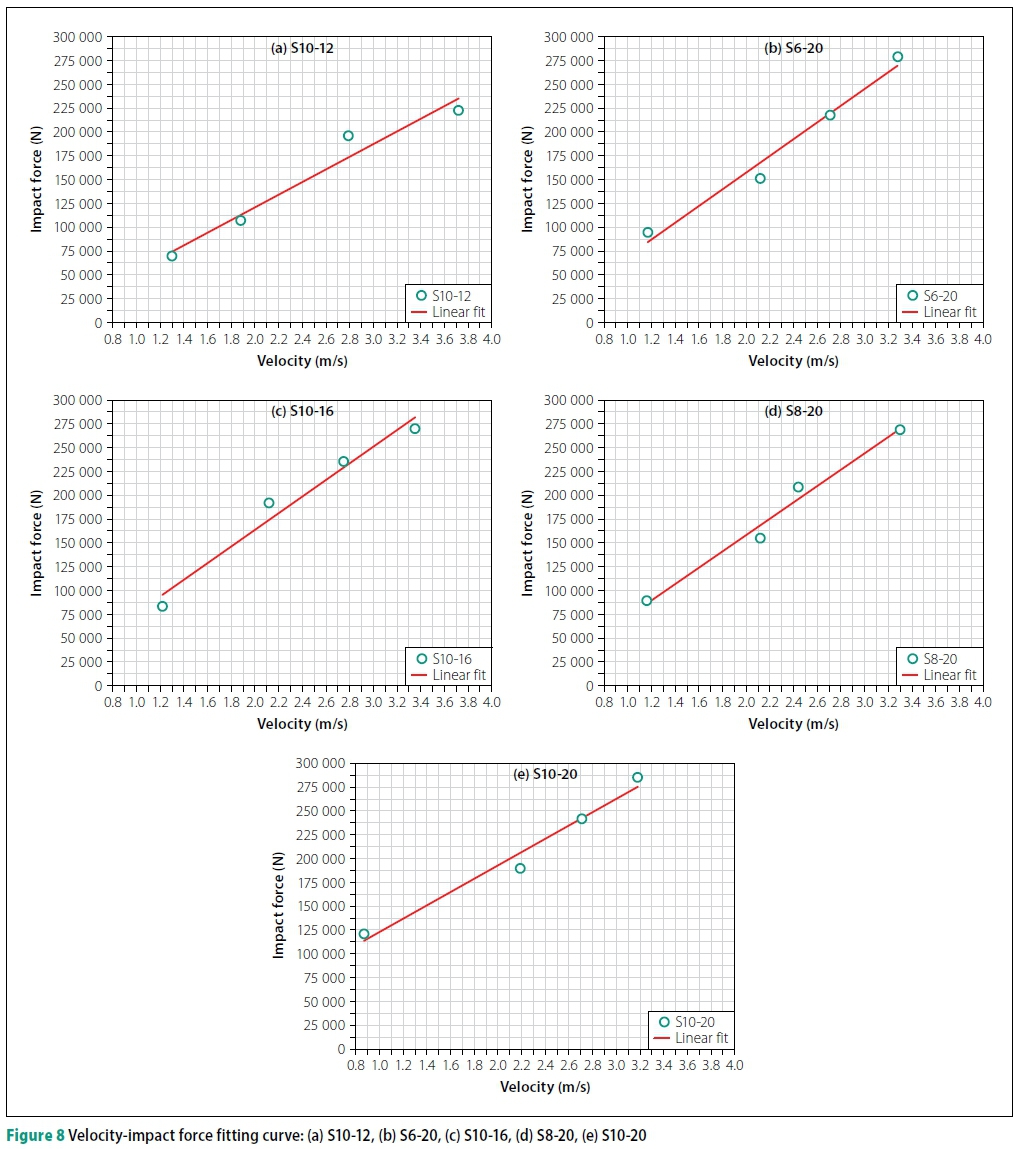
In this study, a fitting process was conducted on the peak values of the impact forces during each impact, with the impact velocities of the five specimens. It was found that the linear fitting was good, and the results are shown in Figure 8.
As can be seen in Figure 8, the peak values of impact forces increased with the growth of the impact velocities, and they showed an approximately positive linear correlation. The different reinforcement ratios were found to have no major influence on the linear correlations between the peak values of impact forces and the impact velocities. After four cumulative impacts, each impact increased the damage to the test piece, reduced the stiffness of the test piece, and the impact force changed accordingly, that is, the cumulative damage of the test piece was different, and the impact force growth rate was different. Therefore, the slope of the velocity-impact force fitting curve indirectly reflected the cumulative damage to the test piece, and the cumulative damage to the test piece with different reinforcement ratios was different (the same as the displacement and strain). The slope of the velocity-impact force fitting curves (ranked as per the increases in the reinforcement ratios) were sequentially 0.53, 0.69, 0.69, 0.368 and 0.56, which indicated that the reinforcement ratios had no major influence on the growth speeds of the peak values of the impact forces.
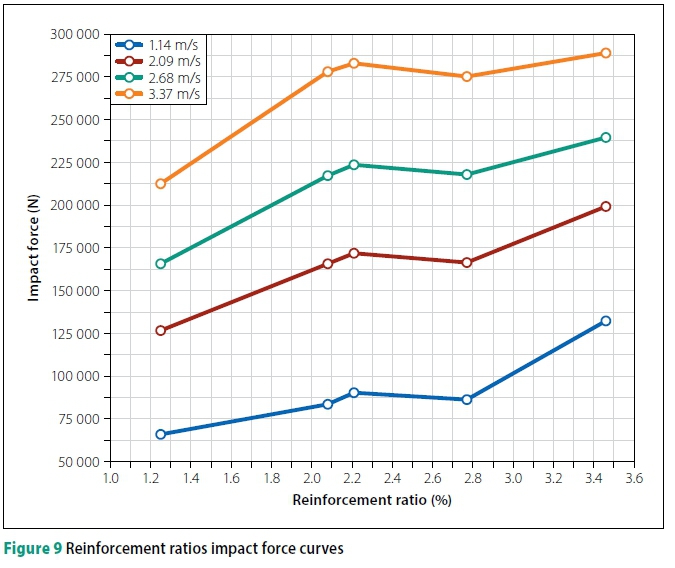
In order to analyse the influence of the reinforcement ratios on the peak values of impact forces under the same velocity, the average velocities (1.14 m/s, 2.09 m/s, 2.68 m/s and 3.37 m/s) of the specimens were used as comparison. The relationship between the peak values of impact forces and the reinforcement ratios is shown in Figure 9.
The peak values of the impact forces were shown to increase with increases in the reinforcement ratios under the same impact velocity, as detailed in Figure 9. When the reinforcement ratio was increased from 1.25% to 2.21%, the peak value of the impact force was increased by 34.70% on average, which indicated a large amplitude of increase. When the reinforcement ratio was increased from 2.21% to 3.46%, the peak value of the impact force was increased by 19.44% on average, which indicated a smaller amplitude of increase. The turning point at which the peak value of the impact forces increased with the increase of the reinforcement ratios occurred at approximately 2.21%. This was an advancement of approximately 0.3% when compared with the maximum impact turning point for ordinary steel reinforced concrete structures, with increases in the reinforcement ratios as described by Mi et al (2017). It was determined in this study that the reinforcement ratios had a relatively larger influence on the impact forces when the reinforcement ratio was large. This is due to the fact that the concrete cracks and the reinforcement played the main roles after multiple impacts, resulting in the reinforcement ratios having more obvious influences on the impact forces. These results confirmed that, under the conditions of this study's testing process, the increases in the reinforcement ratios improved the rigidity of the specimens to a large extent, and increased the impact force. Furthermore, the influences on the rigidity of the specimens after multiple impacts were found to be more significant.
Reinforcement ratio-displacement response analysis
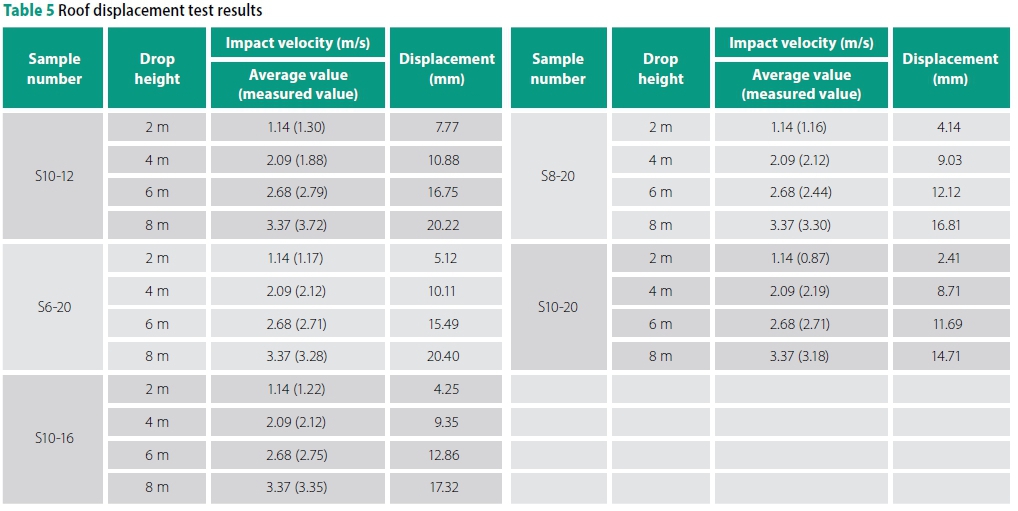
For each impact, the height of the drophammer was recorded, the speed of the boat model hitting the specimen was measured and recorded with the laser velocimetry system, and the maximum displacement measured by the pull rod displacement meter was recorded, as shown in Table 5.
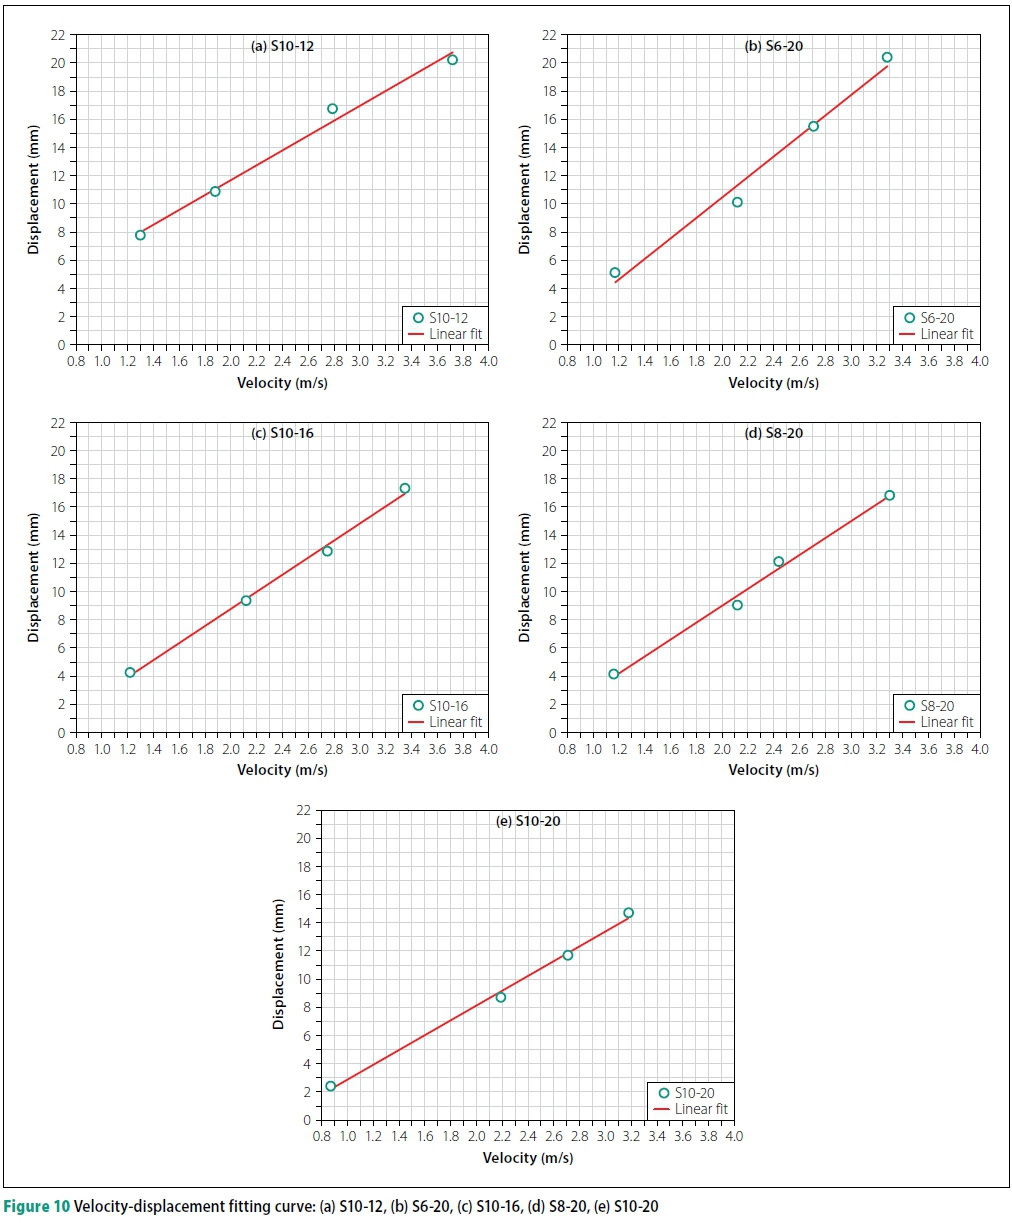
A fitting process was conducted on the peak values of the roof displacements of each impact and the impact velocities of the five specimens. It was determined that the linear fitting was good, with results as shown in Figure 10.
As can be seen in Figure 10, the displacement peak values increased with the growth of the impact velocities, and displayed an approximately positive linear correlation. The reinforcement ratios were determined to have no major influence on the linear correlations between the replacement peak values and the impact velocities. The slopes of the velocity-displacement fitting curves (ranked as per the growth of the reinforcement ratios) were sequentially 0.53, 0.74, 0.61, 0.60 and 0.53, with the exception of the S10-12 specimen with a smaller reinforcement ratio, in which the growth speed of the displacement peak value was observed to decrease with the growth of the reinforcement ratios.
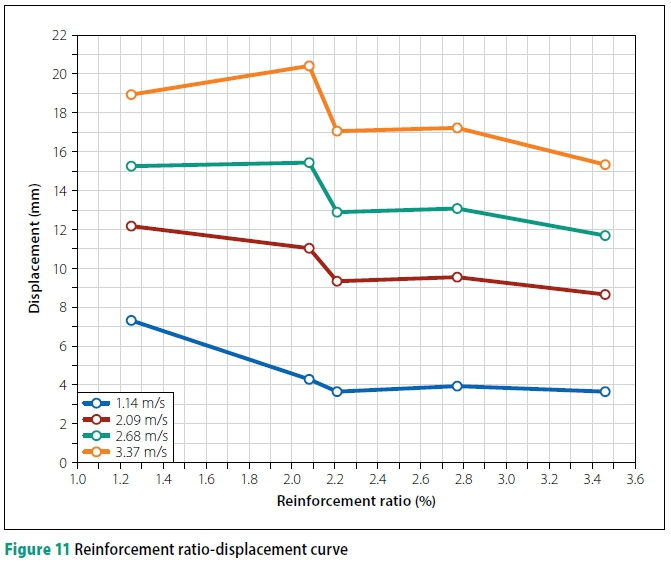
In accordance with the linear relationship of the velocity-displacement, the average speeds (1.14 m/s, 2.09 m/s, 2.68 m/s and 3.37 m/s) of the specimens under the designed drop-hammer height were taken as the comparison speeds. The relationship between the displacement peak values and the reinforcement ratios is shown in Figure 11.
As detailed in Figure 11, the peak values of the roof displacements decreased with the increases in the reinforcement ratios under the same impact velocity. When the reinforcement ratio increased from 1.25% to 2.21%, the peak value of the displacement decreased by 20.13% on average, which indicated a larger amplitude of decrease. However, when the reinforcement ratio increased from 2.21% to 3.46%, the peak value of the displacement decreased by 14.32% on average, which indicated a relatively smaller amplitude of decrease. The turning point in which the displacement peak value increased with the reinforcement ratio was approximately 2.21%. This suggested that the influences of the reinforcement ratios on the displacement peak values were obvious under the same impact velocities.
Reinforcement ratio-strain response analysis
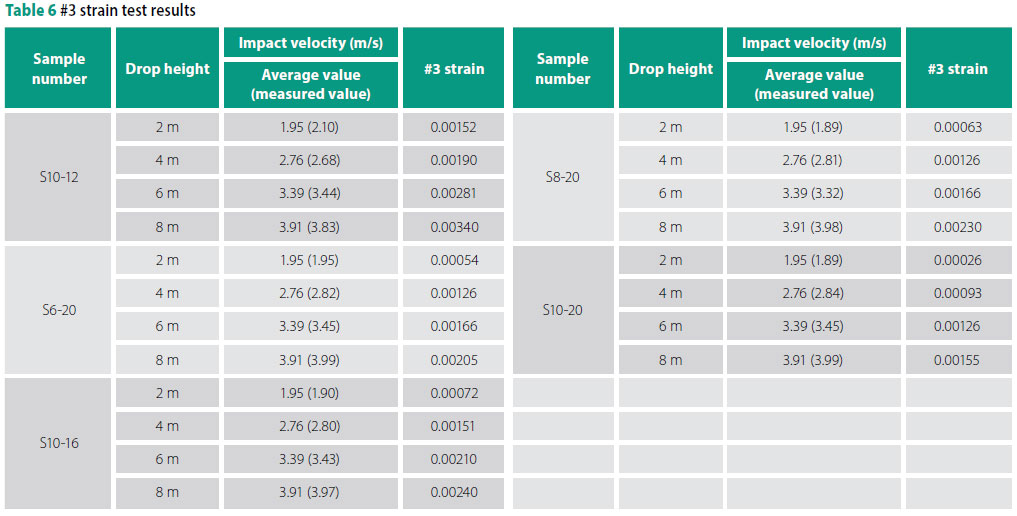
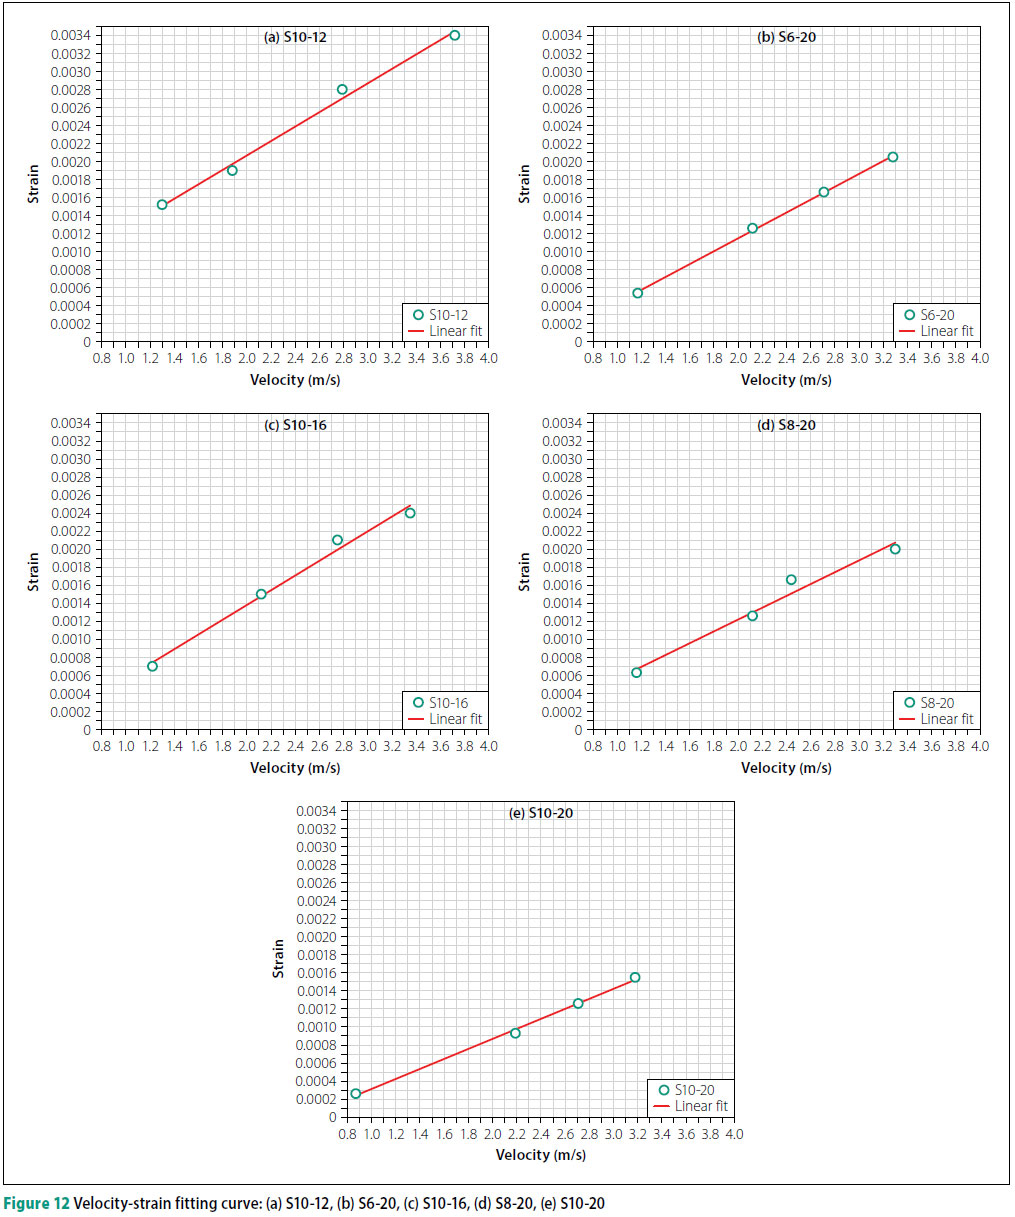
For each impact, the height of the drophammer was recorded, the velocity of the boat model hitting the specimen was measured and recorded with the laser velocimetry system, and the peak value of the steel bar strain measured by the steel bar strain gauge was recorded, as shown in Table 6.
A fitting process was conducted on the #3 reinforcement strains of each impact and impact velocities of the five specimens, and it was determined that the linear fitting was good. The results are shown in Figure 12.
Figure 12 illustrates that the peak values of the strain increased with the growth of the impact velocities, displaying an approximately positive linear correlation. It was observed that the different ratios of the reinforcements had no significant influence on the linear correlations between the peak values of the strain and the impact velocities. The average increase rates (ranked as per the increases in the reinforcement ratios) of the peak values of the strain were 0.61, 0.52, 0.60, 0.48 and 0.41 in sequence.
Also, the growth rates of the strain peak values of the reinforcements decreased with the increases in the reinforcement ratios overall.
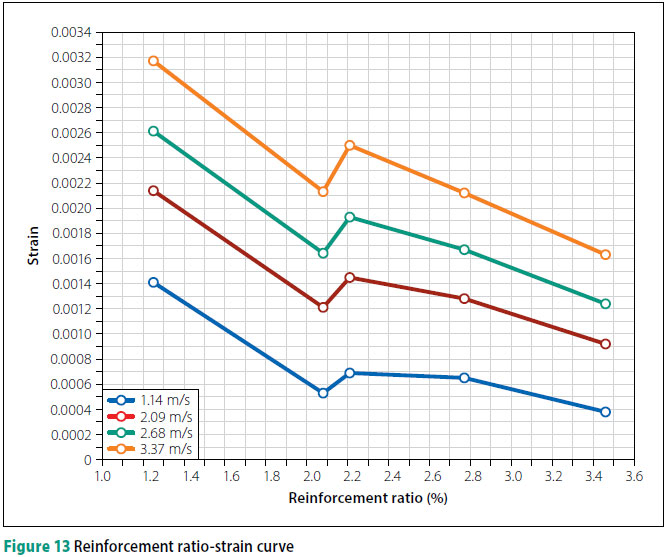
In this research study, in accordance with the linear relationship of the velocity and strain, the average speeds of the five specimens (1.14 m/s, 2.09 m/s, 2.68 m/s and 3.37 m/s, respectively) at the designed drop-hammer height were taken as the comparison speeds. The relationship between the strain peak values and the reinforcement ratios was as shown in Figure 13.
As can be seen in Figure 13, the strain peak values decreased with the increases in the reinforcement ratios under the same impact velocity overall. When the reinforcement ratio was increased from 1.25% to 2.21%, the peak value of the strain was reduced by 39.63% on average, which indicated a larger amplitude of decrease. However, when the reinforcement ratio increased from 2.21% to 3.46%, the peak value of the strain was decreased by 27.40%, which indicated a relatively smaller amplitude of decrease. The turning point in which the strain peak values increased with the increases in the reinforcement ratios occurred at approximately 2.21%. For example, when the reinforcement ratio was increased from 2.08% and 2.21%, the variations of strain fluctuated. This was determined to possibly be due to the different reinforcement methods.
Damage detection and analysis
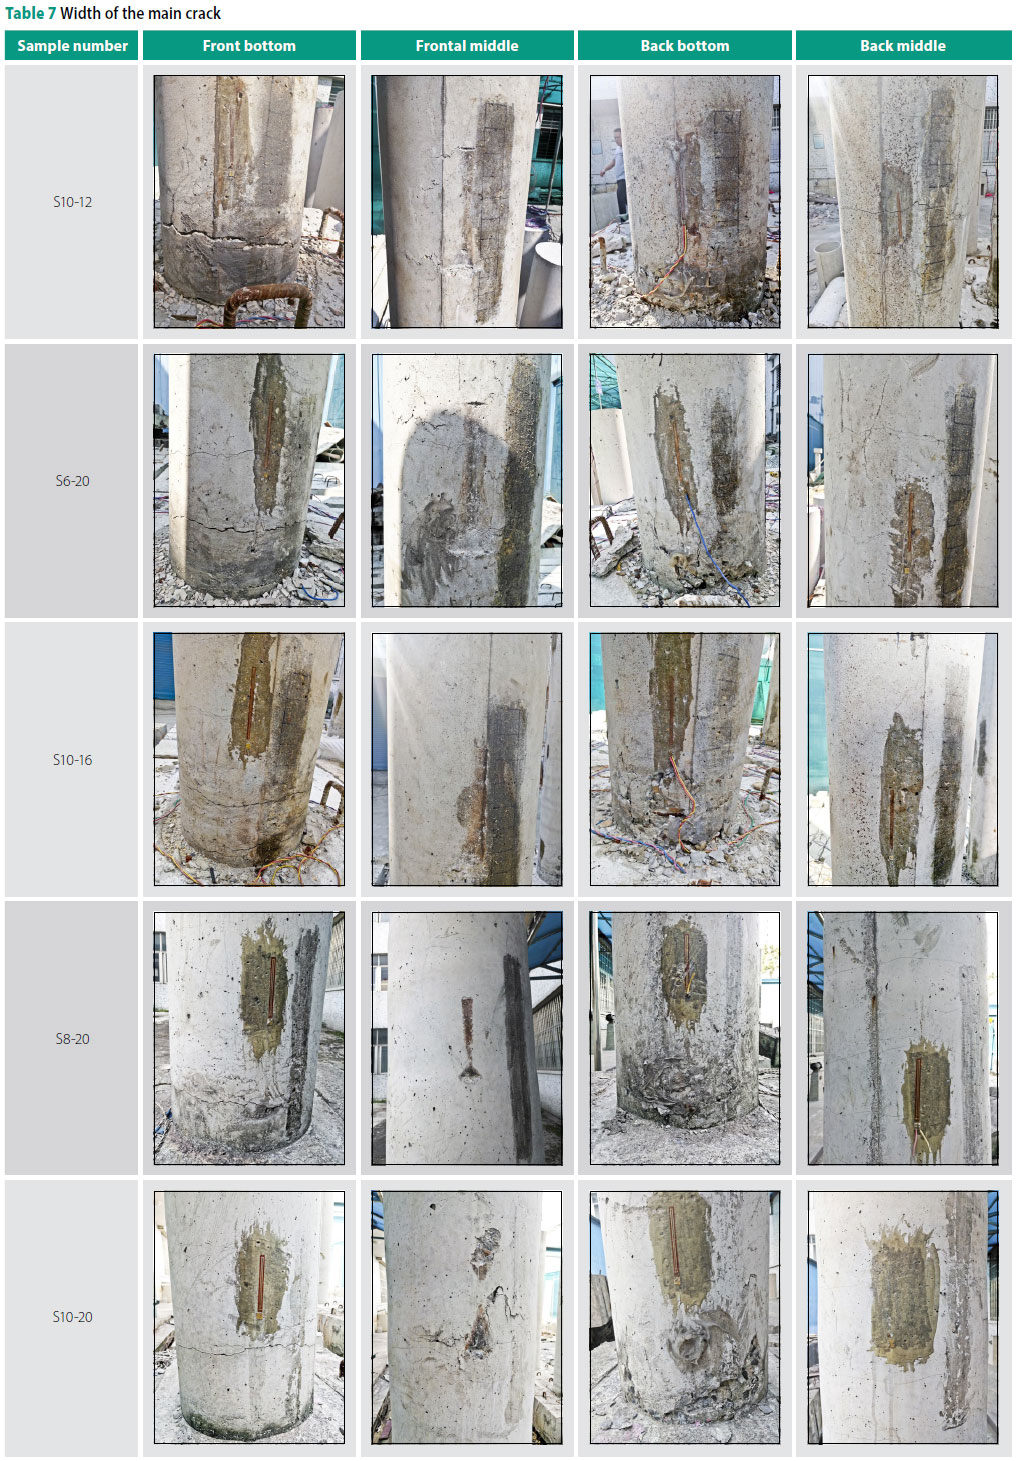
In this study it was observed that the initial crack of each specimen occurred at the bottom area of the impacted surface. The crack developed towards the middle area from the bottom of the impacted surface with the increased impact velocity. Then, the back area of the impact point also began to undergo cracking. It was observed that, with the continuous increases in the impact velocity, the cracks at the back of the impacted area developed towards the middle-upper area, and the increases in the reinforcement ratios had only a smaller influence on the crack development mode. Then, when the impact velocity reached a certain degree, larger cracks occurred at the bottom section of the front impacted surface (approximately 150 mm from the bottom), which became the fixed main crack. It was found that part of the concrete at the bottom of the impacted back area was crushed, and a small part of the concrete at the impact point in the middle of the front impacted surface was also crushed, but without obvious cracks. At this point, a long and thin crack occurred in the middle of the back area of the impacted section. The failure mode of the specimen at the last impact is shown in Table 7.
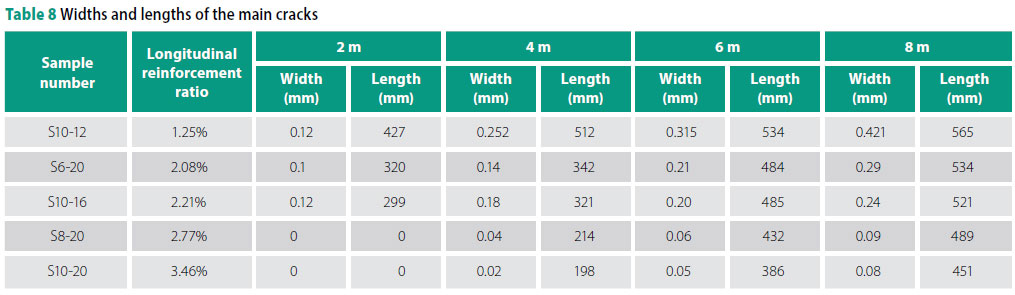
Through the analysis conducted in this study, a certain regularity in the width and length of the main cracks was found, and such regularity could be regarded as the basis by which to evaluate the damage degrees of the specimens. Therefore, the measurements of the widths and lengths of the main crack of each specimen under each impact event were taken, as shown in Table 8.
Table 8 reveals that the widths and lengths of the main cracks of the specimens decreased with increases in the reinforcement ratios under the same impact velocities. These findings confirmed that the reinforcements played the main roles after the tension failures of the concrete had occurred, and the increases in the reinforcement ratios effectively improved the impact resistance performances of the piers.
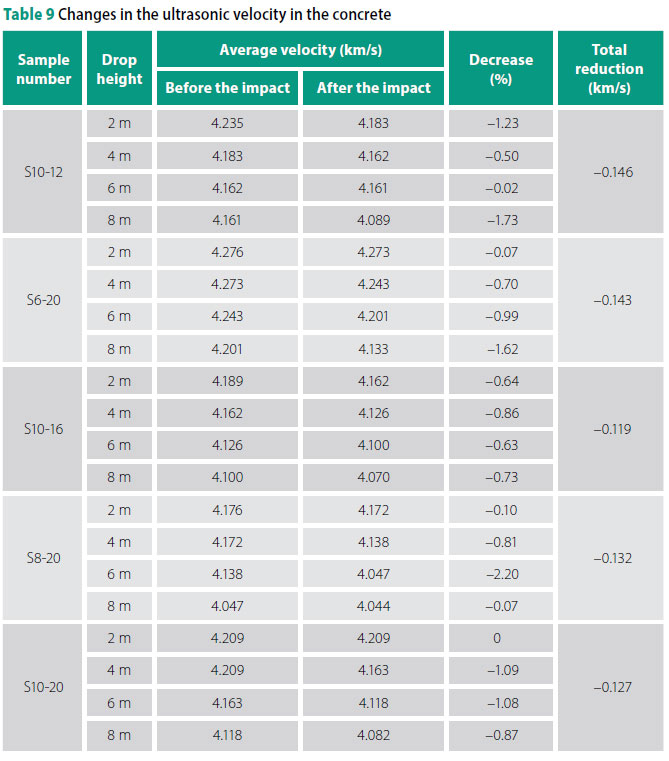
In accordance with conclusions detailed by Yubin et al (2014), the ultrasonic velocity was found to have a high sensitivity to the detections of the impact damages. Therefore, 20 measurement points were chosen from the middle and bottom sections of the specimens, along the height direction. Then an ultrasonic test instrument was used to measure the sound velocity of an ultrasonic wave penetrating through the concrete at each measurement point along the diameter direction. The average value of the 20 measurement points was obtained in order to assess the overall damage status of the specimens, as shown in Table 9.
Table 9 illustrates that the average ultrasonic velocity at the measurement points decreased after each impact event. It can be seen that the specimen had different degrees of damage after each impact. This indicated that the variations in the ultrasonic velocity reflected the damage degrees of the concrete to a certain degree. The total decreases in the ultrasonic velocity after four impact events were used to assess the damage of each of the specimens. Therefore, under the conditions of this study's testing process, it was concluded that the concrete damage was decreased by 12.81% on average when the reinforcement ratio was increased from 1.25% to 3.46%. These findings confirmed that the increases in the reinforcement ratios reduced the concrete damage to a certain extent.
CONCLUSIONS
During this study's examination of the impact forces and dynamic responses of pier models with different reinforcement ratios under the same impact energy, the following main conclusions were reached:
■ Under the same impact energy effect, the time history curve of the impact force, time history curve of the roof displacement, and time history curve of the reinforcement at the bottom of the front impact surface with different reinforcement ratios, displayed consistent variation tendencies.
■ The peak value of the impact force showed an almost linear positive correlation with the impact velocity. For example, when the reinforcement ratio was increased from 1.25% to 2.21%, the peak value of the impact force was increased by 34.70% on average, which indicated a larger amplitude of increase. However, when the reinforcement ratio was increased from 2.21% to 3.46%, the peak value of the impact force was increased by 19.44% on average, which indicated a relatively smaller amplitude of increase. It was determined that the turning point in which the peak values of impact forces increased with the increases in the reinforcement ratios was approximately 2.21%, which was an advancement of approximately 0.3% when compared with ordinary steel bars.
■ The peak value of the roof displacement displayed an almost linear positive correlation with the impact velocity. For example, when the reinforcement ratio was increased from 1.25% to 2.21%, the peak value of the displacement was decreased by 20.13% on average, which indicated a larger amplitude of decrease. However, when the reinforcement ratio was increased from 2.21% to 3.46%, the peak value of the displacement was decreased by 14.32% on average, which indicated a relatively gentle amplitude of decrease. It was determined that the turning point in which the displacement peak values increased with the increases in the reinforcement ratios occurred at approximately 2.21%.
■ The strain of the reinforcement at the bottom of the front impact surface showed an almost linear positive correlation with the impact velocity. When the reinforcement ratio was increased from 1.25% to 2.21%, the peak value of the strain was decreased by 39.63% on average, which indicated a larger amplitude of decrease. However, when the reinforcement ratio was increased from 2.21% to 3.46%, the peak value of the strain was decreased by 27.40% on average, which indicated a relatively gentle amplitude of decrease. In this study, it was observed that the turning point in which the peak values of the strain increased with the increases in the reinforcement ratios occurred at approximately 2.21%.
■ Larger cracks occurred at the bottom of the impact surfaces, and were approximately 150 mm from the bottom. The widths and lengths of main cracks decreased with the increases in the reinforcement ratios. The ultrasonic velocity was shown to effectively reflect the concrete damage status, and higher variations in the sound velocity indicated more extensive damage. The concrete damage decreased with the increases in the reinforcement ratios. When the reinforcement ratios increased from 1.25% to 3.46%, the damage was found to decrease by 12.81% on average. To sum up, the reinforcement ratio of stainless steel pier increases to a certain extent to reduce the lateral displacement, steel strain and damage of the pier under lateral impact load, that is, to improve the impact resistance of the pier. Especially after concrete cracking, the effect is more obvious. On the basis of replacing common steel bar with stainless steel bar to solve the problem of bridge pier corrosion, in order to prevent impact accident, the reinforcement ratio of the bridge pier should be increased in a certain range of reinforcement ratios, especially at the bottom of pier.
ACKNOWLEDGEMENTS
The research described in this paper was sponsored by the Major Project (Natural Science) of the Department of Education of Guangdong Province (2014KZDXM064), the Science and Technology Innovation Project of the Department of Education of Guangdong Province (2013KJCX0188), and the Civil Engineering Technology Research Centre of Guangdong Province.
REFERENCES
Bertolini, L & Pedeferri, P 2002. Laboratory and field experience on the use of stainless steel to improve durability of reinforced concrete. Corrosion Reviews, 20(1-2): 129-152. [ Links ]
Consolazio, G R & Cowan, D R 2003. Nonlinear analysis of barge crush behavior and its relationship to impact resistant bridge design. Computers & Structures, 81(8-11): 547-557. [ Links ]
Fan, W & Yuan, W C 2012. Shock spectrum analysis method for dynamic demand of bridge structures subjected to barge collisions. Oxford, UK: Pergamon Press. [ Links ]
Haibin, C, Jing, G, Nan, G & Junhai, A 2009. Study on the failure mode of reinforced concrete columns under impact load. Journal of Building Structures, 30(S2): 104-108. [ Links ]
Haipeng, Y, Wanlin, C, Yaqi, Z & Jianwei, Z 2010. Experimental study on a seismic behavior of recycled concrete columns with different reinforcement ratios. Technology for Earthquake Disaster Prevention, 5(1): 99-107. [ Links ]
Hartt, W H, Powers, R G & Virmani, Y P 2006. Job site evaluation of corrosion resistant alloys for use as reinforcement in concrete - Innovative bridge construction program. Proceedings, HPC: Build Fast, Build to Last, 2006 Concrete Bridge Conference 5-7 October, Reno NV. [ Links ]
Hongxuan, T 2008. Calculation method and application of pier impact force. Journal of Highway Communication Technology, 2: 110-111. [ Links ]
Huanxin, Y, Yuanqing, W & Yongjiu, S 2011. Preliminary study and application prospect of stainless steel reinforced concrete. Building Science, 27(5): 101-105. [ Links ]
Jianguo, N, Fenghua, Z, Zhihua, W & Tianbao, M 2016. Constitutive relation, failure mechanism and numerical method of reinforced concrete under strong impact load. Scientia Sinica Technologica, 46(4): 323-331. [ Links ]
Junjie, W & Chen, C 2007. Simulation study on the damage of pier under the ship impact effect. Engineering Mechanics, 7: 156-160. [ Links ]
Larsen, O D 1993. Ship collision with bridge. Structural Engineering Document No. 4. Zurich, Switzerland: International Association for Bridge and Structural Engineering (IABSE). [ Links ]
Li, T & Cong, Z 2013. Damage assessment and protection technology of reinforced concrete columns under impact load. Engineering Mechanics, 30(9): 144-150, 157. [ Links ]
Li, T, Cong, Z, Hao, W & Xinhua, F 2013. Dynamic response and failure mode of reinforced concrete columns under impact loading. Engineering Mechanics, 30(2): 150-155. [ Links ]
Linfeng, X & Wenliang, L 2013. Discussion on calculation method of pier impact force. Science and Technology Innovation Herald, 3: 110. [ Links ]
Mi, Z, Jie, W, Chao, W & Shuanhai, H 2017. Study on the dynamic constitutive model of reinforced concrete under collision load. China Journal of Highway and Transport, 30(4): 59-71. [ Links ]
Min, L 2014. Research on similarity theory of model test. Technological Development of Enterprise, 33(27): 154-156. [ Links ]
Nan, G, Xingguo, W & Youpo, S 2010. Study on the failure mode of reinforced concrete columns under impact load. Building Science, 26(3): 42-46. [ Links ]
Remennikov, A M & Kaewunruen, S 2006. Impact resistance of reinforced concrete columns: Experimental studies and design considerations. Proceedings, 19th Australasian Conference on the Mechanics of Structures and Materials, 29 November - 1 December, Christchurch, New Zealand. Boca Raton FL: CRC Press, pp 817-824. [ Links ]
Schnell, R E & Bergmann, M P 2007. Improving tomorrow's infrastructure: Extending the life of concrete structures with solid stainless steel reinforcing bar. Proceedings, Mahmoud, K M (Ed). 4th New York City Bridge Conference, Innovations in Bridge Engineering Technology, 27-28 August, New York City, pp 204. [ Links ]
Sha, Y & Hao, H 2012. Nonlinear finite element analysis of barge collision with a single bridge pier. Engineering Structures, 41(3): 63-76. [ Links ]
Sha, Y & Hao, H 2013. Laboratory tests and numerical simulations of barge impact on circular reinforced concrete piers. Engineering Structures, 46(1): 593-605. [ Links ]
Thilakarathna, H M I, Thambiratnam, D P, Dhanasekar, M & Perera, N 2010. Numerical simulation of axially loaded concrete columns under transverse impact and vulnerability assessment. International Journal of Impact Engineering, 37(11): 1100-1112. [ Links ]
Tiejun, Q, Ronghuan, X & Yunxing S 2014. Experimental study on the influence of reinforcement ratio on the elastic modulus of reinforced concrete members. Concrete, 9: 113-115, 119. [ Links ]
Tongyu, D, Wu, N 2003. Overview of the vessel bump bridge accident. Communications Science and Technology Heilongjiang, 2: 1-3. [ Links ]
Yousuf, M, Uy, B, Tao, Z, Remennikov, A & Liew, J Y R 2013. Transverse impact resistance of hollow and concrete filled stainless steel columns. Journal of Constructional Steel Research, 82(March): 177-189. [ Links ]
Yu, F, Xingguo, W, Yumin, Z & Youpo, S 2011. Experimental study on the effect of reinforcement ratio on the lateral impact resistance of concrete columns. Industrial Construction, 41(11): 85-88. [ Links ]
Yubin, T, Tao, H, Liu, J, Ruoxi, J & Chunwei, Z 2014. Experimental study on the concrete damage performance under the impact effect. Journal of Building Structures, 35(S1): 58-64. [ Links ]
Zhibin, H & Qizhi, L 2007. Review and prospect of ship-bridge collision force. Journal of Foshan University (Natural Science Edition), 25(5): 35-39. [ Links ]
Zhou, Y 2008. A pilot experimental study on the low cycle fatigue behavior of stainless steel rebars for earthquake engineering applications. New York: State University of New York at Buffalo. [ Links ]
 Correspondence:
X Zhou
School of Transportation and Civil Engineering and Architecture Foshan University Foshan
P.R. China 528000
T: +86 132 2925 7589 E: xiwuzhou@163.com
R Zhang
School of Transportation and Civil Engineering and Architecture Foshan University Foshan
P.R. China 528000
T: +86 130 0675 6502 E: 1097855010@qq.com
G Zhang
School of Transportation and Civil Engineering and Architecture Foshan University Foshan
P.R. China 528000
T: +86 137 0291 5953 E: zhanggx@hotmail.com
R Xiong
School of Architecture and Civil Engineering Xingyang Normal University Xingyang
P.R. China 464000
T: +86 136 0760 9638 E: xrshxytc@163.com

ASSOCIATE PROFESSOR XIWU ZHOU studies the impact properties of concrete materials and structures.

RUNCHENG ZHANG is a Master's Degree Candidate studying the impact resistance of bridge piers.

PROFESSOR GUOXUE ZHANG is mainly engaged in stainless steel reinforced concrete structure theory and application research.

ASSOCIATE PROFESSOR RUISHENG XIONG is engaged in structural engineering and civil engineering materials research.

