


Services on Demand
Article
 English (pdf)
 Article in xml format
 Article references
Indicators

Related links
-
 Cited by Google
 -
 Similars in Google
Share

 Permalink
Journal of the South African Institution of Civil Engineering
On-line version ISSN 2309-8775
Print version ISSN 1021-2019
J. S. Afr. Inst. Civ. Eng. vol.60 n.4 Midrand Dec. 2018
http://dx.doi.org/10.17159/2309-8775/2018/v60n4a5
TECHNICAL PAPER
Effect of chlorine and chloramine disinfection and the presence of phosphorous and nitrogen on biofilm growth in dead zones on PVC pipes in drinking water systems
U Kadwa; M V Kumarasamy; D Stretch
ABSTRACT
In drinking water systems, 'dead zones' may have higher biofilm counts than areas of higher flow rates, as there are limited/no shear stresses removing biofilms from the pipe material, and disinfectant concentrations are significantly lower due to no/low supply of disinfected water from the reservoir. Biofilms affect the quality of drinking water and may lead to severe health issues for downstream consumers. Biofilms can be controlled by disinfection, two common disinfectants being chlorine and monochloramine. The growth of biofilms is also affected by the presence of nutrients, as nutrients act as a food source to bacteria in the biofilms. To compare the growth of biofilms in 'dead zones' under different disinfectant (chlorine and chloramine) conditions, PVC coupons were placed in stagnant distilled disinfected waters inoculated with 10% pond water (environmental source), and the biofilm growth was monitored on the coupons using visual analyses. Chloramine has a better disinfectant inhibiting potential than chlorine. To compare the influence of nutrients on biofilms in 'dead zones', coupons were placed in distilled water inoculated with pond water from the same environmental source, and nitrogen and phosphorous concentrations were monitored. It was found that for 'dead zones' in drinking water networks, chloramine has a better biofilm inhibiting and inactivation potential, and the presence of nitrates in water influence biofilm growth, and to a lesser extent so does phosphorous.
Keywords: biofilm, drinking water, water quality, nutrients, disinfectant
INTRODUCTION
Biofilms are an encumbrance to drinking water systems, since they increase the pipe roughness (Babcock & Walton 2008) and lead to deterioration of the quality of water (Kerr et al (2003). Biofilms may contain pathogenic micro-organisms which, if not removed by disinfection, may reach end users and may cause outbreaks of disease within a community (Simoes & Simoes 2013). The most identified disease associated with waterborne outbreaks in developed countries is gastroenteritis (Simoes & Simoes 2013). The health effects vary in severity and can range from mild gastroenteritis to severe (and sometimes fatal) diarrhoea, dysentery, hepatitis and typhoid fever (WHO 2011).
In a pipe network, flow conditions range from laminar to turbulent flow, but stagnant (non-flow) conditions may be encountered where the consumption is low, as well as in reservoirs and in buildings (Manuel et al 2007). Research on drinking water biofilms in stagnant biofilms is rare (Manuel et al 2007). Momba and Kaleni (2002) examined the effect of biofilm formation and growth on polyethylene and galvanised steel containers used for water storage by rural communities in South Africa, and found that water stored for longer than 24 hours accumulated biofilms. Manuel et al (2010) found that periods of stagnation promote biofilm growth. Increased residence times in pipe networks increase the biofilm potentials. Lipphaus et al (2014) found that taps opened after periods of inactivity had higher biofilm and bacterial counts. Disinfectant is added to water to inhibit the growth of biofilms. Chlorine and monochloramine are the most commonly used disinfectants in drinking water systems (Momba et al 2002). Monochloramine disinfection occurs when ammonia is added to chlorine.
Although monochloramine is less reactive than chlorine, monochloramine is a more effective disinfectant (Turetgen 2007; Park & Kim 2008; WHO 2000), since it is more persistent and maintains a higher residual disinfectant throughout the network and also penetrates the biofilm more effectively (Pressman et al 2012). However, a potential problem with monochloramine is that ammonia is a by-product of monochloramine decomposition (Dvorak & Skipton 2013). Ammonia is a primary nutrient for biofilm growth and its presence in water will encourage biological growth and bacterial resistance (McVay 2009).
Nutrients present in drinking water also have an influence on the biofilm formation as they are a 'food source' (Conovera & Corner 1968). TOC (total organic carbon) is the controlling nutrient, followed by nitrogen (N) and then phosphorous (P) (Kerr et al 2003). Carbon is present in the water network in humic acids, carbohydrates, carboxylic acids and proteins (LeChevallier et al 1997).
The optimum nutrient condition for biofilm growth is a C:N:P ratio of around 106:10:1 (Zhang & DiGiano 2002). From the ratio, it can be seen that after carbon, nitrogen is the most important nutrient for biofilm growth. Nitrogen is used by microorganisms to build genetic material and amino acid; however, the exact role of nitrogen in bacterial growth is unclear (US EPA 1992). Nitrification is a process whereby ammonia - a reduced form of nitrogen - is oxidised into nitrites and then nitrates. The presence of ammonia and nitrite promotes the growth of nitrifying bacteria (US EPA 1992). The ammonia that is present can react with the free chlorine disinfectant generating chloramines, and reduce the disinfection effectiveness. The pipe material that is used also influences the growth of biofilms (Jang et al 2011; Morvay et al 2011). Biofilms develop more quickly and support a more diverse biofilm population on iron pipe surfaces than PVC plastic pipes, while cement-based pipes have higher biofilm counts than stainless steel pipes (Momba et al 1998).
Compared to other materials, PVC pipes have a smoother surface, and hence biofilm adhesion is more difficult (Kerr et al 2003; Momba et al 1998). Nano- and micro-scale surface roughness enhances biofilm adhesion to substrates during the initial steps of colonisation, as it provides more surface area for cell attachment and reduces the shear force of attached bacterial cells (Lars & Douglas 2011). For this research PVC pipes were chosen, as PVC is the most commonly used pipe in municipal reticulation networks in South Africa (Van Zyl 2014). Furthermore, the biofilm-forming potential for plastic pipes has not been fully investigated yet (Momba et al 2000).
Another challenge with steel pipes is microbiologically induced corrosion (MIC), also known as bio-corrosion. MIC happens when electrochemical processes in the presence of micro-organisms are able to initiate, facilitate or accelerate the corrosion reaction in the pipe material (Usher et al 2014). For this research, visual analyses on pipe coupons were carried out from SEM (scanning electron microscopy) imaging, and the area of biofilm cover on each coupon was computed to compare biofilm growth observed on coupons in different disinfectant regimes (chlorine and monochloramine) and different nutrient conditions (nitrogen and phosphorous).
MATERIALS AND METHODS
The lab experiments for this research were carried out in two parts - Experiment A (that looked at the biofilm-disinfectant relationship) and Experiment B (that looked at the biofilm-nutrient relationship). Plastic coupons 10 mm χ 10 mm were cut from a PVC pipe and placed in a beaker that was then filled with the respective samples of prepared test water.
For Experiment A, the test waters were chlorinated distilled water (initial concentration of 2.4 mg/l Cl2 and monochloraminated distilled water (initial concentration of 2.4 mg/l NH2Cl), and for experiment B, the test water was distilled water with no addition of disinfectant. All tests had 10% of the working volume made up of pond water (from an environmental source). (A pilot test with pure distilled water showed insufficient growth over a 40-day period for any useful analyses.) The tests were carried out over a period of 12 to 14 days, since initial tests on disinfectant decay showed that chloramine (the slower decaying one of the two disinfectants tested) takes approximately 11 days to decay to below detectable limits (below 0.05 mg/l), after which time the behaviour of the biofilms could be observed. Beakers were sealed off and covered in aluminium foil to prevent interaction with the atmosphere and UV light entering.
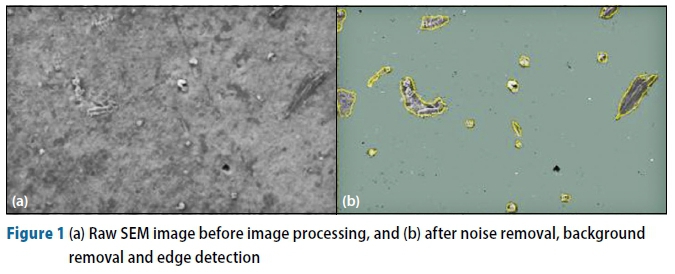
The growths of biofilms were monitored by SEM. At the given times, coupons were removed from the test waters and prepared for SEM imaging. Six pictures of each coupon were taken at a 400x zoom level. The images obtained were analysed using ImageJ software. The biofilm growth was quantified by image-processing techniques where biofilm growth present on the coupon substrate was traced out and the area coverage of biofilm was calculated. By use of software, each SEM image was processed by noise removal, background removal and then edge detection. Figure 1 shows an example of how images were processed and biofilms were outlined to calculate the biofilm area covered.
A VIS (visible light) spectrophotometer (Hach DR3900®) was used to determine the concentration of chlorine and chloramine disinfectants (experiment A), and inorganic nitrogen and phosphorous (Experiment B). The method entails that standard test powder pillows are added to a 50 ml sample taken at given times from the test waters. The powder reacts with the disinfectant or the nutrients in the sample. The sample is then placed in the spectrophotometer, and light of a certain wavelength is passed through the sample. The spectrophotometer measures how much light has been absorbed by the sample and calculates the concentrations based on light absorption.
The concentrations of nutrients and disinfectants were taken four times from each sample at the chosen times. At times less than four values were shown (see Figure 1). This is due to the closeness of the concentrations, hence symbols representing values may be overlapping or 'on top' of one another.
RESULTS AND DISCUSSION
Experiment A
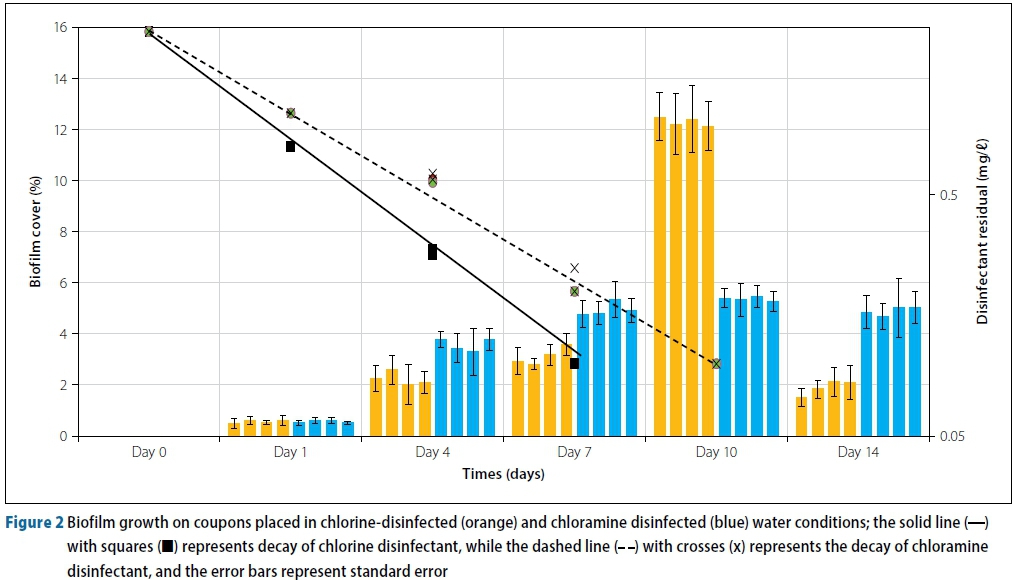
The chlorine and monochloramine concentrations were both 2.4 mg/l at the start of the experiment. As can be seen in Figure 2, in line with other published research, there is a first-order decay relationship between chlorine disinfectant and time, and monochloramine disinfectant and time (Chambers et al 1995; Hua et al 1999). The concentration of disinfectant at time t is represented mathematically in Equation 1.

where λ is the decay constant.
From Figure 2, the decay constant λ for chlorine and chloramine is 0.711 and 0.556 respectively. Chlorine reached to below detectable limits (0.05 mg/l) much sooner (7 days) compared to chloramine (11 days). The decay constant λ of chloramine is 78% of the λ of chlorine, showing that chloramine is a significantly more stable disinfectant. The stability of chloramine over chlorine has also been observed by other researchers (Turetgen 2007; Park & Kim 2008).
From Figure 2 it can be seen that the difference in biofilm inhibition between chlorine and monochloramine is not significantly different over the first seven days. At Day 1 there is no difference in the biofilm cover between chlorine and monochloramine (both at around 1% cover). At Day 4 there is an average cover of 2% on the chlorine coupons, whilst there is a 3.5% cover on the monochloramine coupons. At Day 7 the difference in biofilm coupons becomes slightly more visible, with chlorine coupons having an average biofilm cover of 3% while monochloramine coupons have an average biofilm cover of 5%. The biofilm covers observed are not a representation of actual effectiveness of the disinfectants at constant residuals, as the disinfectant concentrations were allowed to decay. The reasons for allowing the disinfectants to decay are:
■ To compare the decay kinetics and stability of both disinfectants.
■ To simulate conditions similar to that of a 'dead zone' in a pipe network (such as a tank/reservoir or pipes where stagnation occurs).
The most significant difference in biofilm growth occurred on Day 10. After the depletion of chlorine on Day 7, the biofilm cover on chlorine coupons reached an average of 12%. At a very low concentration of monochloramine coupons, the average biofilm cover present had not changed significantly since Day 7, going up from 5% on Day 7 to 6% on Day 10. The choice of disinfectants has an effect on 'dead zones' with respect to the biofilm formation, but the difference is not substantial.
On Day 10, the biofilm cover on chlorine coupons 'spiked' due to the chlorine being below detection limits (below 0.05 mg/l). However, after the monochloramine reached very low levels (on Day 10 and later), the biofilm cover on coupons did not 'spike', but rather remained constant. Monochloramine is a better disinfectant at penetrating and inactivating the biofilm present, as also found by other authors (LeChevallier et al 1990; LeChevallier et al 1991). Due to it being more stable and less reactive than chlorine, monochloramine can diffuse into the biofilm and eventually inactivate attached bacteria (Coniglio et al 2015). Free chlorine is consumed before it has a chance to react with the bacterial components of the biofilm (Chen & Stewart 1996). Momba et al (2002) have suggested using a dual chlorine-monochloramine system for effective limitation of biofilm to combine the effects of a quick-reacting chlorine disinfectant with a more persistent, penetrating and stable chloramine disinfectant.
There is a 'crash' in the biofilm cover on chlorine coupons after Day 10. This is due to the large population of cells in the biofilm matrix consuming the available nutrients, thereby leading to a shortage of nutrients that act as a 'food source' to the bacterial cells. In the closed environment, and with limited nutrient availability, the biofilm cover 'crashes.' This leads to the dead cells being decomposed and releasing ammonia, which acts as a food source and hence causes an increase in the biofilm cover present (Baibeau 2011).
Experiment B
The nitrogen cycle observed for Experiment B is shown in Figure 3. Ammonia is oxidised into nitrites and then further oxidised into nitrates. Experiment A showed that monochloramine is a more stable disinfectant than chlorine. However, when monochloramine decomposes, ammonia is a by-product (Dvorak & Skipton 2013). As monochloramine acts as a source of ammonia, the ammonia will ultimately be converted to nitrates that will promote biofilm growth, thus limiting its effectiveness as a disinfectant (Pressman et al 2012).
There is a correlation between nitrate concentrations and biofilm growth. Figure 3 shows that nitrates support and promote biofilm growth. From Day 0 to Day 9 the biofilm cover increased from 0% to an average of 13%, peaking on Day 9. After Day 9 the biofilm cover decreased sharply. The peak biofilm cover on the pipe coupons occurred simultaneously with the peak nitrate concentrations in the test water. The peak nitrate concentration on Day 9 was 3.22 mg/l, coinciding with the peak biofilm cover of 13%. After the 'crash' in the biofilms, there was also a 'crash' in the nitrate concentrations in the test water. From Day 9 to Day 12 the biofilm cover average fell from 13% to 3.9%, while the nitrate concentrations fell from 3.22 mg/l on Day 9 to 0.7 mg/l on Day 12. Other researchers have also shown similar relationships between bacteria and nitrate (Feitag et al 1987; Chu et al 2005).
The biofilms on the substrate and the nutrients present are co-dependent. Higher levels of nutrients stimulate more biofilm growth, while greater biofilms and bacteria present release more ammonia through respiration and excretion (Conovera & Corner 1968) and will ultimately act as a 'food source' for bacteria and biofilms. After the peak on Day 9, the large percentage of biofilm cover meant that the nutrients present were unable to provide 'food' for all the micro-organisms present and that a very large portion of the nitrates present had been depleted by the large population of biofilms. This led to the dying off or 'crash' of biofilms due to there being insufficient nutrients. Dead biofilms lose their adhesive properties and are detached from the coupon substrate (Winstanley et al 2010).
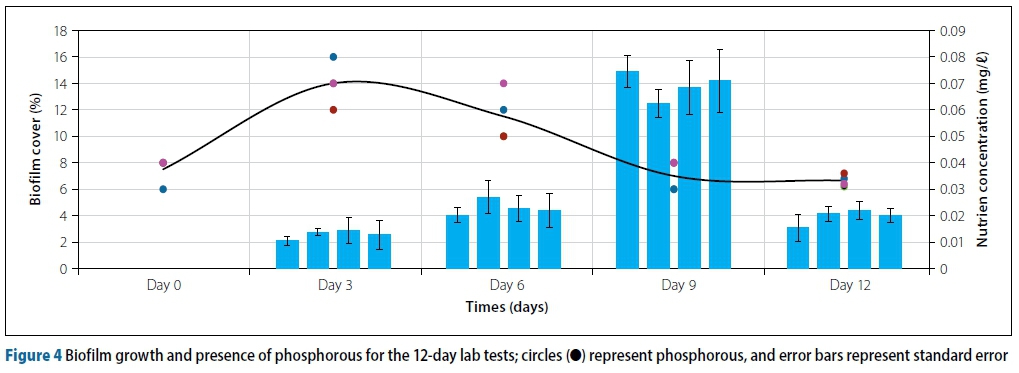
Many researchers have demonstrated the importance of phosphorous for bacterial growth (Lehtola et al 2001; Smith & Prairie 2004). Figure 4 shows the relationships between biofilm growth and phosphate concentrations. As shown in Figure 4, the phosphate concentrations are really low and are almost constant in relation to inorganic nitrogen components.
However, it can be seen that, as the biofilm covers increased between Day 6 and Day 9, the phosphorous levels decreased from 0.06 mg/l to 0.03 mg/l, showing that biofilms also use phosphorous as a 'food' source. After carbon and nitrogen, phosphorous is the most important nutrient for biofilm growth (LeChevallier et al 1991).
Comparison between
Experiment A and Experiment B
Using Experiment B as a control, it was observed that the trend for biofilm growth in the control (no disinfectant) and chlorine is similar. Both show an increase in biofilm cover from the Day 0 until there is a peak biofilm cover, followed by a biofilm 'crash.' However, the rate at which the biofilms grew were different. From Day 0 to Day 6, the average biofilm cover on Experiment B coupons grew from 0% cover to 4.6% cover. From Day 0 to Day 7, the average biofilm cover on chlorine coupons from Experiment A grew from 0% cover to 13% cover. This shows the effectiveness of chlorine in the short term (7 days) when compared to the biofilm cover observed in Experiment B.
The peak on both the chlorine coupons from Experiment A and the coupons from Experiment B were very similar (13% -14.5%). This shows that the 'carrying capacity' of the water samples was 13% -14.5%. Beyond this, the nutrients were used up, and this led to a 'crash' in the biofilm cover present. The trend observed in the monochloramine coupon was significantly different to the Experiment B coupons and the chlorine coupons. On the monochloramine coupons, the biofilm cover increased continuously from Day 0 to Day 7. Over the seven-day period, biofilm cover grew from 0.0% to 5%. From Day 7 onwards to Day 12, the biofilm cover remained at around 7%, even though the chloramine disinfectant had decayed and was below detection limits (below 0.05 mg/l). This shows the effectiveness of the persistence and inactivation potential of monochloramine when compared to the biofilm cover observed in Experiment B. Also, at low residuals, chlorine has a much diminished effect on the biofilm growth, as the trend observed with biofilm growth on chlorine disinfectant was very similar to Experiment B (control) where nitrates were the driving force of biofilm. Visually, both Experiment A and Experiment B had very similar biofilm structures. Both had a gel-like EPS which adhered to the pipe coupons.
CONCLUSION AND RECOMMENDATIONS
For 'dead zones' in pipe networks, chlorine is slightly better at inhibiting biofilm formation in the short term (Day 0 to Day 7); however, monochloramine is a more persistent disinfectant and is better able to penetrate bacteria present in the water. Chloramine's ability to penetrate and inactivate biofilm over a longer period of time means that monochloramine has a better biofilm-inhibiting ability. Because of chloramine's inactivation and penetrating ability, even after chloramine has been completely decayed, lower biofilm covers will be observed, compared to chlorine. For 'dead zones' in water networks, the risk of complete disinfectant decay is much higher than in zones which experience continuous flow. For future research, a combined chlorine-monochloramine disinfection could be set up to see the combined effect of a fast-reacting chlorine disinfectant and a more stable persistent monochloramine disinfectant..
Statistical analysis showed that there was a strong relationship between the nitrates and the biofilm, hence affirming the fact that nitrogen is a primary nutrient. Also, it was found that there was a carrying capacity of the closed system, beyond which biofilm populations present 'crashed'.
Biofilms should be identified through methods that are currently being used in biology/microbiology, such as DNA extraction and analysis, to see if there are different strains that grow under different disinfectant conditions. Other physicochemical factors that contribute to biofilm growth, such as biological oxygen demand (BOD), chemical oxygen demand (COD), etc, should be investigated as well.
Together with SEM, atomic force microscopy (AFM) should be used for biofilm analysis to provide a roughness profile of the specimen. Roughness influences the head loss in pipelines, and a roughness profile will be able to provide thicknesses of biofilms, especially when biofilms are 'stacked' on top of one another. Inoculation for the water samples should be done using known cultures, to have as much uniformity as possible, as biological activities in pond water are dynamic and vary according to temperature, UV light, depth and season. The testing should combine disinfectant decay and nutrient concentrations instead of running each experiment individually, as the effects of disinfectant decay, nutrient limitations and biofilm growth do not occur in isolation of one another. The results of this will be able to relate disinfectant decay to nutrient availability. Organic nitrogen should also be monitored during the course of the experiment to relate the biofilm growth to the total nitrogen present and to the total Kjehdahl nitrogen (TKN).
ACKNOWLEDGEMENTS
This work was supported by the Deutscher Akademischer Austausch Dienst (DAAD), the National Research Foundation (NRF), uMgeni Water and WRC South Africa.
REFERENCES
Babcock, R, Walton, R 2008. Understanding the Impact of Biofilm Growth on Pipe Roughness. Paper presented at the World Environmental and Water Resources Congress, American Society of Civil Engineers, 12-16 May, Honolulu, Hawaii. [ Links ]
Baibeau, H 2011. Microbiology and isolation of nitrifying bacteria. Fundamentals and control of nitrification in chloraminated drinking water distribution system. AWWA Manual of Water Supply Practices M56, 69-73. [ Links ]
Chambers, V K, Creasey, J D & Joy, J S 1995. Modeling free and total chlorine decay in potable water distribution-systems. Journal of Water Supply Research and Technology-Aqua, 44(2): 60-69. [ Links ]
Chen, X & Stewart, P S 1996. Chlorine penetration into artificial biofilm is limited by a reaction-diffusion interaction. Environmental Science and Technology, 30(6): 2078-2083. [ Links ]
Chu, C, Lu, C & Lee, C 2005. Effects of inorganic nutrients on the regrowth of heterotrophic bacteria in drinking water distribution systems. Journal of Environmental Management, 74(3): 255-263. [ Links ]
Coniglio, M A, Stefano, M & Mohamed, Y H 2015. Monochloramine for controlling legionella in biofilms. How much we know? Journal of Nature and Science, 1(2): e44. [ Links ]
Conovera, R J & Corner, E D S 1968. Respiration and nitrogen excretion by some marine zooplankton in relation to their life cycles. Journal of the Marine Biological Association of the United Kingdom, 48(1): 49-75. [ Links ]
Dvorak, B I & Skipton, S O 2013. Chloramines water disinfection: Omaha Metropolitan Utilities District and Lincoln Water System. Lincoln, NE: University of Nebraska. [ Links ]
McVay, R D 2009. Chlorine production and monitoring in Florida's water supply systems. Florida Water Resources Journal, 16-26. [ Links ]
Freitag, A, Rudert, M & Bock, E 1987. Growth of nitrobacter by dissimilatoric nitrate reduction. FEMS Microbiology Letters, 48(2): 105-109. [ Links ]
Hua, F, West, J R, Barker, R A & Forster, A C F 1999. Modeling of chlorine decay in municipal water supplies. Water Research, 33(12): 2735-2746. [ Links ]
Jang, H J, Choi, Y J & Ka, J O 2011. Effects of diverse water pipe materials on bacterial communities and water quality in the annular reactor. Journal of Microbiology and Biotechnology, 21(2): 115-123. [ Links ]
Kerr, C J, Osborn, K S, Rickard, A H, Robson, G D & Handley, P S 2003. Biofilms in water distribution systems. In: Mara, D & Horan, N J (Eds). Handbook of Water and Wastewater Microbiology. San Diego, CA: Elsevier, 757-775. [ Links ]
Lars, R D & Douglas, B W 2011. Physiochemical regulation of biofilm formation. MRS Bulletin/ Materials Research Bulletin, 36(5): 347-355. [ Links ]
LeChevallier, M W, Lowry, C D & Lee, R G 1990. Disinfection of biofilms in a model distribution system. Journal of the American Water Works Association, 82(7): 87-99. [ Links ]
LeChevallier, M, Schulz, W & Lee, R G 1991. Bacterial nutrients in drinking water. Applied Environmental Microbiology, 57(3): 857-862. [ Links ]
LeChevallier, M, Schulz, W & Lee, R G 1997. Bacterial nutrients in drinking water. Applied Environmental Microbiology, 57(3): 857-862. [ Links ]
Lehtola, M J, Miettinen, I T, Vartiainen, T & Myllykangas, T 2001. Microbially available organic carbon, phosphorus, and microbial growth in ozonated drinking water. Water Research, 35(7): 1635-1640. [ Links ]
Lipphaus, P, Hammes, F, Kotzsch, S, Green, J, Gillespie, S & Nocker, A 2014. Microbiological tap water profile of a medium-sized building and effect of water stagnation. Environmental Technology, 35(5-8): 620-628. [ Links ]
Manuel, C M, Nunes, O C & Melo, L F 2007. Dynamics of drinking water biofilm in flow/non-flow conditions. Water Research, 41: 551-562. [ Links ]
Manuel, C M, Nunes, O C & Melo, L F 2010. Unsteady state flow and stagnation in distribution systems affect the biological stability of drinking water. Biofouling, 26(2): 129-39. [ Links ]
Momba, M, Cloete, T, Venter, S N & Kfir, R 1998. Evaluation of the impact of disinfection processes on the formation of biofilms in potable surface water distribution systems. Water Science and Technology, 38(8-9): 283-289. [ Links ]
Momba, M, Kfir, R, Venter, S & Cloete, T 2000. An overview of biofilm formation in distribution systems and its impact on the deterioration of water quality. Water SA, 26(1): 59-66. [ Links ]
Momba, M N B & Kaleni, P 2002. Regrowth and survival of indicator microorganisms on the surfaces of household containers used for the storage of drinking water in rural communities of South Africa. Water Research, 36: 3023-3028. [ Links ]
Momba, M, Ndaliso, S, Binda, M & Makala, N 2002. Inhibition of biofilm regrowth in potable water systems. Pretoria: Water Research Commision. [ Links ]
Morvay, A A, Decun, M, Scurtu, M, Sala, C, Morar, A & Sarandan, M 2011. Biofilm formation on materials commonly used in household drinking water systems. Water Science and Technology: Water Supply, 11(2): 252-257. [ Links ]
Park, S K & Kim, Y K 2008. Effect of chlorine concentration on biofilm maintenance on pipe surfaces exposed to nutrient-limited drinking water. Water SA, 34(3): 373-380. [ Links ]
Pressman, J G, Lee, W H, Bishop, P L & Wahman, D G 2012. Effect of free ammonia concentration on monochloramine penetration within a nitrifying biofilm and its effect on activity, viability and recovery. Water Research, 46(3): 882-894. [ Links ]
Simoes, L C & Simoes, M 2013. Biofilms in drinking water: problems and solutions. Royal Society of Chemistry Advances, 3: 2520-2533. [ Links ]
Smith, E M & Prairie, Y T 2004. Bacterial metabolism and growth efficiency in lakes: the importance of phosphorus availability. Limnology and Oceanography, 49(1): 139-147. [ Links ]
Turetgen, I 2007. Comparison of the efficacy of free residual chlorine and monochloramine against biofilms in model and full scale cooling towers. Biofouling, 20(2): 81-85. [ Links ]
US EPA (United States Environmental Protection Agency) 1992. Control of biofilm growth in drinking water distribution systems. Report No EPA/625/R-92/001. Washington, DC: Office of Research and Development. [ Links ]
Usher, K M, Kaksonena, A H, Cole, I & Marney, D 2014. Critical review: microbially influenced corrosion of buried carban steel pipes. International Biodeterioration and Biodegradation, 93: 84-106. [ Links ]
Van Zyl, J E 2014. Introduction to operation and maintenance of water distribution systems. WRC Report No TT 600/14. Pretoria: Water Research Commission, 59-74. [ Links ]
Winstanley, H F, Chapwanya, M, McGuinness, M J & Fowler, A C 2010. A polymer-solvent model of biofilm growth. Proceedings of the Royal Society A, 467(2129): 1449-1467. [ Links ]
WHO (World Health Organization) 2000. Disinfectants and disinfectant by-products. In: Environmental Health Criteria 216. Geneva: WHO, 529. [ Links ]
WHO (World Health Organization) 2011. Microbial fact sheets. In: Guidelines for Drinking-Water Quality, 4th ed. Valleta, Malta: Gutenberg, 231-305. [ Links ]
Zhang, W & DiGiano, F A 2002. Comparison of bacterial regrowth in distribution systems using free chlorine and chloramine: a statistical study of causative factors. Water Research, 36(6): 1469-1482. [ Links ]
 Correspondence:
U Kadwa
6 Pin Oak Avenue
Hilton 3245
South Africa
T: +27 33 343 6700
E: kadwau@jgafrika.com
M V Kumarasamy
School of Engineering
University of KwaZulu-Natal
Durban 4041
South Africa
T: +2 7 31 260 7571
E: kumarasamy@ukzn.ac.za
D Stretch
School of Engineering
University of KwaZulu-Natal
Durban 4041
South Africa
T: +27 31 260 1064
E: stretchd@ukzn.ac.za

UNAIS KADWA obtained his MSc Eng in Civil Engineering from the University of KwaZulu-Natal as a research student in the Centre for Research in Environmental, Coastal and Hydrological Engineering (CRECHE) in 2015. He is currently a graduate civil engineer in JG Afrika's Hilton office where he specialises in the design and implementation of water and irrigation infrastructure. His research interests include biofilm inhibition, rainwater harvesting and hydraulic modelling.

DR MUTHUKRISHNA VELLAISAMY KUMARASAMY (BE, ME (AU), PhD (IIT Roorkee)) is a Senior Lecturer in Civil Engineering at the University of KwaZulu-Natal. His areas of research interests are water quality modelling, water distribution system analysis, energy from distribution networks and biofilm growth control.

PROF DEREK STRETCH (BSc Eng, MSc Eng, PhD (Cantab)) lectures Hydraulics and Environmental Fluid Mechanics at the University of KwaZul u-Natal. He currently occupies the eThekwini-sponsored Chair in Civil Engineering and is Director of the Centre for Research in Environmental, Coastal and Hydrological Engineering. His research group focuses on the bio-hydrodynamics of estuarine systems, coastal and shoreline processes, and understanding turbulence and mixing in environmental flows.

