


Services on Demand
Article
 English (pdf)
 Article in xml format
 Article references
Indicators

Related links
-
 Cited by Google
 -
 Similars in Google
Share

 Permalink
Journal of the South African Institution of Civil Engineering
On-line version ISSN 2309-8775
Print version ISSN 1021-2019
J. S. Afr. Inst. Civ. Eng. vol.60 n.4 Midrand Dec. 2018
http://dx.doi.org/10.17159/2309-8775/2018/v60n4a4
TECHNICAL PAPER
The influence of concrete compressive strength and specimen size on the compression stress block parameters of reinforced concrete
F van Schalkwyk; E P Kearsley
ABSTRACT
This paper describes the influence of concrete compressive strength and specimen size on the fundamental characteristics of the flexural compressive stress-strain distribution. The main variables were specimen size and cylinder compressive strength. A total of 27 concrete specimens were subjected to flexural tests, with specific reference to analysis of the compression stresses, produced by varying two independent loads in a configuration aimed at controlling the strain distribution. These loads generated a condition of zero strain on the one face of the specimen, and a condition of maximum flexural compression strain on the opposite face. From the strain distribution, the stress-strain curves and stress block parameters were determined, and the influence of specimen size on the stress block parameters described using the Modified Size Effect Law (MSLE). Using a modified form of the moment-axial force (M-N) interaction diagram the BS 8110-1 (1997), SANS 0100-1 (2000), ACI-318 (2014) and EN 1992-1-1 (2004) codes of practice were compared for the design of reinforced concrete beams containing South African materials.
Keywords: stress block parameters, rectangular stress block, size effect, SANS 0100-1, EN 1992-1-1
INTRODUCTION
Even though high-strength reinforced concrete may be the most cost-effective solution for many structures, most design codes historically did not cover the design of concrete with strengths in excess of about 60 MPa. The South African code of practice, SANS 0100-1 (2000), limits the characteristic cube compressive strength to 60 MPa, while Eurocode 2 (EN 1992 1-1 (2004)) can be used for the design of reinforced concrete elements with characteristic cube compressive strengths up to 105 MPa. Using concrete with strengths in excess of 60 MPa in flexural elements will require less concrete in the compression zone of beams, which could lead to a significant reduction in own weight of structures as a result of minimised structural element sizes. However, before adopting the European code of practice for the design of high-strength concrete elements, it is necessary to ensure that the code design assumptions for the stress block parameters are applicable to local conditions and materials.
In this study, the influence of concrete compressive strength and specimen size on the flexural compression capacity of concrete was assessed. In total, 27 concrete specimens were tested in flexure, with specific reference to analysis of the compression stresses (produced by applying two sets of loads in a configuration aimed at controlling the strain distribution), the stress block parameters derived, and the influence of specimen size on the stress block parameters evaluated. Along with the size effect in flexural tests, with specific reference to an analysis of the compressive stresses, the size effect for cubes and cylinders was also evaluated, and the size effect for cylinders used to eliminate the size effect of the stress block parameters.
Finally, the difference between the measured moment-axial force (M-N) interaction diagram and the M-N interaction diagrams obtained using the BS 8110-1 (1997), SANS 0100-1 (2000), ACI-318 (2014) and EN 1992-1-1 (2004) code recommendations was compared.
BACKGROUND
A beam or a pure flexural member may be defined as an element that transfers loads, applied normally to its longitudinal axis, to support points (Mahachi 2013). When a reinforced concrete beam is loaded to failure, the ultimate limit state (ULS) is initiated when the strain at the extreme compression fibre reaches a maximum. The analysis and design of reinforced concrete beams are normally performed at the ULS, and require four basic assumptions (Hognestad et al 1955):
■ Plane sections before bending remain plane after bending. This assumption implies that the longitudinal strain (at various points in the cross section) is proportional to the distance from the neutral axis.
■ The stress-strain curve for the steel is known, and the strain in the steel and concrete at the same depth of the cross-section is assumed to be equal.
■ The tensile strength of the concrete below the neutral axis may be neglected, as both the force and the lever arm are small.
■ The stress-strain curve of concrete (defining the magnitude and distribution of the compressive stress) is known, and is a function of the strain only.
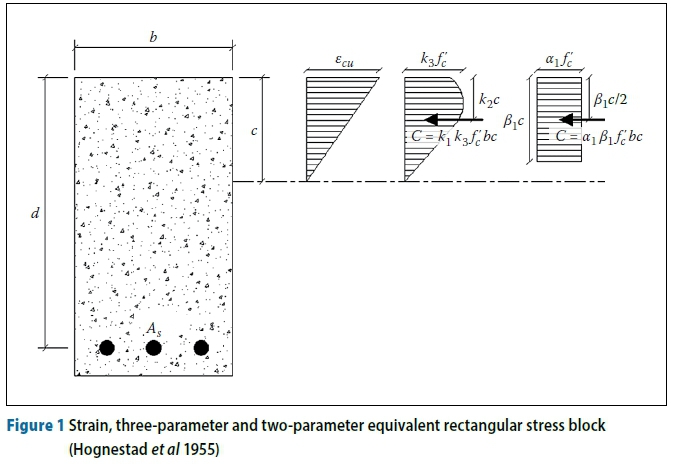
At ULS the nonlinear stress-strain distribution in the concrete compression zone may mathematically be defined with three parametersk1, k2and k3, and replaced with the equivalent rectangular stress block defined by two parameters (k1k3/2k2) and ßi (2k2), as shown in Figure 1 (Hognestad et al 1955).
The ratio between the average and maximum flexural compressive strength is defined as k1 the ratio between the depth of the resultant compressive force and the depth of the neutral axis is defined as k2, and k3 is defined as the ratio between the maximum stress in flexural compression and the uniaxial cylinder compressive strength. The height of the rectangular stress block is α1,while ß1is the base width of the rectangular stress block.
It is difficult to measure the stress in the compression zone of a reinforced concrete flexural member through direct experimentation. The ground-breaking work published by Hognestad et al (1955) proposed the use of a 203 χ 152 mm "C-shaped" specimen to simulate the strain distribution in the compression zone of a reinforced concrete flexural or flexural compression member. These strains, when combined with the loads and numerical differentiation, make it possible to determine the stress-strain behaviour of concrete in flexure, with specific reference to an analysis of the compressive stresses. Numerical integration of this stress-strain behaviour, combined with the uniaxial compressive strength of a 152 χ 305 mm cylinder, enabled the stress block parameters to be calculated.
Subsequent investigations done by Nedderman (1973), Kaar et al (1978a), Kaar et al (1978b), Swartz et al (1985), Pastor (1986) and Ibrahim (1994) all utilised the "C-shaped" specimen. Researchers such as Soliman and Yu (1967), Sargin et al (1971), Schade (1992), Tan and Nguyen (2005), Mertol et al (2008), and Khadiranaikar and Awati (2012) used detachable steel lever arms to apply the secondary load to concrete column sections. This type of experimental procedure is more practical and efficient, reducing reinforcing and concrete costs.
Utilising their own and previous test results, researchers such as Mattock et al (1961) expressed the stress block parameters as linear step functions dependent on the cylinder compressive strength. However, the influence of specimen size was not considered in their formulation. The size effect in flexure, with specific reference to an analysis of the compressive stresses, is important, as an over-reinforced concrete beam will have its flexural strength directly related to the concrete strength, while the flexural strength of an under-reinforced beam will be dictated by the amount of tensile reinforcing. Thus, for an over-reinforced beam the size effect for compressive strength is directly related to the flexural compressive strength in the compressive region of the beam. For an under-reinforced member, the increased flexural compressive strength results in a longer lever arm, and thus an increased moment capacity.
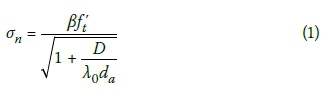
Concrete is a quasi-brittle material that fails through the formation and propagation of cracks induced by external loads. The formation and propagation of cracks release strain energy, and thus the size of the specimen (D) will have an influence on the nominal strength (on). Bazant (1984) derived the Size Effect Law (SEL) for concrete members subjected to uniaxial tensile stress (ft') by considering the energy balance at the instant of crack propagation. The SEL, indicated in Equation 1, assumes that the energy released is proportional to ndaa, with n a constant, a the crack length and dathe maximum aggregate size. λ0= na = 2 is normally assumed, and the parameter ß is determined from regression analysis.
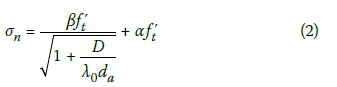
Kim and Eo (1990) proposed the Modified Size Effect Law (MSEL) shown in Equation 2, where it is assumed that a certain component of strength (af't) is independent of specimen size.
Even though Equations 1 and 2 were derived for cracks opening parallel to the applied load, the compression failure of members is also related to the formation and propagation of cracks, but perpendicular to the applied load. The SEL and MSEL can thus be used to describe the specimen size effect in compression (Bazant 1999).
Kim et al (2000) attempted to quantify the influence of specimen size on flexural compressive behaviour and the ultimate compressive strain utilising the same "C-shaped" specimen proposed by Hognestad et al (1955). The main test variable was the specimen size ratio (1:2:4), with the length and depth of the specimens proportionally changed, but the width of the specimen kept constant. A total of twenty-one 52.0 MPa "C-shaped" specimens were tested, and it was concluded that the size effect is more pronounced in flexure, with specific reference to an analysis of the compressive stresses, than in uniaxial compression.
Although Kim et al (2000) investigated the specimen size effect, neither the interaction between the specimen size effect and compressive strength, nor the effect on the individual stress block parameters was considered, providing the basis for this investigation.
EXPERIMENTAL PROGRAMME
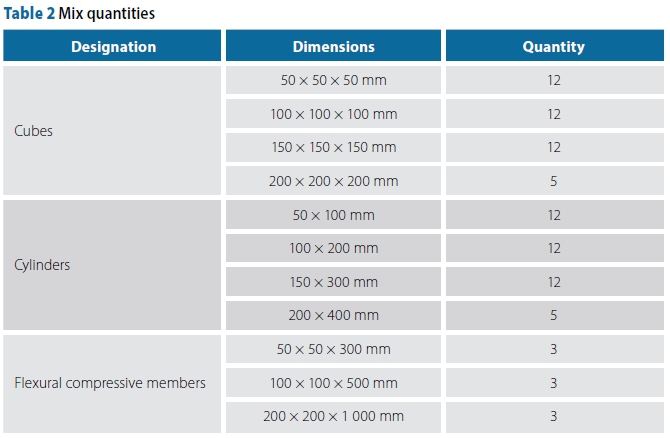
This experimental programme aimed to quantify the effect of compressive strength and specimen size on the stress block parameters of concrete containing South African materials. The mix designs and elements cast for each mix are presented in Tables 1 and 2 respectively. As high-strength concrete elements normally have reduced cross-sectional areas, the effect of specimen size was taken into account by casting small elements with dimensions comparable to the compression block depth of high-strength concrete beams. Crushed dolomitic aggregate with a maximum size of 4.75 mm, and CEM I 52.5 N cement were used as the sole aggregate and binder.
After casting and demoulding, the cubes, cylinders and flexural compression members were water-cured, during which time surface-grinding of the cylinders and the compression face of the flexural compression members was carried out. After 28 days, the specimens were placed in an oven at 50°C for two days (to remove any moisture), and subsequently stored in a room with a constant temperature.
The cubes were crushed in uniaxial compression, and the uniaxial stress-strain relationship of the cylinders was monitored using suitably sized compressometers. The 150 mm cylinder compressometer measured both longitudinal and transverse deformation, making it possible to compute Poisson's ratio.
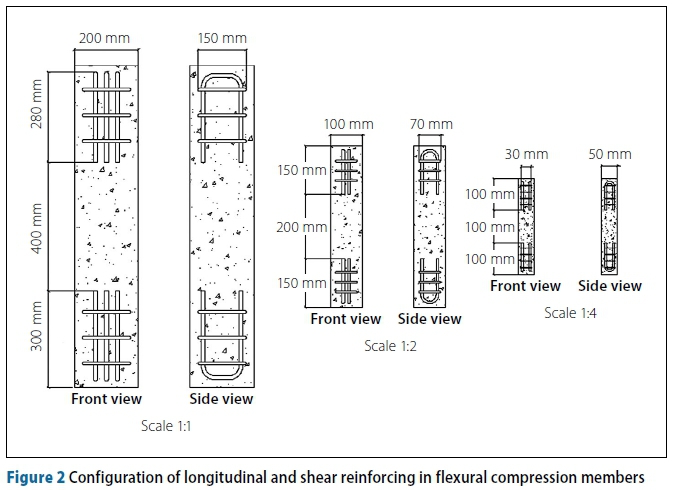
To prevent premature localised failure, both ends of the flexural compression members were heavily reinforced. The reinforcing configuration in the end regions of each of the concrete sections is illustrated in Figure 2. The longitudinal reinforcing for the 1:1, 1:2 and 1:4 scale specimens consisted of three Y12, two Y8 and two Y5 bars respectively. The transverse reinforcing, used in the 1:1 and 1:2 scale specimens consisted of three Y10 and three Y6 bars, with 2 mm steel wire used to enclosed the 1:4 scale specimen cages.
After being removed from the oven, the central unreinforced region of the flexural compression members was instrumented with 30 mm long BK 2/120 strain gauges. Six strain gauges were attached to the 1:2 and 1:4 scale flexural compressive specimens, and nine to the 1:1 scale specimens. For all specimen scales, three of these strain gauges were located on the flexural compressive surface, two monitoring the longitudinal compressive strain and the remaining, the transverse tensile strain.
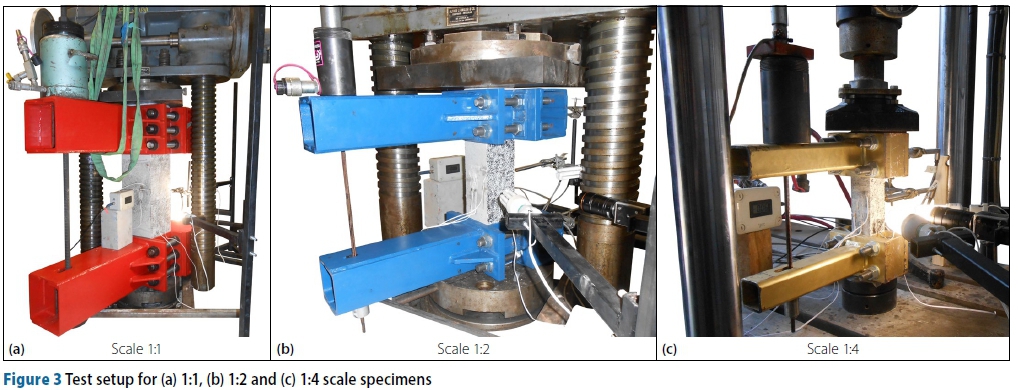
Figure 3 shows the experimental setup for the 1:1, 1:2 and 1:4 scale specimens respectively. The 1:1 scale lever arms consisted of two 600 mm long PC 200 χ 75 channel sections, connected via their top and bottom flanges with two 180 χ 10 χ 600 mm steel plates. The assembly was welded to a 400 χ 260 χ 25 mm end plate, strengthened with four 10 mm stiffeners, and connected to a 25 mm back plate (reinforced with two PC 200 χ 75 channel sections) through six Gr 8.8 M33 threaded rods.
The 1:2 scale lever arms consisted of two 400 mm long C 100 χ 50 channel sections connected via their top and bottom flanges with two 90 χ 5 χ 400 mm steel plates. The assembly was welded to a 250 χ 130 χ 20 mm end plate, strengthened with two 10 mm stiffeners and connected to a 20 mm end plate (reinforced with two C 100 χ 50 channel sections) with four Gr 8.8 M20 threaded rods.
The 1:4 scale lever arms consisted of a 255 mm long, 50 χ 50 χ 4.5 mm square tube section, welded to a 150 χ 85 χ 16 mm end plate, and connected via four Gr 8.8 M16 threaded rods to a 150 mm χ 85 mm χ 16 mm back plate.
The primary axial load (P1) was applied to the 1:1 and 1:2 scale specimens with a 3 000 kN Amsler compression machine, while a 250 kN MTS 810 compression machine was used for the 1:4 scale specimens. For the 1:1 scale specimens, a 100 ton Simplex hydraulic jack was used to apply the secondary load (P2) and a 10 ton Euro press pack hydraulic jack was used for the 1:2 and 1:4 scale specimens. For all specimens, P1was applied at a constant rate of 2 MPa/min, and P2was constantly adjusted to maintain a condition of zero strain on the back exterior face of the specimen, while the opposing face was subjected to a monolithically increasing com-pressive stain. Three 50 mm linear variable displacement transducers (LVDTs) were placed at the top, bottom and mid-section of the specimen to monitor the deflected shape, thus enabling the incorporation of second-order moments.
DISCUSSION AND ANALYSIS OF RESULTS
Cubes and cylinders
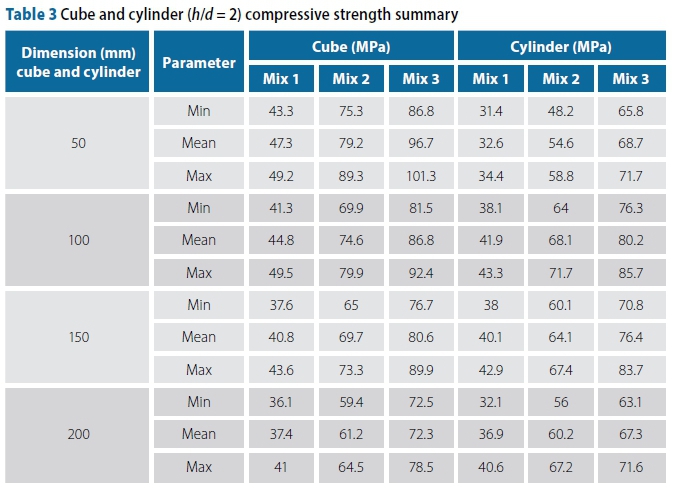
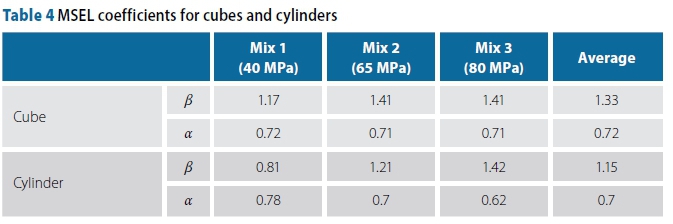
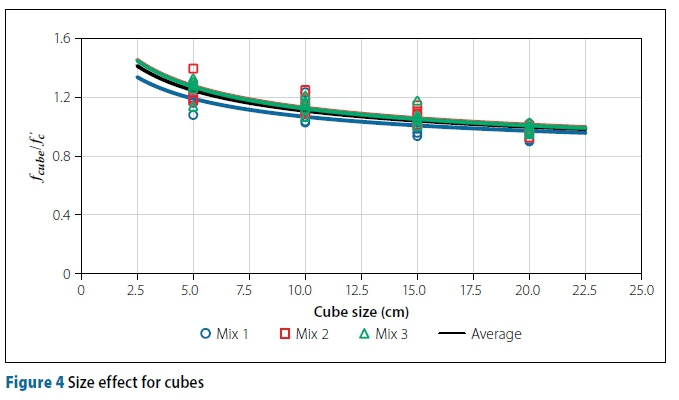
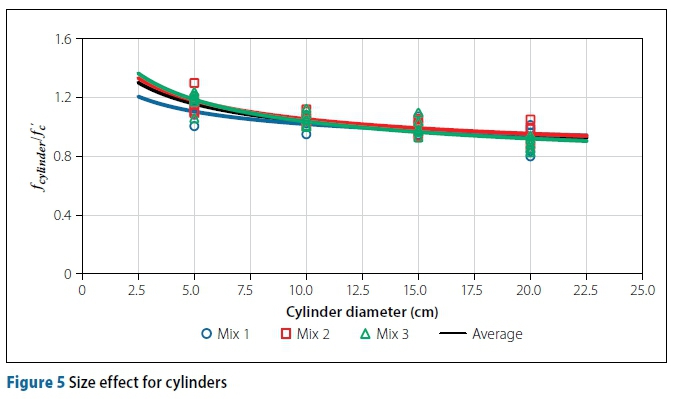
A summary of the cube and cylinder compressive data can be seen in Table 3. By assuming λ0= 2, da= 0.475 cm, λ0da= 0.95 cm and standardising the compressive strength for each specimen size with respect to the average 150 mm cylinder strength (f ) of that particular mix, the remaining MSEL regression coefficients could be calculated. Table 4 shows a numerical presentation of the MSEL coefficients with a visual presentation of the cube and cylinder size effect provided in Figures 4 and 5 respectively.
The values presented in Table 4 indicate that the size-independent-component-coefficient (α) for cubes appears to be independent of compressive strength, but for cylinders reduces with an increase in compressive strength. However, β becomes more prominent with an increase in compressive strength for both cubes and cylinders.
Flexural compression specimens
The typical longitudinal strain gauge measurements, shown in Figure 6 indicate that there is a slight deviation in the strain gauge readings. However, these deviations are not significant. Thus, the strain gauge measurements provide confirmation of the assumption that planar sections remain plane during bending. It can therefore be assumed that all fibres in the cross-section follow the same stress-strain curve, and the strain at the extreme compression fibre may be used to describe the complete stress-strain curve.
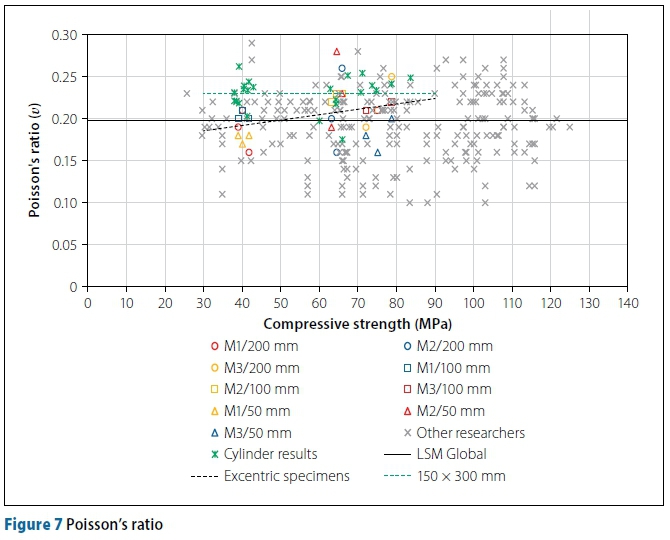
By combining the longitudinal and transverse extreme fibre compressive strains, estimates of Poisson's ratio in flexure, with specific reference to an analysis of the compressive stresses, was made. Published results for Poisson's ratio, as well as the Poisson ratios obtained in this study, can be seen in Figure 7. Figure 7 indicates that the average Poisson's ratio is 0.2, and that the 150 mm cylinder Poisson's ratio was independent of concrete strength, with an average value of 0.23. The flexural compression members, on the other hand, showed an increase in Poisson's ratio, with an increase in compressive strength. However, Figure 7 also illustrates the large range of Poisson's ratio values for different concrete strengths. Although most designers use a value ranging from 0.15 to 0.2 (0.2 being the most common), it can be as high as 0.28. Since a high Poisson's ratio can have a profound effect on the stress distribution in structures and structural elements, the possible consequence of a higher Poisson's ratio value should be taken into account.
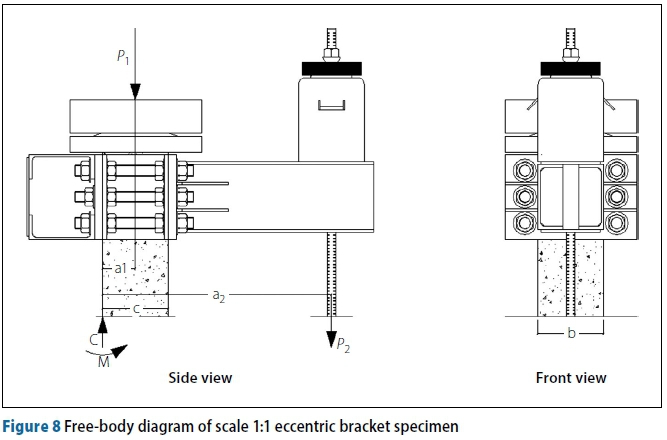
Using the free-body diagram indicated in Figure 8, the procedure proposed by Hognestad et al (1955) was used to calculate the concrete stress (oc) as a function of the extreme fibre longitudinal compressive strain (ec), and the applied stresses (f0and mo) as indicated in Equations 3 and 4. Stresses foand moare determined from the applied external loads (P1and P2, the eccentricity of these loads (a1and a2), the section width (b), and section depth (c).
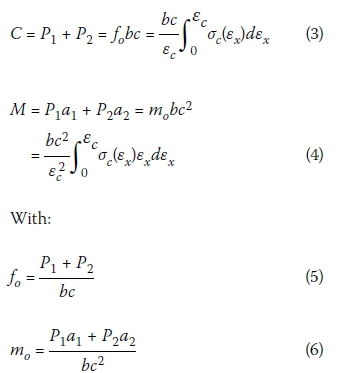
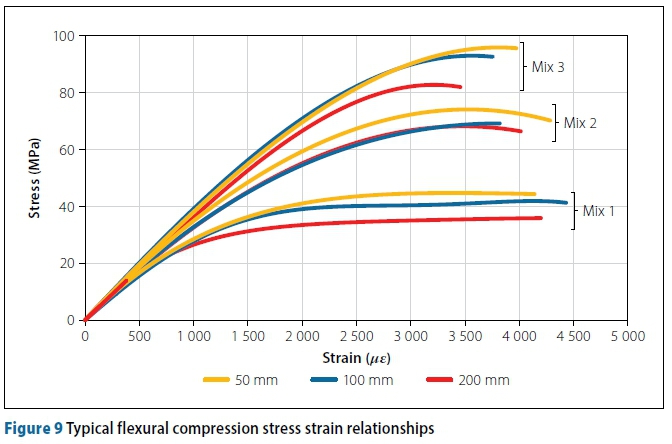
Equations 7 and 8 are obtained by differentiating and rearranging the last terms of Equations 3 and 4 with respect to ec. Using small enough increments, the differentials of df0/decand dm0/dscmay be approximated by Δf0/Δecand Δm0/Δec, and Equations 7 and 8 can be used to generate two similar stress-strain curves. The average of the two relationships was used to represent the flexural stress-strain relationship, with specific reference to the analysis of compression stresses (Hognestad et al 1955). See Figure 9.

With the stress-strain relationships in flexure, with specific reference to an analysis of the compressive stresses defined, the generalised stress block parameters and ultimate strains were calculated. For each specimen size, the stress block parameters were calculated using the 150 mm cylinder strength, as well as the cylinder strength of samples with cross-section dimensions similar to that of the scaled flexural samples.
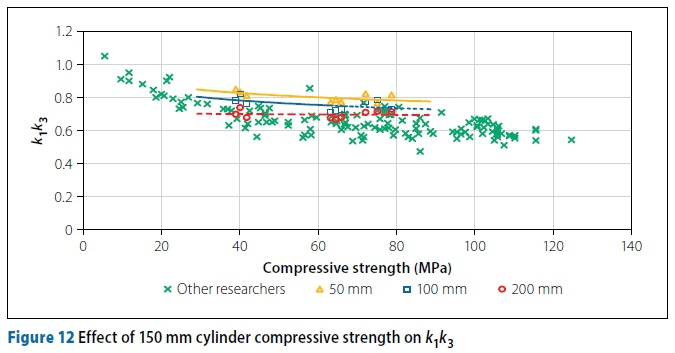
From Figures 10 and 11 it can be seen that the stress block parameters and (and thus β1) are independent of specimen size. As in the case of the cubes and cylinders, the influence of size on the remaining stress block parameters was established by assuming λ0da= 0.95. Figure 12 shows the size effect for k1k3if the 150 mm cylinder strength is used for calculation.
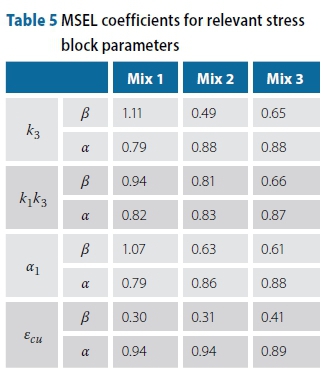
As the 200 mm (20 cm) specimen is the standard specimen size used to obtain the stress block parameters, the stress block parameters for other specimen sizes are standardised with respect to the average 20 cm specimen stress block parameter. The direct influence of the cylinder strength on the calculation of k3,k1k3 and α1 (k1k3/2k2), as well as the known size effect associated with the ultimate compressive strain (ecu), produces the size effect coefficients illustrated in Table 5. The average of these relationships was used to describe the size effect for the stress block parameters, as shown in Equations 9 to 12.

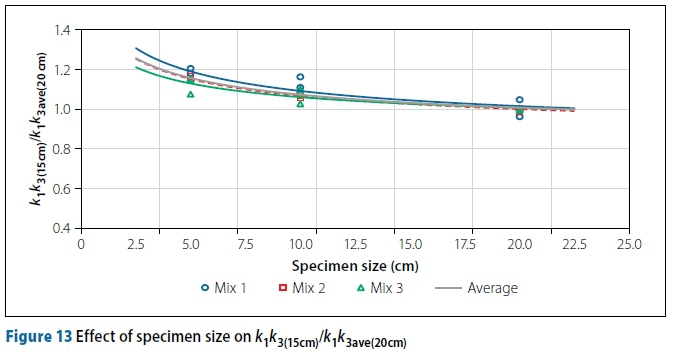
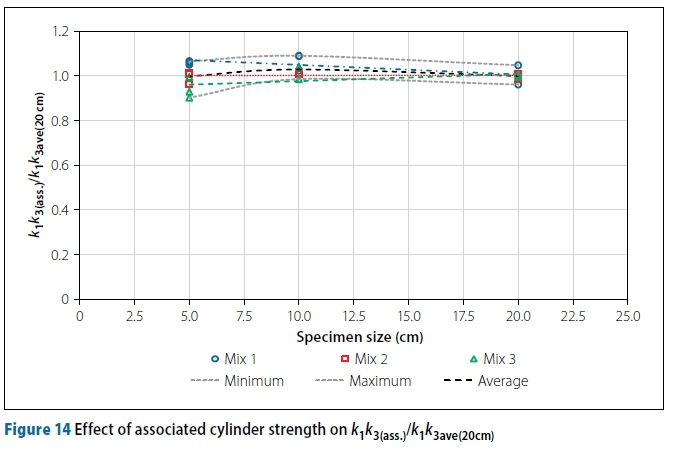
Graphs for k1k3(15cm)/k1k3ave(20cm)calculated using the 150 mm cylinder strength, and k1k3(ass.)/k1k3ave(20cm)calculated usingthe associated cylinder strength (for the 50 mm and 100 mm specimens) are shown in Figures 13 and 14 respectively. Figure 13 illustrates the specimen size effect associated with k1k3, while Figure 14 illustrates that the size effect for k1k3(and thus k3 and may be eliminated if the associated cylinder strength is used in the calculation of the 50 mm and 100 mm stress block parameters.
As the size effect in the 50 mm and 100 mm flexural compression specimens can be eliminated by using the associated cylinder strength, the same stress block parameter models proposed for the conventional sized specimens can be used for the design of the flexural members with reduced cross-sectional areas. If this is the case, the increase in compressive strength (owing to a reduction in specimen size) may be taken into consideration using the size effect for cylinders in uniaxial compression. Furthermore, if the 50 mm and 100 mm flexural compression specimens are used in conjunction with the associated cylinder strength, a much easier and more cost-effective investigation into the conventional stress block parameters can be made. The reduction in flexural-compression-test-specimen size has the benefit of not only improving the handling ability, but also paves a way for further investigations into the flexural behaviour, with specific reference to an analysis of the compressive stresses, of high-strength concrete, a study field previously limited due to compression testing machine capacity limitations.
Comparison of design codes
The BS 8110-1 (1997), SANS 0100-1 (2000), ACI-318 (2014) and EN 1992-1-1 (2004) design codes were compared both from a global perspective and with respect to their ability to predict the flexural behaviour of concrete containing South African materials. The basis for this comparison is a moment-axial force (M-N) interaction diagram that has been normalised with respect to the section dimensions and the compressive strength.
Each of the experimental points can be presented by a coordinate pair (mt, nt) on the normalised M-N interaction diagram. These coordinates are obtained by substituting the k1k3and k2 values of the experimental points into Equations 13 and 14 (derived from the equilibrium of forces and moments). For the experimental values ζ = (t= 1, as the depth of the neutral axis corresponds to the depth of the section. Each of these points can also be defined in a radial coordinate system, consisting of radial distance (Rt) and an angle (0t), calculated by using Equations 15 and 16 (Ibrahim 1994) respectively.

To generate the normalised M-N interaction diagram using the code recommendations, the k1k3 (α1 χ β1)and k2(0.5 χ β1) value obtained from the relevant recommendation is used in conjunction with a value of ζ = ζά= k2t/k2din Equations 13 and 14. Note that ζ = ζd= k2t/k2dimplies that the angle between the normalised moment axis and the line connecting the origin to the test point needs to be the same as the angle between the normalised moment axis and the line connecting the origin to the point generated using the design model. In a similar fashion, the point obtained by using the design recommendation can be presented by a radial distance (Rd) and angle (θd).
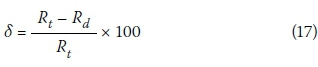
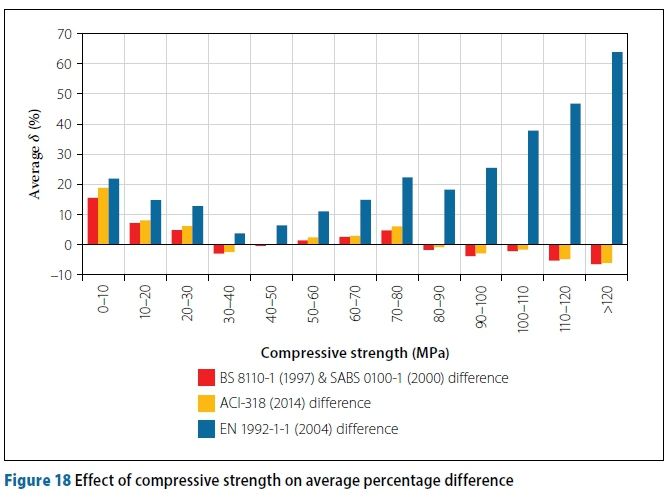
The experimental points were compared to the points obtained by using the equations published in the design codes of practice, and the difference between the measured and predicted values used to determine δ (Equation 17) as a fraction of the measured values. If δ is larger than one, the design recommendations under-predict the strength. The δ values for the BS 8110-1 (1997), SANS 0100-1 (2000), ACI-318 (2014) and EN 1992-1-1 (2004) design codes are shown in Figures 15 to 17. The average of these differences was calculated in 10 MPa increments, and the histogram shown in Figure 18 constructed.
Figures 15 and 18 show that the BS 8110-1 (1997) and SANS 0100-1 (2000) codes do not provide a constant difference, and the prediction becomes less conservative with an increase in compressive strength. On average the BS 8110-1 (1997) and SANS 0100-1 (2000) codes underestimate the strength by 0.8%. For cylinder strengths in excess of 80 MPa, the BS 8110-1 (1997) and SANS 0100-1 (2000) codes overestimate by as much as 6.5%. In total 48.6% of results were smaller than the code prediction. On average the BS 8110-1 (1997) and SANS 0100-1 (2000) codes underestimate the study results by 5.2%, 4.0% and 9.0% for Mix 1, Mix 2, and Mix 3 respectively.
Figures 16 and 18 show that the ACI-318 (2014) code does not provide a constant difference, becoming less conservative with an increase in compressive strength. On average, the ACI-318 (2014) code underestimates the experimental values by 1.8%. For cylinder strengths in excess of 80 MPa, the ACI-318 (2014) code overestimates by as much as 6.1%. In total, 48.6% of values are smaller than the code prediction. On average, the ACI-318 (2014) code underestimates the study results by 6.0%, 4.3% and 10.1% for Mix 1, Mix 2 and Mix 3 respectively.
Figures 17 and 18 show that the EN 1992-1-1 (2004) code provides a relatively constant difference for strengths less than the design limit of 90 Mpa, on average underestimating by 18.6%. In total 10.1% of values are smaller than the code prediction. Compared to the study results, the EN 1992-1-1 (2004) code on average underestimates by 12.6%, 16.0%, and 27.1% for Mix 1, Mix 2, and Mix 3 respectively. If the same values for α1and β1assumed forfc'=90 MPa, i.e. α1=0.70 and β1=0.8, are assumed for strengths in excess of 90 MPa, the EN 1992-1-1 (2004) code calculations result in an ever increasing underestimation of strength.
From Figure 18 it can be seen that the BS 8110-1 (1997), SANS 0100-1 (2000) and ACI-318 (2014) codes tend to be less conservative than the EN 1992-1-1 (2004) code for all concrete grades, particularly for concrete with strengths in excess of 80 MPa. All three design codes are calibrated to provide a suitable factor of safety against collapse, and the study results were mostly underestimated. It can thus be concluded that the BS 8110-1 (1997), SANS 0100-1 (2000) and ACI-318 (2014) codes can be used for the safe design of flexural members and flexural compression members up to 80 MPa, while the EN 1992-1-1 (2004) code can safely be used for the design of flexural members with even higher strengths.
CONCLUSIONS AND RECOMMENDATIONS
Conclusions
The observations and conclusions summarised in this section were based on both the analysis of the results obtained during this study and results obtained by other researchers.
■ The assumption that plane sections remain plane during bending holds true for concrete containing dolomitic aggregate, irrespective of the compressive strengths or specimen sizes considered in this study.
■ The results confirm that a value of 0.2 for the Poisson's ratio is justifiable. However, a value of 0.28 is recommended owing to the large range of Poisson's ratios. Additionally the Poisson's ratio of 150 mm cylinders tends to remain constant at 0.23, while the Poisson's ratio of the flexural compression specimens, increases with an increase in compres-sive strength.
■ K1, K2 and β1 were all found to be independent of the specimen size.
■ k3,k1k3, a1 and εcuall showed a clear specimen size effect when calculated using the 150 mm cylinder strength. The size effect for k3, k1k3, a1 are all dependent on the cylinder strength.
■ The size effect of non-standard (50 mm or 100 mm) flexural compression members may be taken into account by using the associated cylinder strength. By testing cylinders with a diameter similar to the dimensions of the flexural compression member (structural member), the size effect observed for k3, k1k3and α1can be eliminated. This means that the stress block parameters obtained by testing 200 mm specimens may be used for all specimen sizes and the increased or decreased strength of the specimen taken into consideration by using the size effect for cylinders in uniaxial compression.
■ The difference between the experimental M-N interaction diagram and the M-N interaction diagram generated by using the BS 8110-1 (1997), SANS 0100-1 (2000) and ACI-318 (2014) code recommendations is not constant, underestimating for concrete strengths less than 80 MPa, and overestimating for concrete strengths in excess of 80 MPa.
■ The difference between the experimental M-N interaction diagram and the M-N interaction diagram generated by using the EN 1992-1-1 (2004) code recommendations appears to be constant, underestimating the flexural strength for all concrete strengths.
For strengths in excess of 90 MPa, the EN 1992-1-1 (2004) code produces an ever increasing underestimation of flexural strength.
■ As all four design codes are calibrated to provide a suitable factor of safety against collapse, and the study results were mostly underestimated, the BS 8110-1 (1997), SANS 0100-1 (2000) and ACI-318 (2014) codes can be used for the design of flexural members and flexural compression members up to 80 MPa, while EN 1992-1-1 (2004) code is suitable for the safe design of flexural members with even higher strengths.
Recommendations
The results presented in this study were based on a limited number of test results obtained from concrete containing a single aggregate type. Further investigation is required into the influence of specimen size on the stress block parameters of concrete to confirm the trends observed in this study.
Based on the results obtained in this study, the 50 χ 50 χ 300 mm and 100 χ 100 χ 500 mm flexural compression specimens can be used to determine the compression stress block parameters, provided that the associated cylinder strength is used in calculations. This paves the way for determining the stress block parameters of high-strength concrete, a study field previously limited by compression machine capacity limitations.
From a flexural and flexural compression design perspective, the introduction of the EN 1992-1-1 (2004) may be welcomed, and this code of practice can safely be used to design flexural compression elements with concrete strengths in excess of 60 MPa.
ACKNOWLEDGEMENTS
The authors would like to express their gratitude to the Civil Engineering Department of the University of Pretoria for the use of their facilities, materials and testing equipment, as well as for the support received from laboratory staff.
REFERENCES
ACI (American Concrete Institute) 2014. ACI318. Building Code Requirements for Structural Concrete (ACI 318-95) and Commentary (ACI 318R-95). Farmington Hills, MI: ACI. [ Links ]
Bazant, Z 1984. Size effect in blunt fracture: Concrete, rock, metal. Journal of Engineering Mechanics, 110(4): 518-535. [ Links ]
Bazant, Z 1999. Size effect on structural strength: A review. Applied Mechanics, 69: 703-725. [ Links ]
BS (British Standard). 1997. BS 8110-11997. Structural Use of Concrete. Part 1: Code of Practice for Design and Construction. London: British Standards Institution. [ Links ]
EN (European Standard) 2004. EN 1992-1-1 2004. Eurocode 2: Design of Concrete Structures. Part 1-1: General Rules and Rules for Buildings. Brussels: European Committee for Standardization (CEN). [ Links ]
Hognestad, E, Hanson, N & McHenry, D 1955. Concrete stress distribution in ultimate strength design. Journal of the American Concrete Institute, 52: 455-479. [ Links ]
Ibrahim, H 1994. Flexural behavior of high-strength concrete columns. Edmonton, Canada: University of Alberta, Department of Civil and Environmental Engineering. [ Links ]
Kaar, P, Hanson, N & Capell, H 1978a. Stress-strain characteristics of high strength concrete. ACI Special Publication, 55: 161-186. [ Links ]
Kaar, P, Fiorato, A, Carpenter, J & Corley, W 1978b. Limiting strains of concrete confined by rectangular hoops. Skokie, IL: Portland Cement Association, Research and Development/Construction Technologies Laboratories. [ Links ]
Khadiranaikar, R & Awati, M 2012. Concrete stress distribution factors for high-performance concrete. Journal of Structural Engineering, 138(3): 402-415. [ Links ]
Kim, J & Eo, S 1990. Size effect in concrete specimens with dissimilar initial cracks. Magazine of Concrete Research, 42(153): 233-238. [ Links ]
Kim, J-K, Yi, S-T, & Yang, E-I 2000. Size effect on flexural compressive strength of concrete specimens. American Concrete Institute Structural Journal, 97(2): 291-296. [ Links ]
Mahachi, J 2013. Design of Structural Steelwork to SANS 10162, 3rd ed. Randburg: Xsi-tec. [ Links ]
Mattock, A, Kriz, L & Hognestad, E 1961. Rectangular concrete stress distribution in ultimate strength design. American Concrete Institute Journal, 57(2): 875-928. [ Links ]
Mertol, H, Rizkalla, S, Zia, P & Mirmiran, A 2008. Characteristics of compressive stress distribution in high-strength concrete. American Concrete Institute Structural Journal, 105(2): 626-633. [ Links ]
Nedderman, H 1973. Flexural stress distribution in very-high strength concrete. Arlington, TX: University of Texas at Arlington, Department of Civil Engineering. [ Links ]
Pastor, J 1986. High strength concrete beams. Ithaca, NY: Cornell University, Department of Civil Engineering. [ Links ]
SANS (South African National Standard) 2000. SANS 0100-1. The Structural Use of Concrete, Parts 1 and 2. Pretoria: SABS Standards Division. [ Links ]
Sargin, M, Ghosh, S & Handa, V K 1971. Effects of lateral reinforcement upon the strength and deformation properties of concrete. Magazine 0f Concrete Research, 23(75-76): 99-110. [ Links ]
Schade, J 1992. Flexural concrete stress in high strength c0ncrete c0lumns. Calgary, Canada: University of Calgary, Department of Civil Engineering. [ Links ]
Soliman, M T & Yu, C W 1967 The flexural stressstrain relationship of concrete. Magazine 0f Concrete Research, 19(61): 223-238. [ Links ]
Swartz, S, Nikaeen, A, Narayan Babu, H, Periyakaruppan, N & Refai, T 1985. Structural bending properties of higher strength concrete. ACI Special Publicati0n, 87: 145-178. [ Links ]
Tan, T H & Nguyen, N 2005. Flexural behavior of confined high-strength concrete columns. American C0ncrete Institute Structural Journal, 102(2): 198-205. [ Links ]
 Correspondence:
F van Schalkwyk
POBox 40772
Moreletapark
Pretoria 0044
Gauteng
South Africa
T: +27 82 574 8165
E: frannavschalkwyk@gmail.com
E P Kearsley
Department of Civil Engineering
University of Pretoria
Pretoria
0002
South Africa
T: +27 12 420 2176
E: elsabe.kearsley@up.ac.za

FRANCOIS VAN SCHALKWYK received his BEng in Civil Engineering cum laude in 2014 and BEng Hons (Structural Engineering) cum laude in 2015 from the University of Pretoria. This paper is based on research conducted fo r h is Master's deg ree in Structural Engineering.

PROF ELSABÉ KEARSLEY is a Fellow of the South African Institution of Civil Engineering (SAICE), of which she was also the president in 2009. She holds a PhD from the University of Leeds and she is currently a professor in Civil Engineering at the University of Pretoria. She worked as a structural design engineer in both South Africa and the United Kingdom before becoming a staff member at the University of Pretoria. For the last 23 years she has been involved with cement and concrete materials research.

