


Services on Demand
Article
 English (pdf)
 Article in xml format
 Article references
Indicators

Related links
-
 Cited by Google
 -
 Similars in Google
Share

 Permalink
Journal of the South African Institution of Civil Engineering
On-line version ISSN 2309-8775
Print version ISSN 1021-2019
J. S. Afr. Inst. Civ. Eng. vol.60 n.4 Midrand Dec. 2018
http://dx.doi.org/10.17159/2309-8775/2018/v60n4a1
TECHNICAL PAPER
Study of the Durban Bight shoreline evolution under schematised climate change and sand‑bypassing scenarios
C Rautenbach; A K Theron
ABSTRACT
The Durban Bight beaches, on the KwaZulu-Natal coast of South Africa, have been the topic of several studies in the past, because of their recreational and economic value. These beaches are mainly nourished via a sand-pumping scheme, which has been the case since the 1980s. The present study investigated the longer-term dynamic stability of the Durban Bight beaches using a one-dimensional numerical shoreline model. The wave conditions that drive the longshore transport of sand were simulated using the numerical spectral wave model Simulation WAves in the Nearshore (SWAN). The shoreline model was calibrated and validated against existing historical data. The calibrated model was then employed to simulate possible future scenarios. These included climate change phenomena and the influence of anthropogenic changes. Each of the simulations predicts a twenty-year period, with results extracted at five-year intervals. The results are presented and discussed, and the emphasis is placed on the importance of maintaining the required sand-bypassing rates and the awareness of the possible effects of climate change on shoreline maintenance and management.
Keywords: long-term shoreline modelling, sand-bypassing scheme, climate change, coastal management
INTRODUCTION
Background
The Durban Bight, on the east coast of South Africa in the KwaZulu-Natal Province, has been the topic of numerous studies in the past (Mather et al 2003; Cawthra et al 2012; Campbell et al 1985; Soltau & Smith 2003; Mather & Stretch 2012; Green et al 2012; Habets 2015). Durban Harbour is one of South Africa's and East Africa's largest harbours, which mainly functions as import and export harbour for containers, oil and food (Rossouw & Theron 2012). Import and export container throughput per annum is estimated at 41.9 Megatons (2.48 Million Twenty-foot Equivalent Units (MTEU)) (Rossouw & Theron 2012). Durban Harbour is the largest non-bulk terminal in South Africa, and up to 2010 was also the second-busiest port in the southern hemisphere (eThekwini Municipality 2010). In close proximity to the harbour, Durban also boasts some of South Africa's most well-known recreational beaches, which attract both national and international tourists. Due to this hotspot of coastal activity, the Durban Bight forms an ideal study location for various aspects of natural and anthropogenic changes (Mather & Stretch 2012; Theron 2007; Mather et al 2003; Barnett 1999).
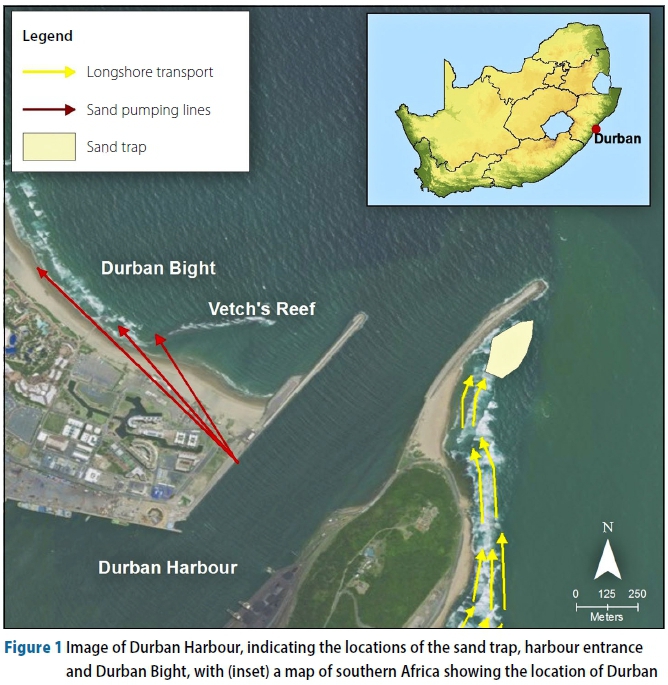
One of the most significant alterations to the natural beaches in the Durban Bight is the sand-bypassing scheme located at the harbour entrance. This scheme was implemented to compensate for the loss of sediment transported from the south to the north, due to the construction of the Durban Harbour southern breakwater. The longshore sediment transport from the south was cut off, resulting in severe erosion of the Bight beaches located to the north of the harbour entrance, prior to the 1980s. Currently the beaches are mainly nourished via the sand-bypassing scheme consisting of a sand trap (just south of the breakwater) and a dredger that pumps sand into a land-bound hopper system that transports sediment in a fluidised state to the Bight beaches. The sand-pumping pipelines consist of approximately 3.5 km of conduits (Mather et al 2003). A schematic illustration of this scheme is presented in Figure 1. With historical data of the sand-pumping volumes, this anthropogenic influence on the Durban Bight beaches can be studied and modelled.
The focus of the present work is on the long-term shoreline dynamics of the Durban Bight associated with:
■ global climate change
■ the possible construction of a new dig-out harbour south of the existing harbour (Habets 2015)
■ changes in sand-bypassing volumes and sediment characteristics, and
■ the effect of dam building in rivers that mouth south of the harbour.
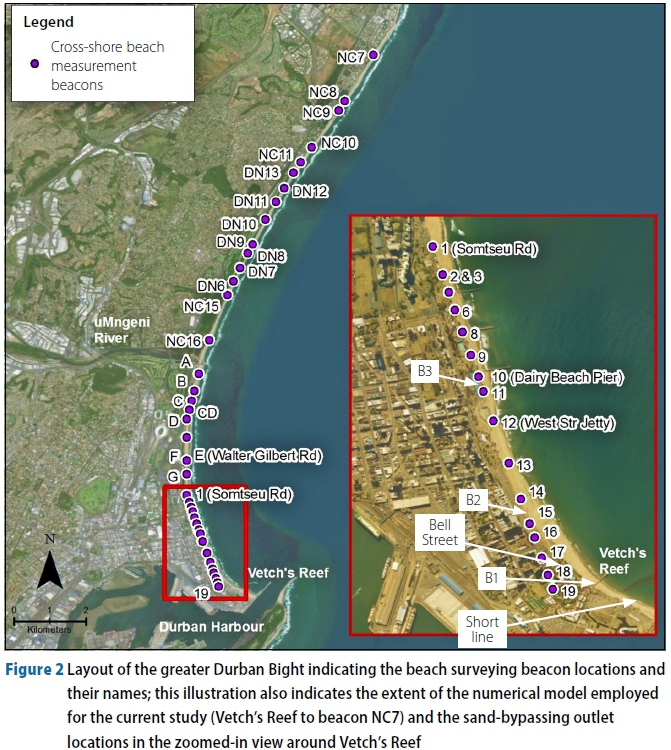
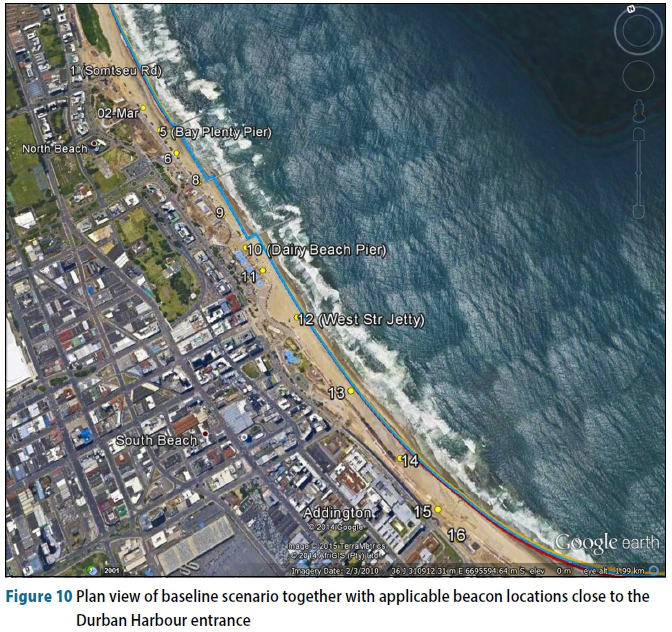
These factors can influence the quality of the Durban beaches significantly, and investigating these scenarios will contribute to effective planning and coastal hazard assessment by the eThekwini Municipality (greater Durban area) (Mather & Stretch 2012). In Figure 2 the layout of the greater Durban Bight is illustrated, together with the cross-shore measurement beacon locations utilised in the present study for calibration and validation. Relatively limited studies have been performed regarding climate change in southern Africa and the associated vulnerability and mitigation options, with the exception of some studies in South Africa (Theron 2007; Mather & Stretch 2012; Theron et al 2012). The present study will supplement existing studies to quantify the influence of certain future scenarios on the long-term shoreline dynamics in the Durban area, with the aim to inform local coastal management.
With knowledge of such potential changes, the eThekwini Municipality will be able to investigate ways to manage and mitigate potential impacts of wider or narrower beaches, such as blockage of stormwater outlets, wind-blown sand problems, reduced available beach space for recreational activities and possible effects on the Umgeni River mouth.
Aim
The aim of this study is to use a long-term shoreline model to provide updated predictions of the potential future shoreline changes resulting from four future scenarios. To this effect the following approaches were followed:
■ Employ the Simulation WAves in the Nearshore (SWAN) wave propagation model to transform offshore wave conditions to the nearshore.
■ Calibrate a Unibest (Deltares 2005) shoreline model, employing 200 to 400 representative wave conditions.
■ Use a model domain extending up to Umhlanga Rocks (Beacon NC7) in the north.
■ Include in the shoreline model the sediment inputs from the Umgeni River and the beach nourishment scheme.
The model will also be employed to investigate possible effects on the shoreline due to:
■ Climate change
■ The construction of a new port
■ The construction of dams in the rivers feeding the central KwaZulu-Natal coast
■ Changes in the particle size distribution (PSD) of the dredged sand.
To be able to predict the shoreline dynamics accurately the representative wave conditions had to be analysed first. This includes the setting up of the wave transformation model, analysis of wave data and determination of the conditions that are most representative for the Durban Bight. The predictions of potential future shoreline responses to the future scenarios are provided and discussed. Conclusions are made and recommendations are given.
SHORELINE MODEL SET UP
Model description
The Unibest CL+ numerical shoreline model (Deltares 2005) was employed in this study to simulate shoreline evolution based on wave-driven longshore transport. The model incorporates two sub-models that run in tandem: In the Unibest LT submodel, linear nearshore wave refraction, shoaling and breaking are predicted. The resulting longshore current and sediment transport are then calculated. This information serves as input (at several locations along the shoreline) to the Unibest CL sub-model, with which one-dimensional shoreline evolution is simulated. The latter sub-model allows for the incorporation of varying sediment sources, such as the sand-feeding along the Durban beaches from natural and anthropogenic sources.
The shoreline model functions based on single-line theory, which assumes the beach and nearshore profile to be represented by a cross-shore profile shape that does not change in time (Bosboom & Stive 2015). As the shoreline erodes or accretes, the entire equilibrium cross-shore profile moves either landward or seaward (Bosboom & Stive 2015). The model is ideal for medium- to long-term predictions of shoreline evolution. Generally, the model is run with a climate of representative wave conditions. The model can also simulate the temporal response of the shoreline to varying wave conditions. For periods shorter than seasonal scale, observed shoreline behaviour is dominated by on/ offshore processes (storms/calm periods).
Three-dimensional effects are not included in the model formulation and therefore the cross-shore erosion/accretion, due to e.g. storms (episodic erosion), is not represented in the model process. In a shoreline model, such factors are assumed to average out over the long time periods (Hugo 2013). The model is thus appropriately used to simulate structural erosion/accretion and not episodic erosion associated with the cross-shore movement of sediments (Bosboom & Stive 2015).
Wave input
During the shoreline model calibration period (1990 to 2006) waves were recorded off Durban by means of a Waverider buoy (1992-2001) and an Acoustic Doppler Current Profiler (ADCP 2002-2007) (Rossouw et al 1999). However, the older wave rider recordings off the Durban Bluff lacked wave directions, while the shallow ADCP wave data suffered from intermittent coverage and accuracy issues due to various challenges, for example episodic sand inundation of the instrument (Mather & Theron 2011).
These wave data sources were evaluated and transformed from their in-situ location to the offshore model boundary location. Transformation tables were used to avoid simulating recurring conditions. Datasets were transformed back and forth from these measurement locations to the offshore model boundary to assure the accuracy of the transformation tables. A near 1:1 comparison was obtained between the twice-transformed wave conditions and the original measurement datasets.
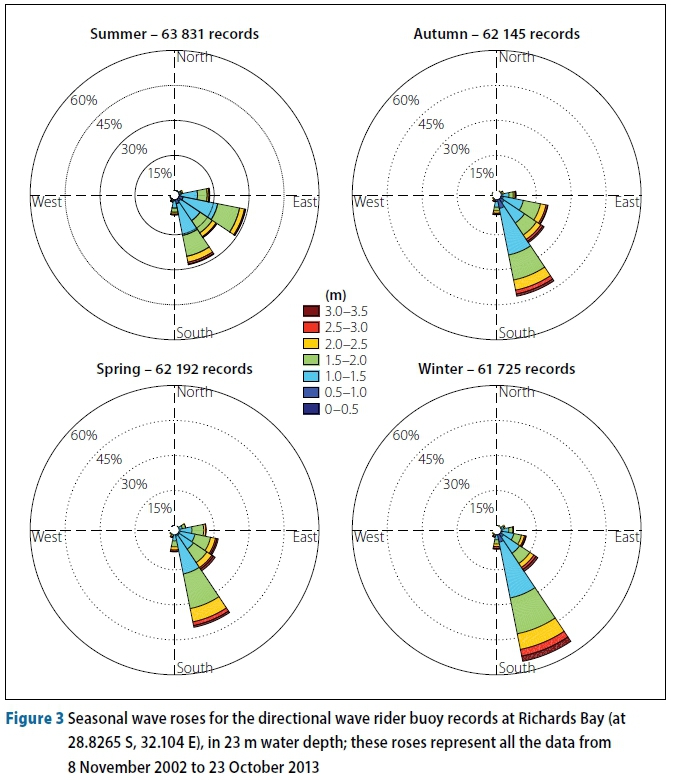
After transforming several wave datasets to the offshore model boundary, as a virtual time series, it was found that the most representative transport rates are provided by the data from the directional wave buoys at the Port of Richards Bay. In Figure 3 the seasonal directional wave roses at Richards Bay are given. The predominant wave direction is from the south-southeast with a directional spreading difference between the various seasons. Summer was the only season presenting a stronger east-southeast wave directional component.
In the Bight an approximate annual sediment transport rate of 265 000 m3 can be expected 305 000 m3 further north of the Umgeni River mouth (Theron 2015; Wells 2015) and the net north-eastward annual longshore sediment transport rate of about 500 000 m3 along the Durban Bluff (Schoonees 2000; Theron & Rautenbach 2014). Both resulting transport directions and magnitudes compare well to the known estimates, and the nearshore refracted wave parameters were confirmed with the nearshore ADCP dataset. Transforming only local ADCP data from the Bight failed in reproducing the wave conditions offshore (and thus nearshore transport rates) for the greater extent of the shoreline, due to a dominant easterly wave component. The peak wave period, significant wave height and directional time series correspond to the ADCP data less than a kilometre away from the tip of the Durban southern breakwater, in 17 m water depth (the data was provided by the local port authorities) (Diedericks et al 2011). This data was therefore utilised in the present study. The Richards Bay wave buoy was in a water depth of 23 m.
Wave conditions were extracted from the 437 refraction simulation outputs, just seaward (between 8 m and 6 m, depending on wave exposure) of wave breaking. The SWAN model consisted of three computational grids. The parent domain had a resolution of 1 km, the intermediate grid resolution was approximately 150 m and the final coastal nested grid resolution was approximately 20 m. The coastal nested domain was a curvilinear grid, while the other two domains were rectangular. The parent domain covered approximately 150 km along the coastline and the offshore boundary of the parent grid was approximately 60 km away from the coastline.
To ensure that alongshore changes in wave conditions are represented throughout the Bight, waves were input to the shoreline model at 48 locations. Approximately half of these were located north of the Umgeni River and half south of this point (refer to Figure 2). This gave greater computational density in the area of greater wave and bathymetric variability, with lower density along the northern part where the shoreline and bathymetry are fairly uniform. Transport conditions were interpolated between locations in the shoreline model.
Boundaries
The modelled domain extends from the present Vetch's Reef (or pier) in the south to Umhlanga Rocks in the north, a distance of approximately 16 km (refer to Figure 1). The coastline between Vetch's Reef and the North Breakwater of the port was not included in the model, as the focus of the study is on beach accretion of the main beaches (and secondarily because modelled wave conditions are less accurate in this partial diffraction zone).
At the boundaries of the model the transport (or shoreline behaviour) needs to be specified. No sand enters the Vetch's Bight area from the south, due to the intervening harbour breakwaters and deeper dredged entrance channel. At the southern model boundary, a variable input of sediment was used, this being the combined historical discharge rates, from the so-called Short Line and Long Line, which outlets formed part of the beach nourishment scheme. Both discharge close to Vetch's Reef, in the corner of the Bight, close to the harbour entrance. This was assumed to be a reasonable discretisation, as the Vetch's Bight cell appears to be neither a substantial sink nor a source of sand (CSIR 2003; Theron & Rautenbach 2014). Discharged sand, e.g. into the Bight by means of the Short Line, is therefore likely to exit northward towards the Durban beaches within a reasonably short period of time.
The northern boundary of the model was located at Umhlanga Rocks. At this point the rocky coastline forms a rocky headland protruding from the sandy beach that lies to the south, forming a non-erodible coast with an embayment to the north. Northward transport can thus readily occur while southward return transport is restricted by the embayment and headland, as well as by the local coastal orientation relative to the incident wave directions resulting in virtually unidirectional longshore currents and transport towards the north. This situation is reproduced by schematising the model boundary with a short groyne at Umhlanga Rocks and a fixed northward transport on its northern side (implying no southward transport across the groyne). Transport rates south of the boundary are influenced only by the transports and shoreline behaviour occurring in the remainder of the model domain. These determine the actual transport past the groyne and thus the model boundary.
Cross-shore profiles
Beach and nearshore profiles are required in the shoreline model to calculate wave transformation and longshore transport processes. The nearshore profiles were therefore extracted from the bathymetry. Due to some uniformity in the nearshore bathymetry, the profiles were schematised to six typical profiles based on measurements provided by the eThekwini Municipality.
Sediment size
Limited samples are available of the material dredged from the sand trap. From 2000 to 2004, samples from the sand-pumping scheme hopper indicated a profusion of coarse material. This was in contradiction to previous samples (1999), which indicated an average of 253 μm, once outliers were removed. Earlier sampling indicated sizes between 200 and 250 μm (Campbell et al 1985). The long-term averages, of dredging samples collected near-annually by eThe-kwini Municipality, indicate D50values in the range between 250 μm and 300 μm (Theron et al 2013). A value of 250 μm was thus applied as an approximation in the shoreline model calibration, validation and baseline scenario. For the future scenarios two extreme cases were investigated - one with D50 a third less than the baseline scenario (166 μm), and one with D50a third more than the baseline scenario (333 μm).
Model effective depth
The model effective depth parameter, or active height of the profile, describes the height of the mobile sand layer that responds to changes in shoreline orientation. Based on previous modelling investigations at the Council for Scientific and Industrial Research (CSIR 2007), a variable depth was used, ranging from 10 m in the north to 6 m in the more sheltered extreme south. During the predictions of future shoreline evolution, this parameter was increased to account for areas where material would be deposited into deeper water if the shoreline accreted substantially. It should be noted that the model effective depth has virtually no influence on the configuration of the long-term equilibrium shoreline, only the rate at which shoreline equilibrium is attained in response to a steady rate of sand discharge.
Sediment input from the Umgeni River
Data on the amount of sediment discharged to the sea by the Umgeni River is poor. However, the present typical annual input is very low, as there are limited sources of sandy material below the Inanda Dam (Garland & Moleko 2000). Sediment inputs occur mostly during episodic events. It has been estimated that the last extreme flood (1987) discharged between 720 000 m3 and 1.24 million m3 of sand. It is assumed that the present annual discharge is unlikely to be more than a few percent of this, due to five large dams trapping virtually all of the sediments (Theron et al 2008).
Longshore transport rates calculated north and south of the Umgeni area indicate a difference in the order of 70 000 m3/a (Soltau & Theron 2007).
However, shoreline changes (net erosion) north and south of the mouth suggest that at present this magnitude of material is not being supplied from river inputs (i.e. the difference in transport is being supplied by beach erosion). Tests with the shoreline model indicate that it is fairly insensitive to the input rate. The calibration suggested that a sediment input in the order of 20 000 m3/a was appropriate. This represents the volumes contributed by the river itself and any remnant contribution from sub-tidal flood deposits. This quantity was applied for the simulations.
SHORELINE MODEL CALIBRATION AND VERIFICATION
With the purpose of the study being to simulate future shoreline changes, the shoreline model was calibrated against actual measured shoreline changes. The model was set up with the appropriate sediment sources to represent the historic sand-pumping rates, and calibrated against measured shoreline changes at the municipality's beach survey beacons (which data is sourced from the eThekwini Municipality's extensive coastal monitoring programme, as for example reported on in Theron et al (2013).
Model calibration
The period of model calibration was the sixteen-year period from 1990 to 2006. This period was selected as the groynes/ piers were in place (constructed 1982 to 1988) and the sand-pumping scheme had been in operation for long enough (since 1982) to allow the shoreline to adapt to these changes. Comprehensive survey and pumping data was available (through eThekwini Municipality's coastal monitoring programme, e.g. Theron et al (2013)).
Discharge data
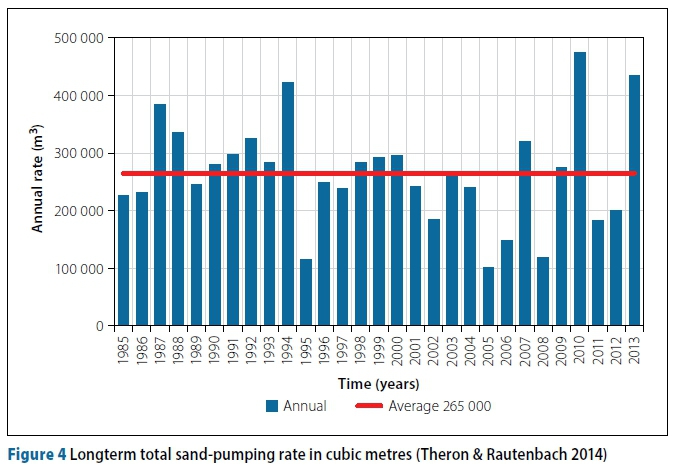
From 1990 to 2006 a volume of approximately 4 207 000 m3 was pumped onto the beaches at an average annual rate of 265 000 m3. The lowest annual pumping rate during this period was 99 000 m3 (2005) and the highest was 444 000 m3 (1994). The average rate has varied considerably over time. The running average annual rate is illustrated in Figure 4 for the period 1989 to 2013. During this period, the average annual rate has been 265 000 m3. In general, the annual rate has been decreasing in the past three decades.
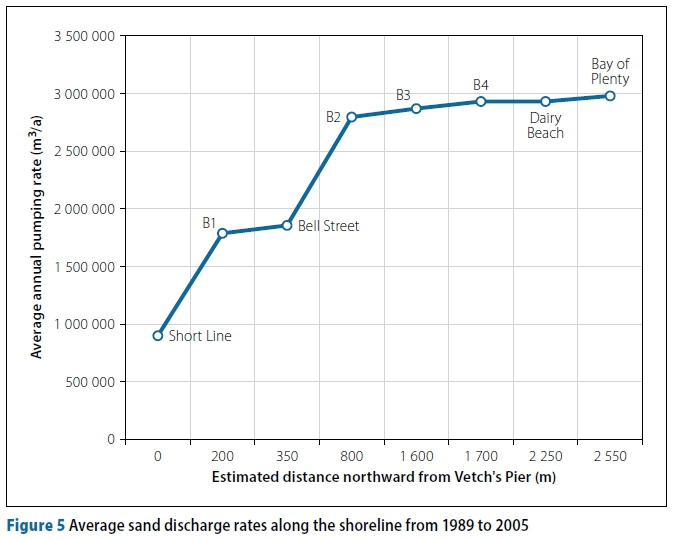
The average distribution of pumping volumes between the different beach outlets is given in Figure 5, noting that the Short Line and Long Line volumes have been combined in this figure, as this is how they were applied in the model (refer to Figure 2). Most of the sand (almost 90%) has been discharged south of the Dairy Beach outlet.
Calibration results
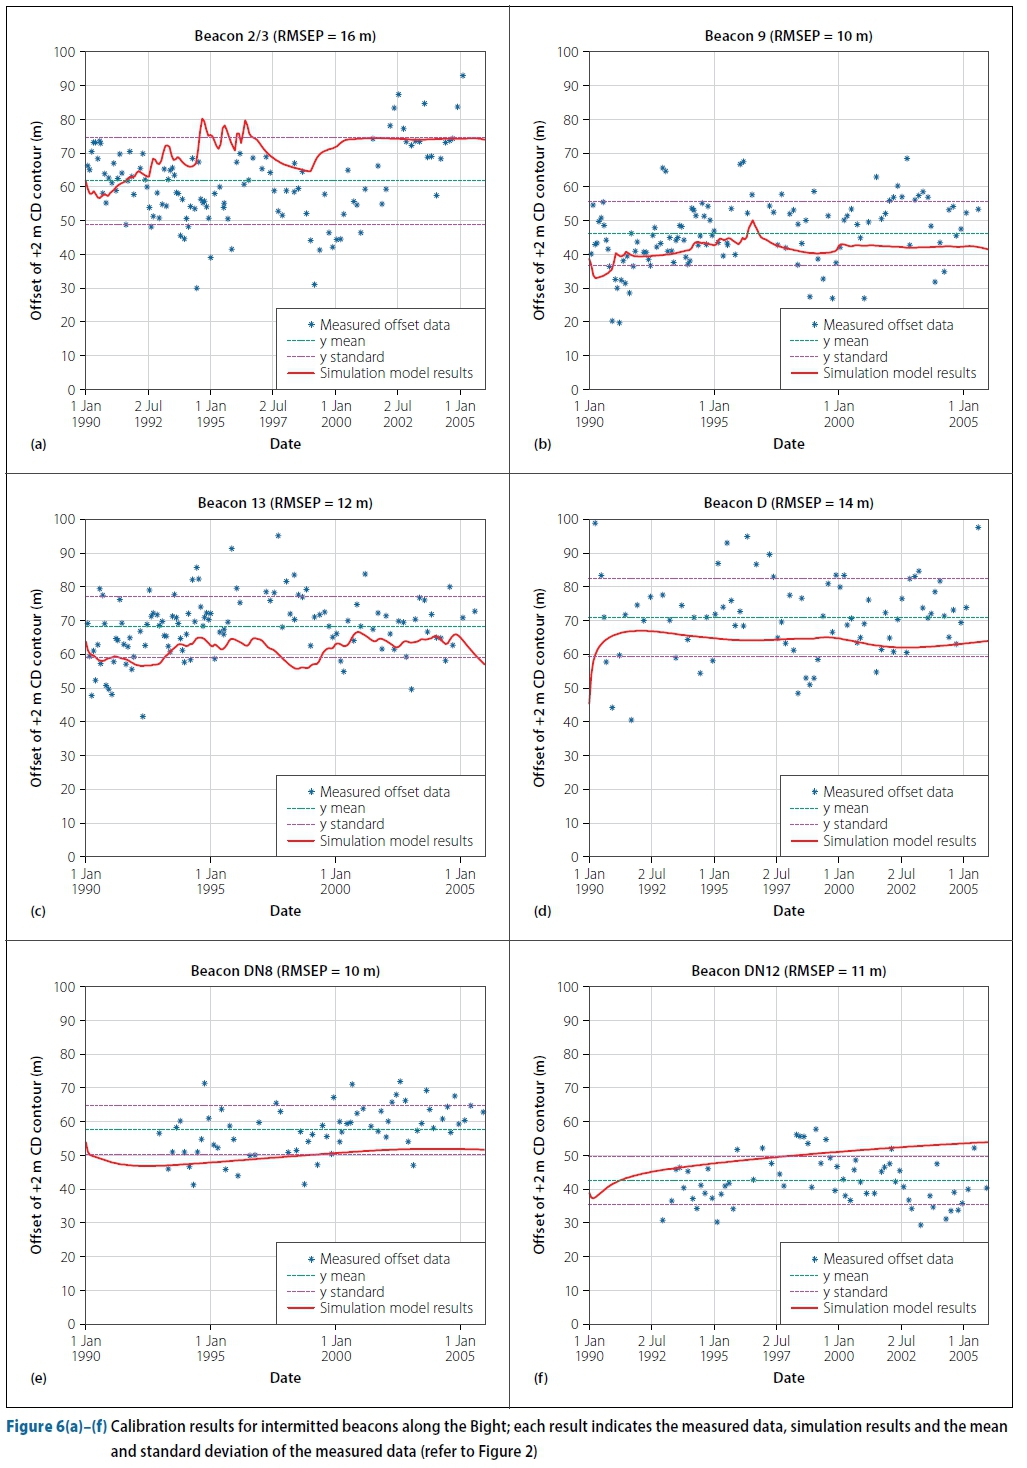
The calibration results are depicted in Figures 6(a) to (f). In these figures the measured horizontal offset data of the +2 m Chart Datum (CD) contour is depicted against the simulation model results (also at the +2 m CD contour) for the period of interest. The results depicted are given only for some of the beacon locations along the Bight (refer to Figure 2).
The accuracy of the calibration results was determined via the Root Mean Square Error of Prediction (RMSEP), which is defined as:
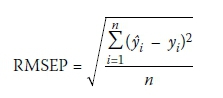
Where ýiis the predicted values from the model, yiis the measured data values and n is the number of measured data points.
The RMSEP is also given in metres and is thus an easy-to-understand method of quantifying the model prediction error. It should be emphasised that the Unibest model does not consider cross-shore effects. This is also clear in the comparisons presented in Figure 6. The variation in the measured data can, to a large extent, be attributed to cross-shore effect (for example storm events). The total average long-term behaviour is, however, dominated by the longshore transport of sediment. Thus, the ability of the model to predict the long-term behaviour of the beaches is adequate. It is also important to notice that the RMSEP value varies as the standard deviation of the measured data varies. The accuracy of the model prediction is thus directly related to the spread in the data. A large spread in the measured data is also an indication of a more dynamic beach regarding cross-shore processes. To resolve these processes a fully three-dimensional or cross-shore model would have to be employed over a period usually shorter than seasonal scale.
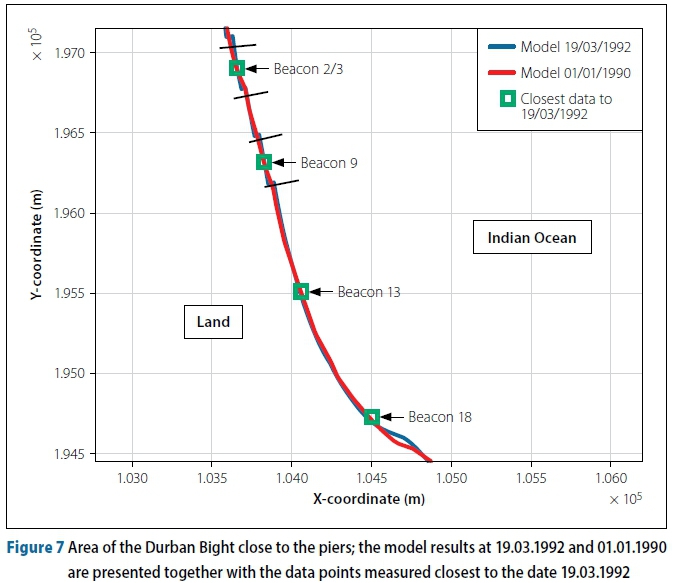
A shoreline model with an RMSEP of less than 10 m can be regarded as extremely accurate. Figure 7 is provided to illustrate the results of Figure 6 in a more realistic perspective. Here it can be seen clearly that even discrepancies that seem large in Figure 6 are in fact adequate in predicting shoreline variation. The South African Lo 31 WGS84 coordinate system was used in the model, with the following transformation to local model coordinates: Xmodel= 100 000 - YLo31 and Ymodel = 3 500 000 - XLo31.
Model validation
Validation of a model calibration provides a check on the model accuracy. Such validation data should ideally be of a similar nature to that for which the model is to be applied, i.e. similar shoreline responses or discharge rates.
Discharge data
In 1982 a large nourishment of South Beach (approximately Beacon 13) and Addington Beach (approximately Beacon 6) was carried out by a contracted dredging company. A sand volume of approximately 600 000 m3 was placed on the beach in a period of six weeks between August and September 1982. Limited data is available on the precise location or rate of nourishment. The shoreline model was set up to simulate this nourishment event. During the period from July 1982 to November 1983, routine sand nourishments also occurred, amounting to 266 000 m3. These were also included in the model.
Regular surveys of the nourishment area were conducted. The shoreline accreted by between 30 m and 80 m. The surveys were used to validate the model predictions of the shoreline accretion resulting from the nourishment.
Validation results
Similar to Figure 6 the results of the model validation are presented in Figures 8(a) to (d). The RMSEP was utilised to quantify the model prediction accuracy. Not only did the model simulate the large nourishment event accurately, but it also indicated acceptable RMSEP model correlations. In Figure 8 only beacons between the harbour entrance and the piers are given, as this was the area with the largest changes in shoreline location.
The best way to illustrate the accuracy of a longshore transport model is by viewing the results in the form of scaled shoreline changes. In Figure 9 the model results are compared with the measured data. Two dates were chosen which correspond best with the large changes in shoreline location. The conclusion is that the model performs adequately and can thus be used to simulate predictions of possible future scenarios.
FUTURE SCENARIOS
The first and most probable future scenario is the decrease in the amount of sand pumped onto the Durban beaches. There can be many reasons for the decrease in sand supply and the change in sediment characteristics:
■ The dredger might not supply enough sand to the sand pumping scheme.
■ Due to dam building in the rivers in the proximity of Durban, there might be a shortage of sand supply to the sand trap south of the Durban Harbour breakwater, and thus a shortage of sand supply for the Durban beaches. Initially the sand shortage will manifest as erosion on the Bluff beaches, and once these beaches get close to depletion, the sand supply to the sand trap will not be sufficient.
■ The physical characteristics of the sand dredged from the sand trap might also change due to anthropogenic interventions.
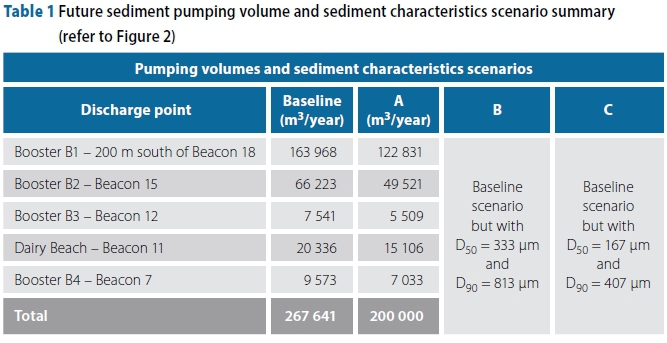
Each of these scenarios was investigated individually. With each scenario only the parameter of interest was varied, while all the other parameters were maintained at the baseline scenario settings. A summary of these scenarios is provided in Table 1. The main aim of simulating these future scenarios is to elucidate the consequences of not maintaining the baseline sand supply amount and characteristics (grain size) to the Durban beaches. All the future scenarios were simulated over a period of twenty years, and the results are given in five-year intervals. For all the simulations done in the future scenario study, the initial shoreline was assumed to be the long-term average existing shoreline.
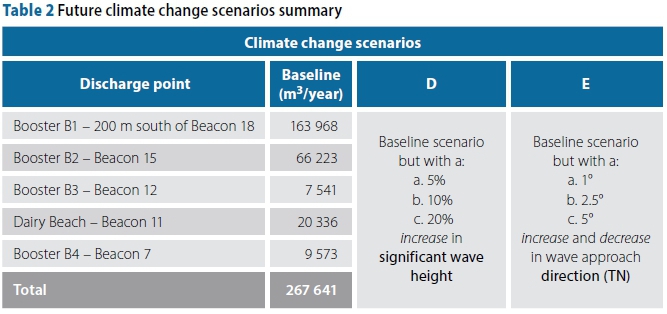
The climate change scenarios were based on a sensitivity analysis approach. Rather than attempting to predict the exact effect of climate change on the incoming wave parameters, the present study aims to investigate the sensitivity of the Durban Bight to changes in only some of the incoming wave characteristics. These types of scenarios can occur if climate change or other physical phenomena change the net movement of weather fronts in the Southern Indian Ocean (Weldon & Reason 2014; Kohfeld et al 2013; Langlais et al 2011; Kostianoy et al 2004). Current research between the South African Weather Service and the South African Environmental Observation Network is quantifying the magnitude of the expected wave height changes and wave directional approach angle changes. To date these estimates are unclear for the southern African coastlines, and thus a range of scenarios are presented here. A summary of the scenarios investigated in the present study is provided in Table 2. Sea Level Rise (SLR) will ultimately also worsen the effects of the scenarios presented here, as the reach of the waves will extend further inland. Studying the effects of SLR is therefore suggested for future shoreline studies (Habets 2015).
The wave climate changes are applied at the point of input into the Unibest model. In all cases this is before wave breaking is expected to occur and the start of what is known as the dynamic zone. In the dynamic zone the depth to which sediment can move is specified. In areas where larger wave energy is expected (towards the north of the Bight, refer to Figure 2) a deeper contour was chosen as dynamic depth and thus a deeper near-wave breaking depth.
RESULTS
The baseline scenario is depicted in Figure 10. For the most part the baseline scenario maintains the Durban beaches at a relatively stable state. The shoreline does not change much from its initial position. The baseline scenario thus establishes a good reference for the future scenarios.
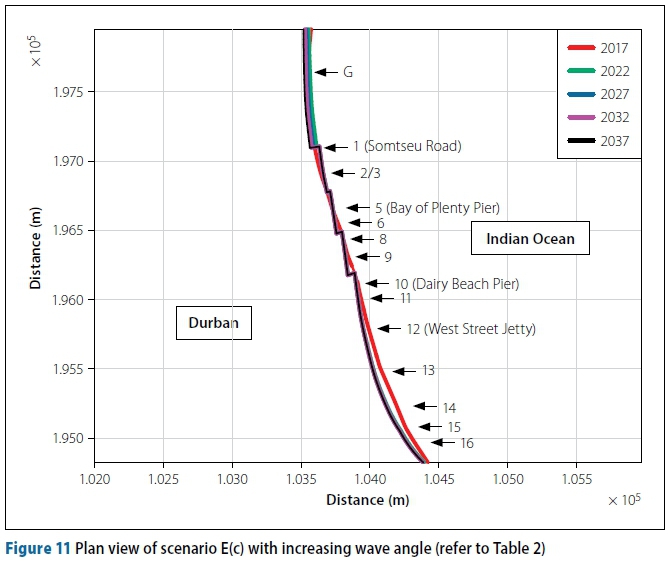
In Figure 11 the shorelines are given from January 2017 to January 2037 if scenario E(c) were to be implemented every year with an increased wave approach angle (i.e. more northerly or southerly).
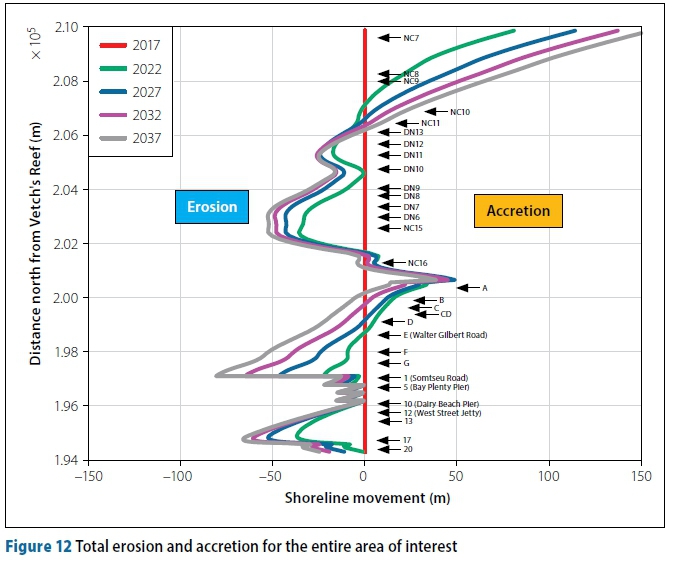
In Figure 11 the erosion and/or accretion are not clearly discernible, even with a zoomed-in map view. Scenario E(c) was chosen to illustrate this, because it was one of the scenarios with the greatest effect on the shoreline movement and yet the shoreline dynamics are still not readily observed. To make the change more visible Figure 12 was created. Here the erosion and accretion are illustrated for the entire area of interest as a function of the distance north of Vetch's Reef.
From Figure 12 it is clear where the most erosion and accretion occurred (refer to Figure 2 for beacon locations in the Bight). Since the wave approach angle will cause the coastline to align with it, the most erosion is observed in the corner of the Bight (Holthuijsen 2007). To the north accretion is observed as the longshore current deposits the sediment that was removed close to Vetch's Reef and the sediment transport rates are decreased due to the wave approach angle. It should be noted that this study is only related to long-term shoreline prediction and that cross-shore processes are not considered. The results, especially between the piers, should be interpreted with care. The shoreline stability between the piers also indicate the effectiveness of these structures in slowing down structural erosion (Bosboom & Stive 2015). The groynes close to beacon A and DN10 also caused local accretion on the down-drift side of these structures.
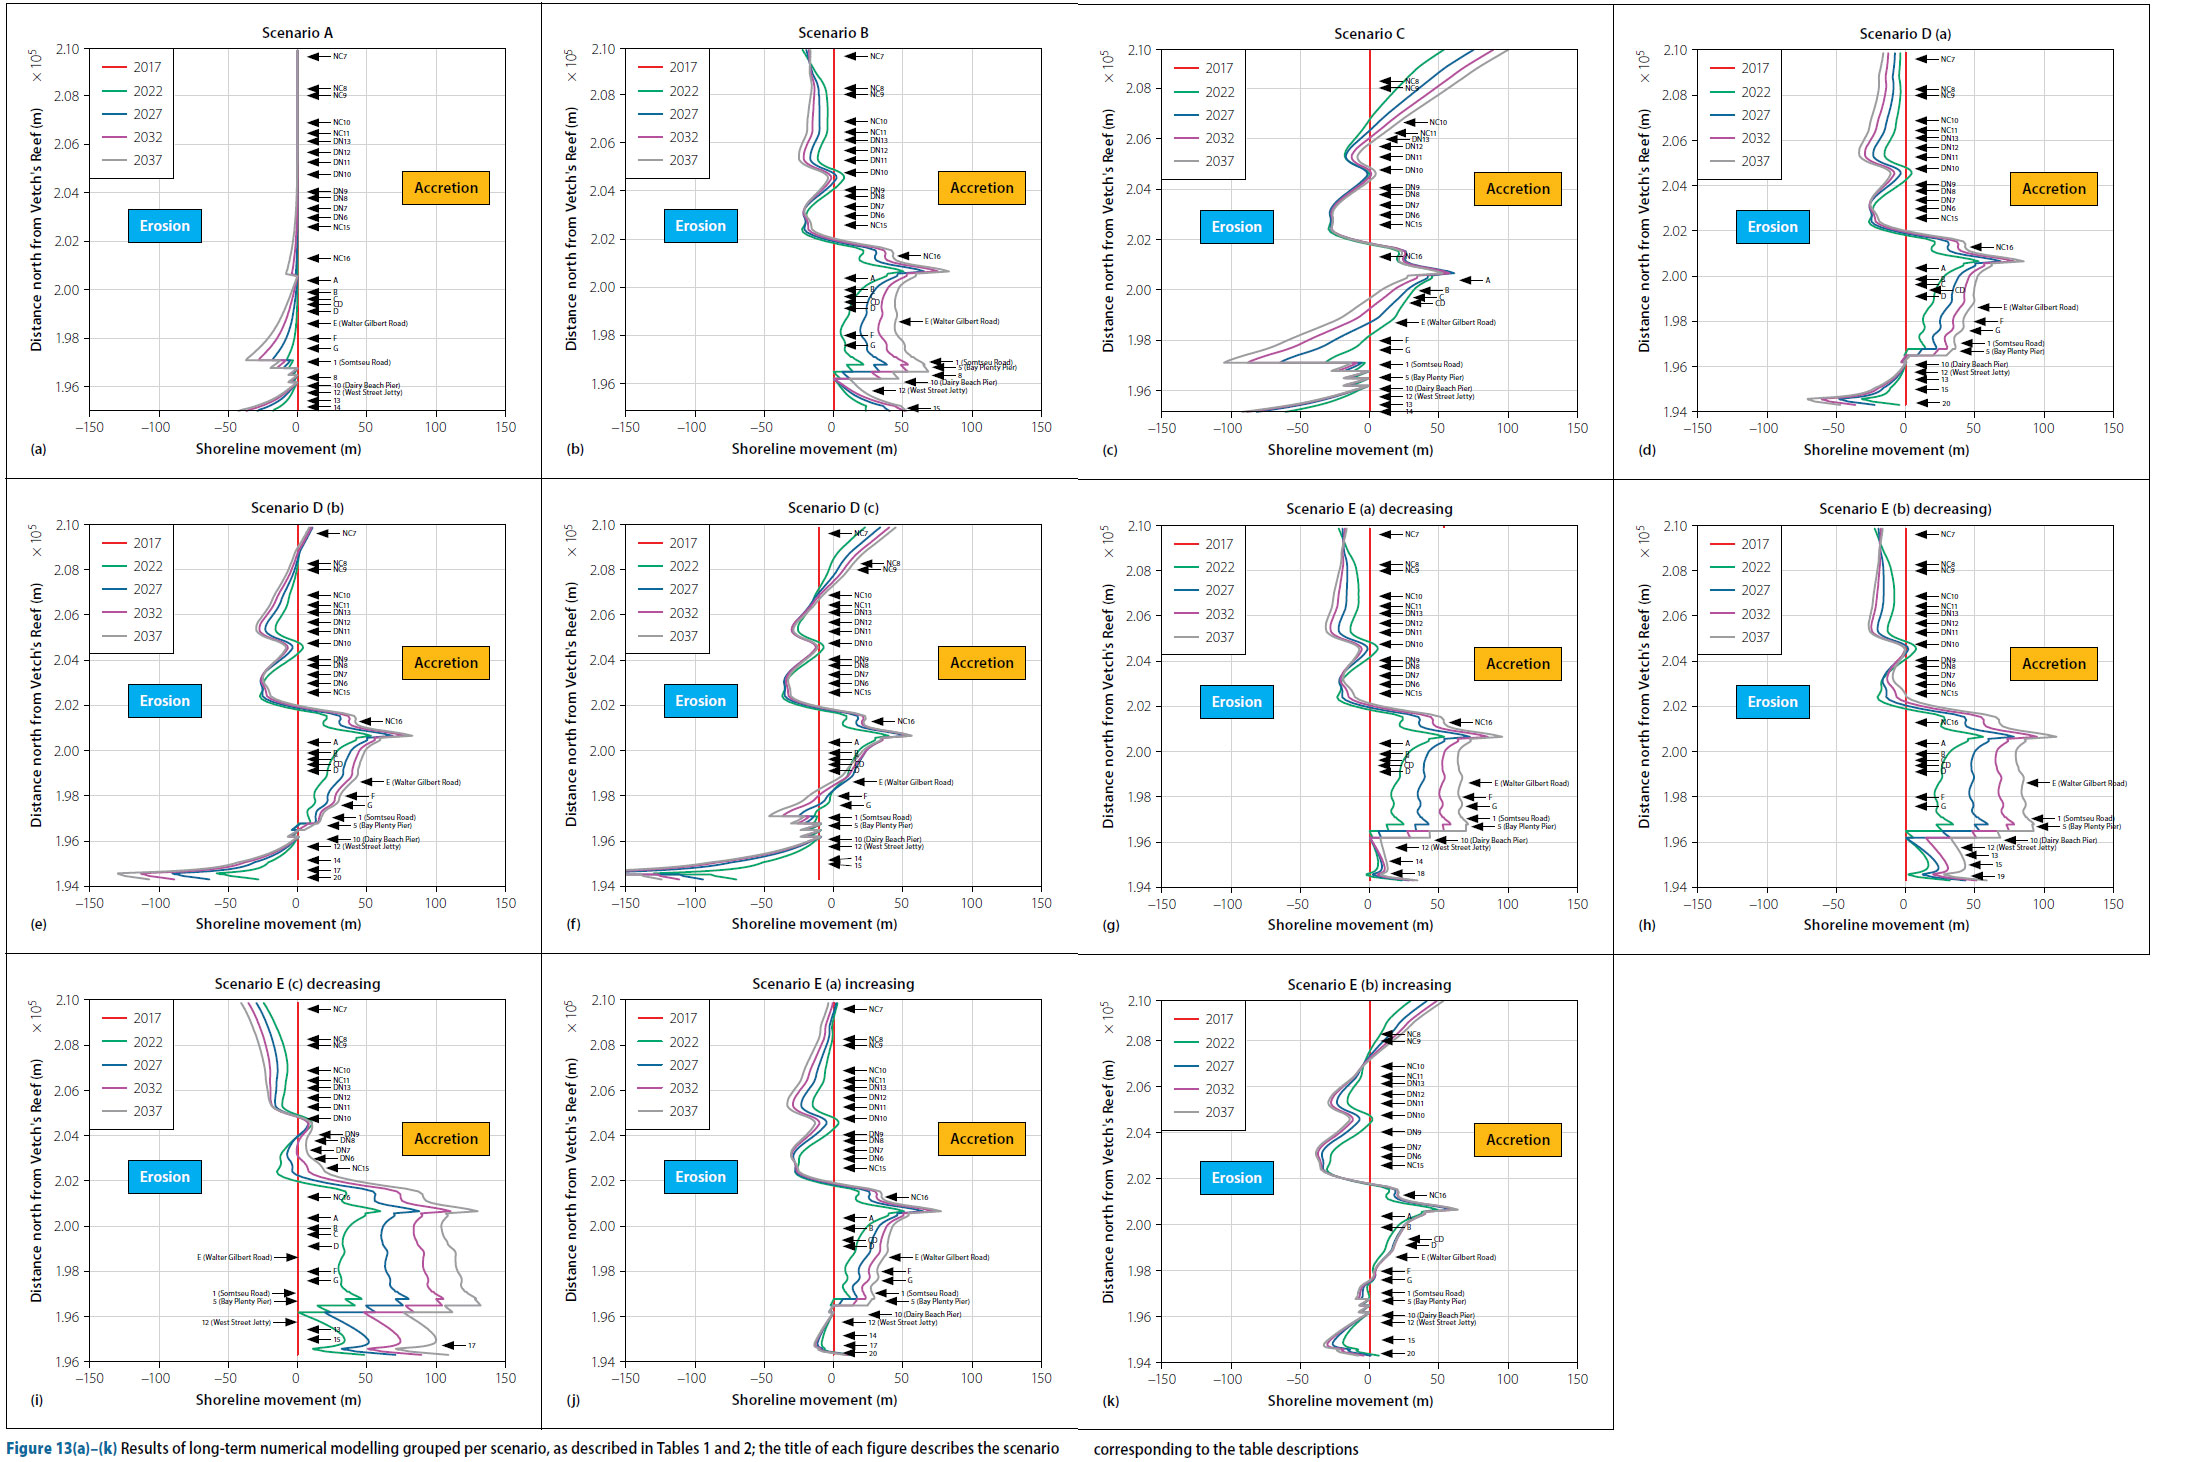
Figure 12 and Figures 13(a) to (k) give all the scenarios summarised in Tables 1 and 2.
DISCUSSION
In Figure 13(a) the scenario is simulated of pumping 25% less sand to the Bight. As expected, erosion occurred especially in the area at the down-drift side of the piers. After twenty years a maximum erosion in the order of 40 m is expected. Erosion is first expected at the southern side of the model, while erosion to the northern part of the model is expected once the southern beaches are depleted of sediments. The stabilisation effect of the piers is again clear in this simulation. In the model the beach width is not constrained, but in reality significant areas of the Bight beaches are backed by hard structures along their landward edges (e.g. by the promenade, parking areas, revetments, etc). Thus, the model may in certain cases predict potential shoreline erosion extending further landward than the actual extent of the existing sandy beach area. In such instances the actual shoreline response will necessarily differ from the simulated response (also depending on the backshore area and possible preemptive intervention measures implemented by the municipality).
In Figure 13(b) the scenario with an increase in sediment size is depicted. In this case accretion is observed in the area close to where the pumping takes place. Further to the north of the Bight erosion is observed, as the heavier sediment cannot readily be transported to this area by means of the longshore currents. The inverse is observed in Figure 13(c), as the finer sediment assumed in scenario C is readily transported northward, thus causing erosion in the corner of the Bight and accretion further northward due to the presence of groynes. In most of these results some areas reach the new equilibrium more rapidly than other areas.
If consecutive years' predictions overlap, it implies that those areas' shorelines have reached its new equilibrium position. From a coastal management point of view these areas will require the least amount of mitigation and/or intervention to maintain future beach stability. In areas where continued erosion or accretion is observed, the gradient of erosion and accretion is still present over time. A decreasing steepness in the gradient is an indication that the shoreline is realigning itself towards its new equilibrium position. The simulations were not run long enough to illustrate the total new equilibrium position of the entire coastline, but it was assumed that the gradient in erosion and accretion provides useful additional assistance to coastal management and governing authorities, for example to identify the areas where the greatest potential future shoreline impacts are expected. The new beach equilibrium may never be reached in the model. In reality the beach profile will flatten and the shallow water waves will dissipate differently towards the shore. This is a limitation of the model that must also be kept in mind, and the beach profile used must be updated with large erosion and/or accretion events.
In Figures 13(d), (e) and (f) an increase in wave height has the net effect of erosion in the corner of the Bight. The increase in wave height can be related to an increase in wave power, and thus the erosion potential increases on the beaches where the longshore current is strengthened. All three percentage increases under scenario D had the same outcome over a twenty-year period. The only aspect that differed was the rate at which the final coastline was reached. The higher the wave energy, the quicker a seemingly new stable coastline was obtained. The area down-drift of the piers, experiencing erosion, also eroded more, and the extent of the erosion increased with an increase in wave height. The amount of accretion observed at the northern extent of the model also increased with increase in wave height. This is a sign that the amount of northwardly transported sediment is increased to such an extent that the sediment will start to build up on the northern beaches. The amount of accretion caused by the groynes also decreased with increase in wave energy.
In Figures 13(g) to (i) the effects of a decreasing wave approach angle (anti-clockwise) is illustrated. Here it can be seen how the waves are reshaping the beaches to adapt to the new approach angle.
The net effect of this scenario is accretion in the corner of the Bight and erosion at the northern beaches. The locations of the erosion and accretion are associated with the increase and decrease in the longshore transport rate associated with the change in wave approach angle.
For the last scenario, the opposite change in wave approach angles was investigated and is depicted in Figures 13(j) and (k) and Figure 12. In this scenario accretion is observed with an increase of one degree in wave approach angle (clockwise). For an increase of two and a half degrees a new equilibrium scenario is reached from 2022 onwards. If the approach angle is increased even further to five degrees (scenario E(c)) progressive erosion is observed. This scenario illustrates some similarities to the increasing wave height scenario D, with similar accretion to the north of the Bight. An increasing wave approach angle of two and a half degrees is thus a critical point between a future progressively eroding or accreting coast (in the southern corner of the Bight for scenarios with an increasing wave approach angle).
The results of the present study illustrate the relative changes in future shorelines based on possible future scenarios. These results must be interpreted as indicative and may be used as a decision support tool for the management of the beaches at Durban. The exact amount of erosion and accretion observed in the future might differ from the results presented here, depending on the actual changes in Southern and Indian ocean (and atmospheric) dynamics (considering model inaccuracies). Once more research is available to quantify these changes, the present study scenario closest to the predicted offshore changes can be readily used by coastal managers. The present study also identifies the areas where potential future intervention might be required, and thus helps coastal managers in planning where to focus their attention and which valuable coastal infrastructure would be most threatened. The potential severity of some of the predicted results should not be underestimated. With dry beach widths along the Durban Bight currently ranging from as little as about 15 m up to about 90 m (measured on Google Earth imagery of September 2017), very little or not much buffer is available on the Durban beaches to tolerate several of the erosion predictions. Erosion of 40 m or 50 m of the upper beach would be catastrophic in many Bight areas, and therefore require earlier sand nourishment if such progressive erosional trends are observed.
A small accreting trend (approximately 1 m per annum) was also observed in both the model and the data at most of the monitoring beacons (refer to Figure 6 for historical records). Analysing these trends fell outside the scope of the current study and is therefore suggested for future research.
CONCLUSION
The shoreline dynamics of the Durban Bight were investigated using numerical models. Calibration and validation were done using existing historical data. The accuracy of the model predictions was quantified using the RMSEP. Once the model was adequately calibrated, the possible future scenarios were simulated. Each parameter was investigated by varying only that parameter and keeping the rest of the input criteria identical to the baseline scenario.
The effects of the four future scenarios were clear. These results were compared with the baseline scenario in which the beaches remained reasonably stable for the twenty-year simulation period. The effect of reducing the sand-pumping volumes was a reduction in beach width. The erosion was particularly extensive in the area between the harbour entrance and the piers. The erosion lessened further north in the Bight, but it can be expected that these beaches will also erode once the sand supply from the southern beaches diminishes in time. In all the future scenarios the piers seemed to reduce the amount of erosion of the beaches resulting from longshore transport.
The other two scenarios involved the alteration of the grain size of sand being pumped onto the Durban beaches. A general increase of 25% in grain size, as well as a decrease of 25% in grain size, had the total effect of erosion on the Bight beaches. The way the erosion occurred was different in that the finer sand particles eroded quickly and then remained relatively stable, while the coarser sand eroded consistently. The dynamics south and north of the piers were also different in both cases, with the finer lighter particles indicating more extensive erosion south and north of the piers.
The effect of climate change might be either erosion or accretion, depending on the scenario and beach location. It is thus also clear that more research is needed to quantify the exact directional and wave energy changes southern Africa can expect in the future. These investigations should also include sea level rise (SLR), as this will increase the reach of the prevailing wave climate and bring about cross-shore beach profile shifts. Given more accurate climatological prediction, the appropriate shoreline evolution scenario may be utilised in the Durban coastal management plan, both to protect existing infrastructure and to design and build new infrastructure with an appropriate setback distance. This study may also inform future studies regarding the general sand budget of the east coast of South Africa, which includes the building of more dams on the sediment-supplying rivers of the east coast. The present study indicated which areas of the Bight were least susceptible to severe shoreline changes, and thus assists the governing authorities in focusing their management strategies to the areas most at risk of future shoreline changes. With knowledge of such potential changes, the eThekwini Municipality will be able to investigate ways to manage and mitigate the potential impacts of wider/narrower beaches, such as blockage of stormwater outlets, windblown sand problems, reduced available beach space for recreational activities and possible effects on the Umgeni River mouth.
Generally, small alterations of the Bight conditions may lead to adverse effects, and thus maintaining the current sand-pumping rates and sediment characteristics are of utmost importance.
ACKNOWLEDGEMENTS
The authors would like to acknowledge eThekwini Municipality for providing the historical horizontal offset data used for the calibration and validation of the present shoreline model. We would also like to thank the Council for Scientific and Industrial Research (CSIR) for providing funding for the development of the shoreline model. We furthermore acknowledge the original report by Christoph Soltau on which this work was based (Soltau & Theron 2007), and we thank Transnet National Port Authorities for providing us with appropriate data.
REFERENCES
Barnett, K A 1999. The management of Durban's beaches: An historical perspective. Proceedings, 5th International Conference on Coastal and Port Engineering in Developing Countries, COPEDEC V, 19-23 April, Cape Town, pp 695-708. [ Links ]
Bosboom, J & Stive, M J 2015. Coastal Dynamics 1. Lecture Notes CIE4305, Vol 0.5. Delft, Netherlands: Delft Academic Press. [ Links ]
Campbell, N P, MacLeod, D C & Swart, D H 1985. Bypassing and beach nourishment scheme at Durban. Proceedings, 26th International Navigation Congress, 16-29 June, Brussels, Belgium, Section II, Subject 3, pp 7-18. [ Links ]
Cawthra, H, Uken, R & Ovechkina, M 2012. New insights into the geological evolution of the Durban Bluff and adjacent blood reef. African Journal of Geology, 115(3): 291-308. [ Links ]
CSIR (Council for Scientific and Industrial Research) 2003. Sediment dynamics in the Durban Vetch's Bight region: Response to proposed harbour entrance developments. CSIR Report No ENV-S-C 2003-087, Stellenbosch: CSIR. [ Links ]
CSIR (Council for Scientific and Industrial Research) 2007. Shoreline accretion predictions in the Durban Bight. CSIR Report, Stellenbosch: CSIR. [ Links ]
Deltares 2005. UNIBEST-CL+6.0. User and Theoretical Manual. Utrecht, Netherlands. [ Links ]
Diedericks, G P, De Wet, P & Theron, A K 2011. On cross-shelf sediment mobility along the Kwazulu-Natal coast. CSIR Report No CSIR/NRE/CO/ IR/0047/A, Stellenbosch: CSIR. [ Links ]
eThekwini Municipality 2010. Official website of the eThekwini Municipality. Available at: http://www.durban.gov.za/Documents/Invest_Durban/Economic%20Development/3_Port_Summary_Doc.pdf [accessed in 2015]. [ Links ]
Garland, G & Moleko, L 2000. Geomorphological impacts of Inanda Dam on the Mgeni estuary, north of Durban, South Africa. Bulletin of Engineering Geology and the Environment, 59(2): 119-126. [ Links ]
Green, A N, Ovechkina, M N & Mostovski, M B 2012. Late Holocene shoreface evolution of the wave-dominated Durban Bight, KwaZulu-Natal, South Africa: A mixed storm and current-driven system. Continental Shelf Research, 49: 56-64. [ Links ]
Habets, F C 2015. Understanding the sediment transport and budgets around the Durban Digout port, South Africa. MSc Dissertation, Delft, Netherlands: Delft University of Technology. [ Links ]
Holthuijsen, L H 2007. Waves in Oceanic and Coastal Waters. New York: Cambridge University Press. [ Links ]
Hugo, P 2013. The impact of climate change effects on the planform of a headland-bay beach on the southern coast of South Africa. MSc Dissertation, Stellenbosch: Stellenbosch University. [ Links ]
Kohfeld, K E, Graham, R M, de Boer, A M, Sime, L C, Wolff, E W, Le Quere, C & Bopp, L 2013. Southern hemisphere westerly wind changes during the Last Glacial Maximum: Paleo-data synthesis. Quaternary Science Review, 68: 76-95. [ Links ]
Kostianoy, A G, Ginzburg, A I, Frankignoulle, M & Delille, B 2004. Fronts in the Southern Indian Ocean as inferred from satellite sea surface temperature data. Journal of Marine Systems, 45: 55-73. [ Links ]
Langlais, C, Rintoul, S & Schiller, A 2011. Variability and mesoscale activity of the Southern Ocean fronts: Identification of a circumpolar coordinate system. Ocean Modelling, 39(1): 79-96. [ Links ]
Mather, A A & Stretch, D D 2012. A perspective on sea level rise and coastal storm surge from southern and eastern Africa: A case study near Durban, South Africa. Water, 4: 237-259. doi:10.3390/w4010237 [ Links ]
Mather, A A & Theron, A K 2011. Recent extreme events along the coast of South Africa. Paper presented at the National Storm Surge Workshop. Knysna: Oceans and Coasts Directorate, Department of Environmental Affairs. [ Links ]
Mather, A, Kasserchun, R & Wenlock, H 2003. City of Durban sand bypassing scheme: 20-year performance evaluation. Proceedings, 6th International Conference on Coastal and Port Engineering in Developing Countries, COPEDEC VI, 15-19 September, Colombo, Sri Lanka, pp 401-402. [ Links ]
Rossouw, M & Theron, A 2012. Investigation of potential climate change impacts on ports and maritime operations around the southern African coast. Proceedings, Maritime Transport and the Climate Change Challenge, United Nations Conference on Trade and Development (UNCTAD), 14 June, London: Routledge, pp 286-298. [ Links ]
Rossouw, M, Davies, J, Coetzee, L & Kuipers, J 1999. The wave recording network around the South African coast. Proceedings, 5th International Conference on Coastal and Port Engineering in Developing Countries, COPEDEC V, 19-23 April, Cape Town. [ Links ]
Schoonees, J S 2000. Annual variation in the net longshore sediment transport rate. Coastal Engineering, 40: 141-160. [ Links ]
Soltau, C & Smith, G 2003. Shoreline modelling applications in southern Africa. Proceedings, 6th International Conference on Coastal and Port Engineering in Developing Countries, COPEDEC VI, 15-19 September, Colombo, Sri Lanka, p 116. [ Links ]
Soltau, C & Theron, A K 2007. Shoreline accretion prediction in the Durban Bight. CSIR Report No ENV-S-C 2007, Stellenbosch: CSIR. [ Links ]
Theron, A K 2007. Analysis of potential coastal zone climate changes and possible response options in the Southern African region. Proceedings, IPCC/ TGICA Regional Experts Meeting on Climate Change, 20-22 June, Nadi, Fiji. [ Links ]
Theron, A K 2015. Dams and sand mining in KZN rivers. Implications for coastal sand budget. Three-day Course on Stormwater, River and Estuary Hydraulics. Stellenbosch University, Department Civil Engineering. [ Links ]
Theron, A K & Rautenbach, C 2014. Proposed Durban dig out port FEL 2 study. Assessment of sediment transport issues. CSIR Report No CSIR/NRE/COAST/2014/ECCS106. Stellenbosch: CSIR. [ Links ]
Theron, A K, Rautenbach, C, Watt, L J & Von St Ange, U 2013. Durban beach monitoring progress report: July 2009 to June 2011. CSIR report number: CSIR/ NRE/CO/ER/2013/C Vol 1. Stellenbosch: CSIR. [ Links ]
Theron, A, Barwell, L, Maherry, A, Luck-Vogel, M, Robberts, W, Terblanche, L, de Wet, P & Araujo, Fm 2012. Responding to climate change in Mozambique. Theme 2: Coastal planning and adaptation to mitigate climate change impacts. Maputo, Mozambique: Ministry of State Administration, National Institute for Disaster Management (INGC). [ Links ]
Theron, A, de Lange, W, Nahman, H & Hardwick, D 2008. Sand supply from rivers within the Ethekweni jurisdiction. Implications for coastal sand budgets and resource economics. CSIR Report No CSIR/NRE/ECO/ER/2008/0096/C, Stellenbosch: CSIR. [ Links ]
Weldon, D & Reason, C J 2014. Variability of rainfall characteristics over the south coast region of South Africa. Theory of Applied Climatology, 115, 117-185. doi:10.1007/s00704-013-0882-4 [ Links ]
Wells, C C 2015. Modelling sand bypass schemes on the KwaZulu-Natal coastline (MSc ed.). Durban: University of KwaZulu-Natal. [ Links ]
 Correspondence:
C Rautenbach
Marine Research Unit, South African Weather Service
PO Box 2981, Paarl 7620, South Africa
T: +27 21 935 5700
E: christo.rautenbach@weathersa.co.za
A K Theron
Department Civil Engineering
Stellenbosch University
Private Bag X1, Matieland 7602, South Africa
T: +27 21 808 4353
E: aktheron@sun.ac.za

DR CHRISTO RAUTENBACH obtained his PhD at the University College of Southeast Norway in 2012 and his MSc cum laude from the Applied Mathematics Department at Stellenbosch University. Immediately after completion of his PhD he started working at the Coastal Systems research group at the Council for Scientific and Industrial Research (CSIR) as a numerical modeller. Ever since he has had both private engineering consulting and public research experience, with emphasis on ocean and coastal waves, shoreline morphodynamics, water quality, integrated coastal management, coastal and estuarine hydrodynamics and marine forecasting. He currently works at the South African Weather Service as the Chief Marine Scientist, with a research, project management and product development role. He also holds an Honorary Research Associate position at the Marine Research Unit at the University of Cape Town, where he is an active partner in postgraduate lecturing and student supervision.

DR ANDRÉ THERON is a senior lecturer in port, coastal and water engineering at Stellenbosch University. He holds a PhD and MEng from the same university, and has specialised in port and coastal engineering for the past 27 years. His fields of expertise are nearshore hydrodynamics, sediment transport, dredging, coastal erosion, planning and design of port/coastal developments, coastal protection and flood defence, estuarine hydro- and sediment-dynamics, and coastal physical environmental studies. He started his career at the Department of Water Affairs, then moved to the Council for Scientific and Industrial Research (CSIR), and joined Stellenbosch University in 2015.

