


Serviços Personalizados
Artigo
 Inglês (pdf)
 Artigo em XML
 Referências do artigo
Indicadores

Links relacionados
-
 Citado por Google
 -
 Similares em Google
Compartilhar

 Permalink
Journal of the South African Institution of Civil Engineering
versão On-line ISSN 2309-8775
versão impressa ISSN 1021-2019
J. S. Afr. Inst. Civ. Eng. vol.60 no.3 Midrand Set. 2018
http://dx.doi.org/10.17159/2309-8775/2018/v60n3a2
TECHNICAL PAPER
Uncertainties in the South African wind load design formulation
J Botha; J V Retief; C Viljoen
ABSTRACT
This paper presents an investigation of the uncertainties inherent in the South African formulation of design wind loads on structures, as stipulated by SANS 10160-3:2011. The investigation follows from the identification of anomalous values in the existing South African probabilistic wind load models during a reliability assessment of SANS 10160. The primary wind load components which have the greatest effect on the total wind load uncertainty are identified as the time variant free-field wind pressure, followed by the time invariant pressure coefficients and terrain roughness factors. A rational and transparent reliability framework for the quantification of the uncertainties inherent in the formulation of these components is then presented. Probabilistic models of these components were developed following independent investigations of each component. The results from these investigations show that the existing probabilistic wind load models underestimate the uncertainty of the wind load components, particularly when considering the time invariant components.
Keywords: wind loading code, wind load uncertainty, probabilistic models
INTRODUCTION
The quantification of wind load uncertainties provides the basis for reliability assessment and calibration of design wind load standards. The random occurrence of severe wind storms provides the primary basis for reliability-based design procedures. However, the derivation of the wind load proper on the structure from the related storm conditions introduces significant biases and uncertainties into the design process. Whereas wind storm conditions are closely related to the strong wind climate of the region, standardised design load procedures have a direct bearing on the additional uncertainties, including provision for all design conditions within the scope of the standard.
Probabilistic wind load models, which represent the uncertainties inherent in the design wind load formulation, are used to calibrate wind load standards in order to achieve target levels of reliability. During the updating process of the South African loading code from SABS 0160:1989 to the current SANS 10160:2010 (republished in 2011), a lack of substantiating information regarding wind load uncertainties was identified by Retief and Dunaiski (2009). The existing South African probabilistic wind load model as presented by Kemp et al (1987) and used in the calibration of SABS 0160:1989 resulted in low reliability requirements for wind loads, as evidenced by comparison
with European wind load models and calibration (Gulvanessian and Holicky 2005). Furthermore, investigation of international wind load models revealed scant background information and details regarding the development of those models. The need was therefore clear for an investigation of wind load uncertainties and the development of a new probabilistic wind load model.
This paper forms part of a series of investigations to update reliability provisions for wind loading in SANS 10160 to account for the South African strong wind climate and wind load uncertainties. Reliability models for strong winds are presented by Kruger et al (2013 a; b). The historic development of strong wind characteristics and the reliability basis for wind loading are presented by Goliger et al (2017), including differentiation in the presentation of the wind climate into the spatial representation of the characteristic wind speed and a temporal model for the random nature of extreme wind. Mapping of the characteristic or basic wind speed for design purposes is presented by Kruger et al (2017). This paper provides probability models for the main sources of variability and uncertainty of wind loading. The final paper incorporates the probability models into a wind load reliability model that could be used to derive a wind load partial factor and to assess the effects of the proposed changes to SANS 10160 on wind loads across the country (Botha et al 2018).
The ultimate purpose of this paper is to lay the foundation for the development of a probabilistic wind load model and the reliability assessment of SANS 10160:2011 using the best available representation of South African wind load uncertainties. To this end this paper presents a general framework for the investigation of wind load component uncertainties and a summary of the results obtained from investigations of those uncertainties within the South African context. The current lack of rational and transparent reliability models of design wind loads is discussed, and serves as the primary motivation for the development of a new model. A generalised overview of the investigations by Botha et al (2014; 2015; 2016) regarding the quantification of wind load component uncertainties is then presented. Both the uncertainties related to the South African strong wind climate and the wind engineering models used to derive wind loads from the fundamental values of the basic free field wind speed are considered.
WIND LOAD PROBABILITY MODELLING
The concept of the "wind loading chain" was introduced by Davenport (1961) and forms the basis of the general design wind load formulation used in most major international wind load standards. The basic probabilistic interpretation of the wind load chain used in the South African wind load standard is given as:
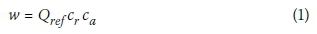
In this formulation the wind load on a structure (w) is defined as the product of the reference gust free-field wind pressure (Qrej), the local terrain roughness factor (cr) and the pressure coefficient (ca). In the general Davenport formulation additional wind load components are included to provide for general model uncertainty (cm) or other sources of uncertainty. The level of approximation of the wind loading chain formulation may be improved by considering additional factors such as the effects of the surrounding topography, the wind directionality and the dynamic response of the structure.
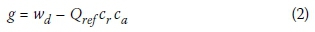
Davenport (1983) emphasised the importance of reliability treatment of wind loads when using the wind loading chain. It was proposed that each wind load component be regarded as a statistically independent random variable, resulting in a full probabilistic description of w. The reliability performance of the codified semi-probabilistic design wind load wd may then be assessed by combining the uncertainties of the individual components as expressed by the reliability performance function:
The probability of failure is then given as Pp = P(g<0), or conveniently expressed in terms of the reliability index ß:
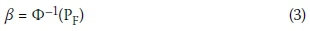
where Ф1 is the inverse normal distribution function.
Review of wind load uncertainties
A convenient framework for the probabilistic estimation of wind loads on structures, considering the wind climate, building exposure to the wind, dynamic properties of the structure and its shape and dimensions, is provided by the Probabilistic Model Code (PMC) (JCSS 2001). Included are terrain categories and associated wind parameters, exposure factors, aerodynamic shape factors, and uncertainties and statistics of related random variables. An assessment of the influence of uncertainties on estimates of extreme wind effects and wind load factors is provided by Minciarelli et al (2001), with consideration of its implications for the provisions of ASCE-7. Subsequent developments, mainly focusing on the implications of tropical storms, have been reported by Vickery et al (2010). Wind load uncertainties are also reviewed by Hansen et al (2015), Holmes (2015), Hong et al (2001) Kasperski (2001; 1993), and Pagnini (2010). The representation of wind load uncertainties in the reliability calibration of design provisions is demonstrated by Baravalle and Köhler (2018).
A review of the development and advances in models for wind pressure on low-rise buildings is provided by Alrawashdeh and Stathopoulos (2015). Although the determination of pressure coefficients related to North American design standards is emphasised, comparison with other standards is included. An outline is given of progress made with the basis for determining pressure coefficients and measurements on which values are based. An extensive set of wind tunnel measurements and full-scale observations are referenced (see also Chen and Zhou (2007)).
The relationship between upwind roughness and turbulence influencing the exposure of low-rise buildings is reviewed by Tieleman (2003a), providing guidance on roughness estimation (Tieleman 2003b). An exposure model which can be used to determine the wind speed to account for homogeneous and inhomogeneous upstream terrain conditions is provided by Wang and Stathopoulos (2007).
Wind tunnel investigations to determine aerodynamic wind pressure coefficients are reported by Endo et al (2006), Doudak et al (2009), Zisis and Stathopoulos (2009), among others. An example of a comparison between wind tunnel measurement and various wind load standards is provided by St Pierre et al (2005).
The compilation of pressure coefficient measurements by Uematsu and Isyumov (1999) provides a convenient record of results for low-rise buildings. In addition to the extensive data set of observations, the different approaches taken by design standards such as ASCE-7 (2010), AS/NZS 1170-2 (2011), EN 1991-1-4 (2005), BS-NA-EN 1991-1-4 (2010), NBCC (2010) provide a suitable basis for assessing the provisions of SANS 10160-3 (2011).
Existing probabilistic wind load models
In the reliability calibration of semi-probabilistic loading procedures, basic single-parameter expressions are often used (Ellingwood et al 1980; Kemp et al 1987; Ellingwood & Tekie 1999; Gulvanessian and Holicky 2005; Holicky 2009). An intermediate approach is to assign probability distributions to the components of the Davenport chain as expressed by Equation (2).
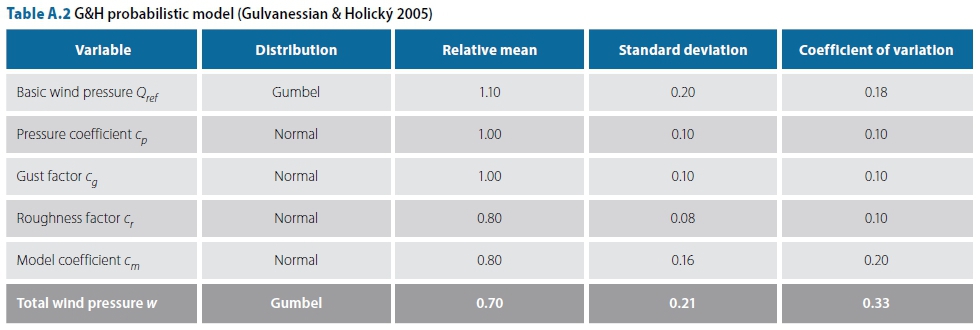
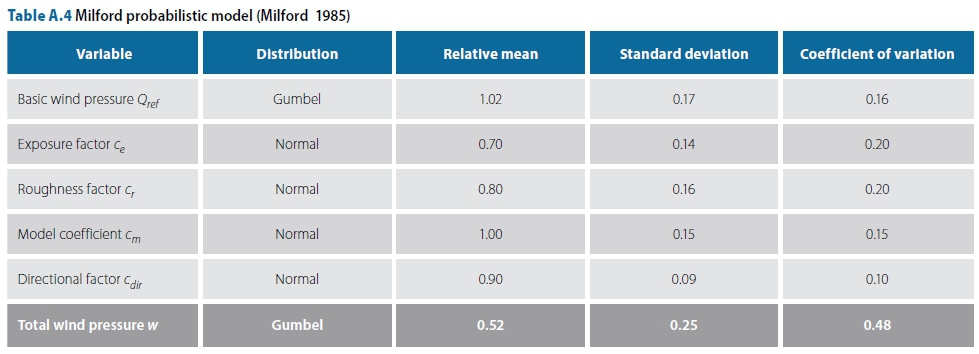
Distribution parameters for the various components and a composite model such as those included in the PMC (JCSS 2001) are listed in Appendix A. Model information includes the probability distribution, the mean relative to the characteristic value (ßx/Xk) and the standard deviation (<7y), from which a coefficient of variation can be obtained (V). Intervals of the distribution parameters indicate ranges of values not only for the basic wind pressure which can be expected to be related to wind climate conditions, but also for the components for converting basic pressure to load. A specific version of the PMC model is used by Gulvanessian and Holicky (2005) to asses Eurocode action combination effects. Another model was developed by Holicky (2009) to validate the Eurocode wind load partial factor, considering the PMC parameter ranges. A probabilistic model was developed by Milford (1985) to reflect South African conditions and serve as a basis for the introduction of a semi-probabilistic limit states South African Loading Code SABS 0160:1989 (Kemp et al 1987). The full set of distribution parameters for each model is listed in Appendix A.
A coherent comparison of the diverse set of probability models for wind load can be obtained by performing a First Order Reliability Method (FORM) analysis by applying model component distributions to a performance function based on Equation (2). The upper tail of the composite model distribution can be obtained by varying wd parametrically and determining the exceedance probability Pp. It is convenient to express Pp in terms of the corresponding //-value as given by Equation (3), although this practice should not be confused with the target //-value used to characterise structural reliability. Since all the models are normalised with respect to characteristic values, they can be compared directly, as shown in pigure 1. Normalisation also implies that wd = 1.0 represents its characteristic value, and its parametric value represents the partial wind load factor (yw) related to the corresponding / -value shown on the graph. It should be noted that a higher variability results in a flatter graph, implying that a larger value of wd (or yw) is required to achieve a given β -value.
Figure 1 provides a graphic illustration of the range of probability models for wind loading, both as given by the shaded region representing the PMC ranges, and between the various models. There is some clustering between the two models directed towards Eurocode assessment by Gulvanessian & Holicky (G&H) and Holicky within the mid-to conservative PMC range. The Milford and Kemp models directed towards South African wind load conditions show similar clustering, but with significantly lower values of yw required to achieve a given β-value, just breaching the PMC range. The main difference between the Eurocode and South African clusters consists of a shift to the left of the latter cluster that can be related to low values of the relative mean (ux / Xk). Differences in slope, related to σx for the variables, are more subtle.
This investigation is motivated by the large differences between the effective probability models for wind loading as demonstrated by Figure 1, differences between the models for the wind load components, systematic apparent underestimating of reliability requirements obtained from the South African models, and a general lack of background information on the models.
FREE-FIELD WIND PRESSURE UNCERTAINTIES
General approach
The free-field wind pressure is the primary source of uncertainty in the design wind load formulation in South Africa. A review of the strong wind climate of South Africa is provided by Kruger et al (2010; 2012), and probability models for the annual extreme wind speed (Vai ) for a set of 76 Automatic Weather Station (AWS) locations (i) across the country are given by Kruger (2011) and Kruger et al (2013a). These Vai models form the basis of the efforts of this investigation to quantify South African free-field wind uncertainties. A brief summary of the pertinent features of the information on which the models are based is therefore given below.
The spatial resolution of the strong wind climate is improved substantially in comparison to previous studies by the increase in AWS locations. Observations are resolved into wind-generating conditions, broadly classified into synoptic scale frontal events, meso-scale convective thunderstorms and mixed climate conditions where both synoptic and meso-scale occurrences are observed. AWS observations allow for the determination of 3 s gust wind speeds which capture the influence of all climatic events and can be applied directly in the design procedure. The observed data were fitted to General Extreme Value (GEV) probability models, with shape parameters (k) ranging between -0.4 (indicating Fisher-Tippett Type III distributions with an upper bound) and 0.5 (Type II, unbounded). Since no systematic trend in the type of distribution could be discerned, the Gumbel (FTI) distribution (k = 0) is regarded as a reasonable approximation, being conservative or more realistic in comparison to Type III and Type II distributions respectively. Peak-Over-Threshold (POT) models are used to extend the number of observations, applying both the Exponential (EXP) and General Pareto Distribution (GPD). The diversity of the South African strong wind climate is reflected in the number of Extreme Value probability models that are required to fit the data. This diversity is a significant source of uncertainty for the reliability model for wind loading for the country.
Models for Va,i are used to derive the 2% fractile values (50-year return period) as the characteristic wind speed (vk,j) for each location (Kruger et al 2013b). The set of vk-values serves as basis for determining the map of the basic reference wind speed (vb,0) as specified by SANS 10160-3 (Kruger et al 2017). This information provides an opportunity to revise the 50-year free-field wind pressure probability model (Qref) (see Equation (2)) developed by Milford (1985) and incorporated by Kemp et al (1987).
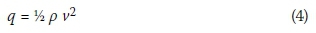
A differentiated approach was followed to estimate the distribution parameters of Qref. Differences in the probability models for Vai are converted into an estimate of the variability (oq) of Qref. Systematic differences between the characteristic wind speed vkand the mapped basic wind speed vb,0 are used to estimate the mean (μQ) of Qref. In both cases wind speed is converted to wind pressure using Equation (4).
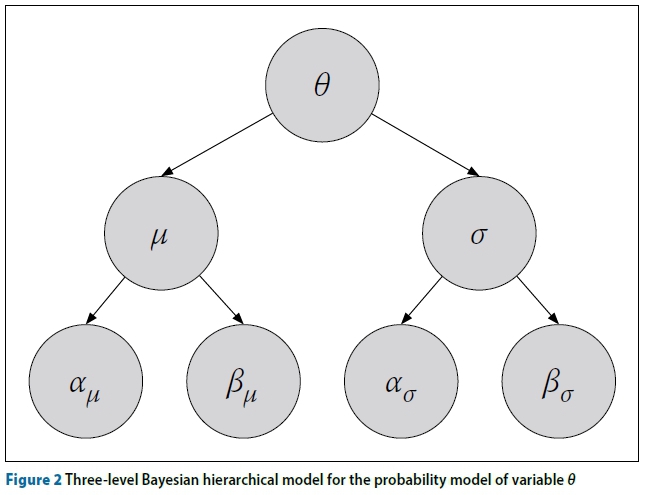
The Bayesian hierarchical approach is used on the premise that the parameters of a given distribution are also random variables (Ang & Tang 1984). Values for the hyper-parameters (au,Q ; Bu,Q) and (a σ ,Q, ß σ ,Q) shown in the hierarchical model (Figure 2, where 6 = Qref) are obtained from the statistics of the 76 samples of the mean (¡q) and the variability (σQ) respectively. The probability models for uQ and oQ are regarded as prior distributions from which the posterior distribution for Qref r is obtained. Monte Carlo simulation is used by repeatedly sampling the sets of hyper-parameters to calculate samples of the parent distribution for Qref, from which statistics for (μQ ; σQ) are obtained. The procedure for Bayesian hierarchical analysis is elaborated by Botha et al (2016).
Prior distribution for the variability σQ
The probability models for the annual extreme wind speed (Va,i) are used to derive models for the 50-year free-field wind pressure (Q50,i) as samples for Qref por this investigation equivalent Gumbel distribution parameters were found for Va,i for stations where Kruger et al (2013a,b) applied exponential distributions using a regression function on the tail end of the distribution. The regression procedure is described by Botha (2016). Va,i can then be converted to a 50-year Gumbel distribution V50,i. The set of probability models for V50 i = Va,i / vk,i is presented graphically in Figure 3.
For this investigation equivalent Gumbel distribution parameters were found for Va,i for stations where Kruger et al (2013a,b) applied exponential distributions using a regression function on the tail end of the distribution. The regression procedure is described by Botha (2016). Va,i can then be converted to a 50-year Gumbel distribution V50,i. The set of probability models for V50,i = Va,i / vk,i is presented graphically in Figure 3.
Since Va,i is based on the best available observations of annual extreme wind, it is assumed that it provides an unbiased model, hence Q50,i is considered to be unbiased as well. Therefore Q50,i is used only to determine the dispersion of Qref providing for both the dispersion of 50-year extreme wind at location i and differences between the set of locations. The standard deviation (σQi) of Q50,i is used as the parameter to characterise its dispersion. A histogram of σQiis presented in Figure 4. A log-normal distribution is fitted to the data set, with the hyper-parameters as the mean (a σ ,Q) = 0.27 and standard deviation (ß σ,Q) = 0.07 as shown. The mean standard deviation of 0.27 can be related to the average slope of the Q50,i probability models depicted in Figure 3.
Prior distribution for the mean uQ
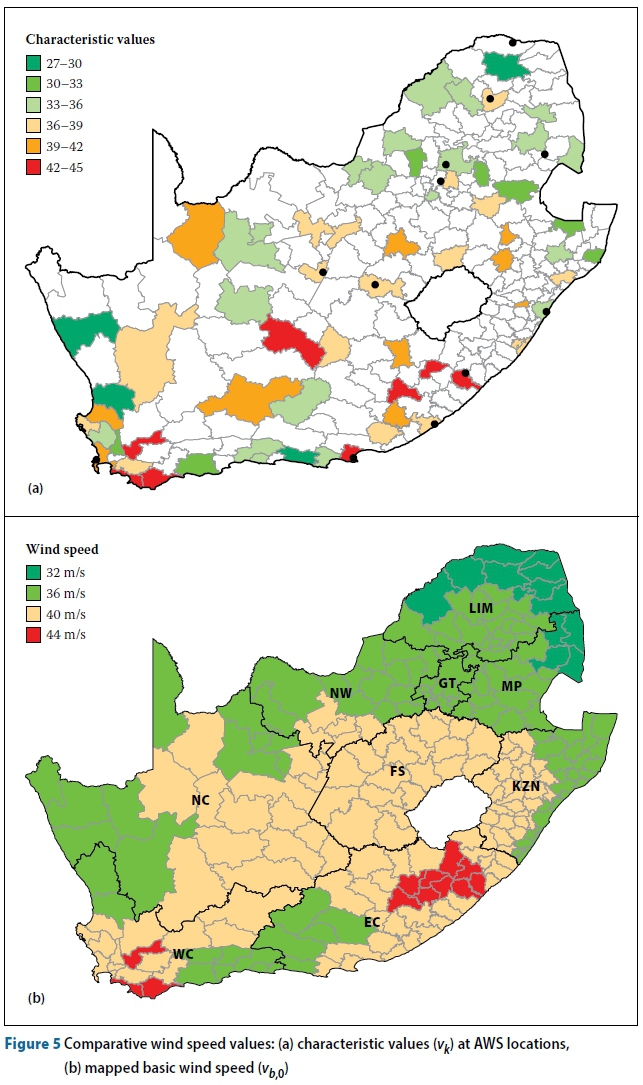
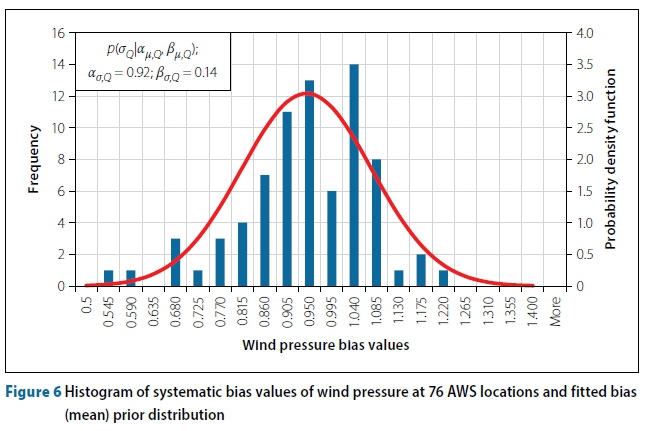
The ratio of the "true" characteristic wind speed at each AWS location (vk) obtained from Kruger (2011) (see Figure 5(a)) and the mapped basic wind speed (vb,0 proposed for SANS 10160-3 (see Figure 5(b) in Kruger et al (2017)) represents a systematic bias in Q50,i. A probability distribution for the bias of Qref can be obtained from the statistics of the set of wind speed ratios, squared to represent wind pressure. A histogram of wind pressure bias is shown in Figure 6, including a fitted normal distribution, with the hyper-parameters as the mean (au,Q) = 0.92 and standard deviation (ßu,Q) = 0.14 as shown. The mean of less than 1,0 implies a conservative bias of 8% resulting from the specified basic wind speed, although this is less than one standard deviation from an unbiased mean.
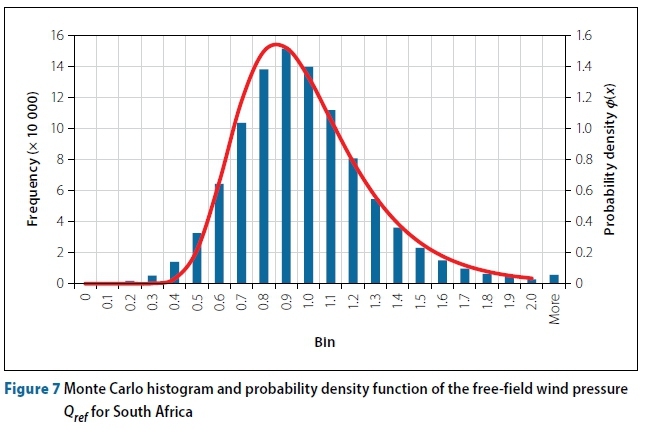
Bayesian hierarchical analysis of Qref
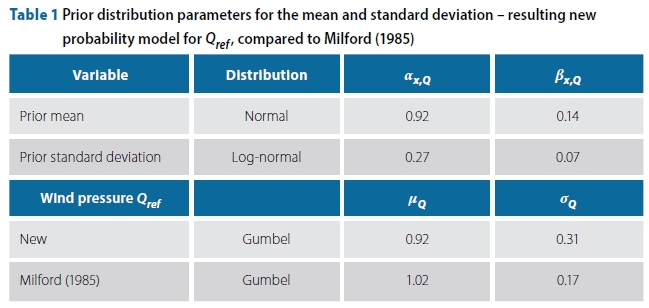
Based on the distribution hyper-parameters for the priors of the mean and standard deviation as summarised in Table 1, a set of realisations of Qref were determined as given by the histogram and probability distribution shown in Figure 7, using the Monte Carlo simulation technique outlined above.
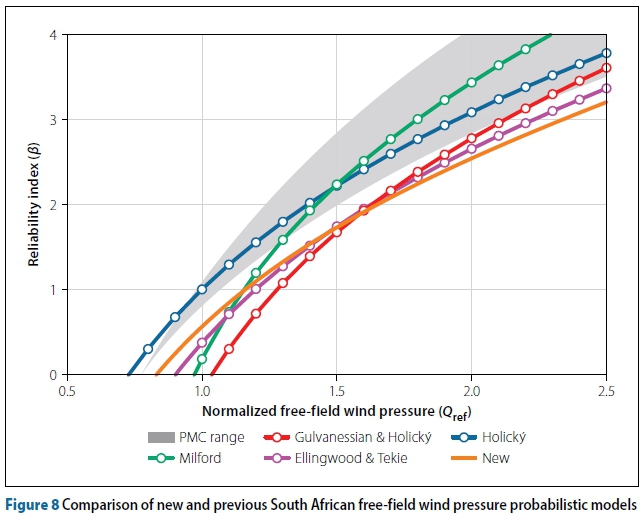
The upper tail of the probability distribution for the 50-year base free-field wind pressure Qref is shown in Figure 8. The exceedance probability is expressed in terms of the reliability index (β) using Equation (3).
Assessment
As the comparison of free-field wind pressure distributions for different regions is not directly applicable, the most important result from this analysis is the comparison of the new model and the previous South African model developed by Milford (1985). It is seen that the new model is significantly different from the Milford model, with a lower systematic bias and higher variability. The high variability of Qref can be directly related to the statistics for the annual extreme wind (Va,i) with an average CoV of 0.12 (ranging from 0.04 to 0.25) for wind speed, and approximately 0.24 for wind pressure. The variability of Qref indicated by a CoV of 0.31 therefore seems to reflect strong wind conditions for the country. No substantial systematic bias could be expected, except for that resulting from the mapping of the characteristic wind speed. A different picture could be expected from an improvement in the underlying data set due to the extended recording period and geographical coverage of the AWS network. Nevertheless, the present model is based on a substantial improvement in information on the South African wind climate.
RELIABILITY METHODS FOR INVESTIGATION OF TIME INVARIANT COMPONENTS
In order to quantify the uncertainties inherent in the time invariant wind load components, potential sources of information needed to be identified and reliability methods for the treatment of that information had to be established. Two such sources of information were identified. The first was the direct comparison of codified values with data obtained from observations, and the second was using the comparison of the codified values stipulated in different major international wind load standards as an indicator of wind load uncertainties.
Comparison of codified values and observed values
Direct comparison of model values and measured values is a standard statistical technique, and is the most effective way of quantifying model uncertainties. By this method the codified values of a given standard are compared to data obtained from wind tunnel and full-scale tests. The statistical parameters estimated by this method predominantly reflect the aleatoric uncertainties of the component. The epis-temic uncertainties inherent in measuring data (Holicky et al 2015) should, however, be noted when wind tunnel or full-scale observations are used. Furthermore, the lack of standardised testing methods and the use of tests of various types may reflect greater variability than the true variability of the pressure coefficients. These factors are described in greater detail by Botha (2016).
The greatest drawback of this method relates to the scope of the investigation. As this study aims to investigate a representative portion of the scope of the South African wind load standards, this method requires a large number of observations from multiple tests as each observation only provides information regarding a specific design situation. It is not feasible to obtain information across a sufficient range of design situations within the sample space of this investigation, and therefore the statistical parameters estimated by this method will be based on a limited set of observations.
Comparison of wind load standards
The second source of reliability information used was an expert opinion analysis approach in which the wind load standards are considered as experts (or bodies of experts). The use of comparison wind load standards in reliability analyses is not without precedent (Kasperski 1993; Bashor & Kareem 2009; Kwon & Kareem 2013). Furthermore, expert opinion analysis is a well-established and accepted reliability technique in situations where limited observed data are available, but experts with empirical knowledge may be consulted. By combining these methodologies, an effective reliability technique for the quantification of wind load uncertainties was developed.
Wind load standards are developed by wind engineering experts using the best available information at the time of development. It therefore stands to reason that the wind load standard itself is representative of the empirical and theoretical knowledge from all sources used in its development. By accepting that wind load standards may effectively be regarded as "experts", it may be concluded that differences between the stipulations of different wind load standards are indicative of the uncertainty in the wind load formulation. The primary advantage of this method is that all design situations which fall within the scope of applicability of the wind load standards may be investigated and a truly representative statistical model of wind load uncertainties may be developed.
There are a number of weaknesses in the use of comparison of standards as a reliability technique. These weaknesses are a result of uncertainties in the codification process of the standards, such as the simplification of the formulation to allow operational models which accommodate a large scope of design situations, and the potential conservatism built into components in order to achieve a desired total wind load from the overall formulation of the standard. Certain measures were taken during the implementation of the method in order to counteract these weaknesses and ensure that the most representative results possible were obtained. To this end a comparative algorithm was developed by Botha (2016) to ensure unbiased sampling. It was verified that the wind load standards considered were completely independent and did not share the same background information, and all the comparisons were done across a large scope of design situations in order to smooth out any specific discrepancies between the standards to obtain results representative of the general case.
PRESSURE COEFFICIENT UNCERTAINTIES
Pressure coefficients are subject to a large number of uncertainties, both aleatoric and epistemic. The first and arguably largest sources of uncertainty in pressure coefficient values are the tools used to measure them, namely boundary layer wind tunnel tests. Comparison of more than 200 research papers on low-rise buildings by Uematsu and Isyumov (1999) found significant variation in the results obtained from wind tunnel tests on the same structures. This variability in wind tunnel test results is primarily due to different wind tunnel configurations. Furthermore, it stands to reason that the equivalent static wind load distributions selected for the purposes of codification contribute to the epistemic uncertainty of pressure coefficients. Finally, the inherent ale-atoric uncertainty in pressure coefficients also contributes to the variability of the results.
The uncertainties inherent in the codified pressure coefficients given in SANS 10160-3 were quantified using the two methodologies described in the previous section. The investigation was limited to external pressure coefficients resulting in global wind loading on regular low-rise structures. Local peak pressure coefficients such as component and cladding pressure coefficients were not considered. The scope of the structures considered in the investigation included flat, mono- and duo-pitched roof structures with a pitch angle between 0° and 30°.
Comparison of codified values with observed values
The first methodology used in the investigation of pressure coefficient uncertainties was direct comparison of codified pressure coefficients with observed values from wind tunnel and full-scale tests. After a rigorous literature study, ten studies were selected from international journals, with a focus on those which presented both full-scale and wind tunnel test results to obtain representative results. The observed values from these studies were compared to the SANS pressure coefficient values. This was done by determining the codified pressure coefficients at the positions across the reference structures used in the above-mentioned studies where pressure coefficients were measured. The measured values could therefore be directly compared to the codified values, and by using standard normalised variables the results across all the observation points for each structure could be sampled to obtain a statistical representation of the global pressure coefficient uncertainty. The full methodology is presented by Botha (2016). In addition to the statistical parameters of the overall structure, the parameters were also calculated separately using the systematic bias values measured on walls and roofs. A summary of these properties is presented in Table 2.
It is shown from the bias values that the measured pressure coefficients are systematically higher than the codified values for roofs and lower than the codified values for walls. This is effectively hidden when the bias across the entire structure is considered, as the roof and wall bias values effectively cancel each other out and a total systematic bias near unity is obtained. The disparity between the roof and wall systematic bias is, however, reflected in the increased variability seen for the overall structure parameters.
Comparison of international wind load standards
The second methodology used to investigate pressure coefficient uncertainties was the comparison of codified values from major international wind load standards. A software package was developed as an implementation of the comparative algorithm developed by Botha (2016) to perform a parameter study of codified pressure coefficients. The wind load standards considered were: SANS 10160-3 (South Africa), BS NA EN 1991-1-4 (United Kingdom), AS/NZS 1170-2 (Australia and New Zealand), ASCE 7-10 (USA), NBCC 2010 (Canada).
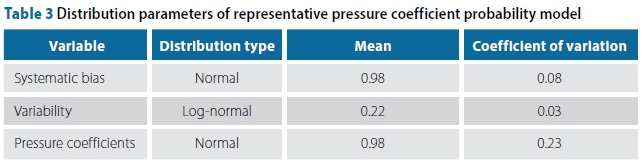
A full description of the calculation procedure used in the parameter study is given by Botha (2016). The software package was developed and used to perform over 3.5 million individual comparisons in the parameter study, resulting in 2 512 data points for comparison. Steps were taken to avoid unbiased sampling of the parameter space, resulting in a reduced set of 60 statistically independent values which were ultimately sampled. A hierarchical model was used to combine the information obtained about the pressure coefficient systematic bias and variability into a single posterior representative distribution. The two prior distributions and the final representative distribution of SANS pressure coefficients are given in Table 3.
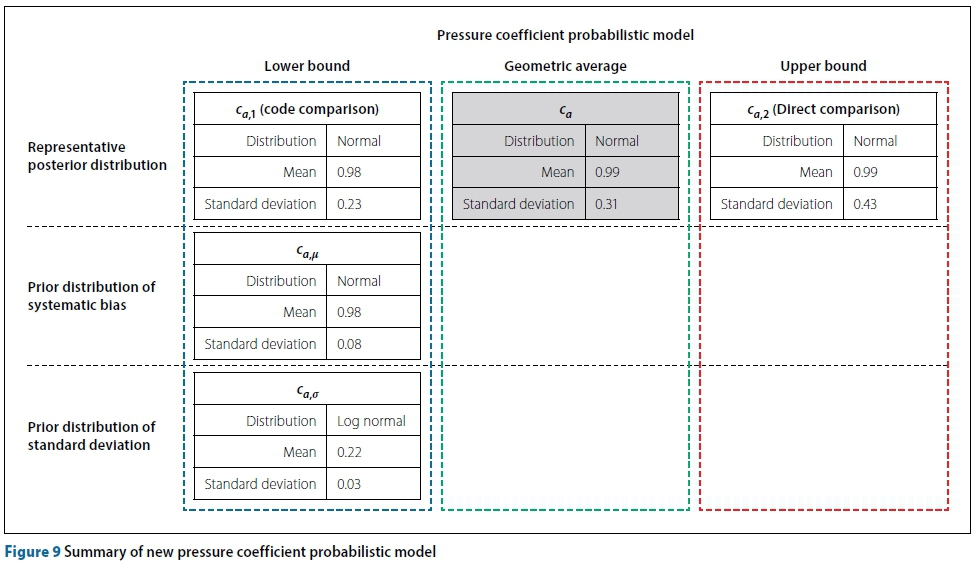
New pressure coefficient probability model
A summary of the representative probability distributions of pressure coefficients (ca) calculated in each of the investigations is shown in Figure 9. The new model is not a single model, but rather three separate models consisting of lower and upper bound approximations and an average distribution selected from the range between the limits. Even though a single distribution will be selected and used for reliability assessments of the South African loading code, the final results of this investigation should not be viewed as a single distribution of pressure coefficient uncertainties, but rather as an envelope of possible values that may be narrowed through future research.
The new pressure coefficient model was compared to the corresponding component distributions in existing probabilistic models. The tail-end reliability indices of these distributions are shown in Figure 10. All three new distributions (lower bound, upper bound, and geometric average) defining the pressure coefficient uncertainty envelope are included in the figure.
With the exception of the Milford model, all the models have similar bias values, with a large spread in the variability values. The new models have a significantly greater variability than most of the existing models, resulting in a flatter distribution with lower reliability indices at higher pressure coefficient values. Nonetheless, the region bounded by the new model mostly falls within the JCSS envelope of recommended values. Although the sources used to develop the JCSS models are not clear, they suggest that the high variability obtained for pressure coefficients in this investigation is reasonable.
TERRAIN ROUGHNESS FACTOR UNCERTAINTIES
There are two primary sources of uncertainty which contribute to the uncertainty of terrain roughness factors. The first is the use of terrain roughness factor profiles to divide a continuum of possible values into zones based on terrain categories. Whenever a designer selects a representative terrain category for a specific site, the terrain roughness factor is rounded up to the closest approximate terrain category as stipulated in the wind load standard considered. This makes the general wind load standard representation of terrain roughness factors inherently conservative. The second source of uncertainty is the variability inherent in the definition of representative terrain categories. Although the qualitative descriptions of terrain categories provided by most sources are similar, there is no consensus on the exact parameters used to define the terrain roughness factor profiles for those terrain categories. The lack of agreement between wind load standards when considering the same terrain type is an indication of the epistemic variability of terrain roughness factors.
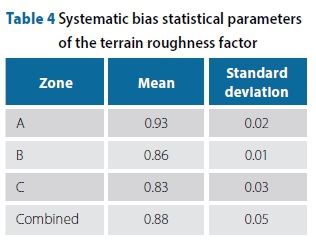
The systematic bias distribution of the terrain roughness factor was determined using the method of the comparison of codified values and observed values. The SANS terrain roughness factor stipulations were compared with a baseline model by Wang and Stathopoulos (2007), which has been verified using experimental data. The method used to quantify the bias prior was described by Botha et al (2015). Briefly described, the equivalent terrain roughness factor profiles from SANS 10160-3 and the baseline model were compared at 1 m height increments up to a height of 50 m. The systematic bias due to the use of terrain categories was calculated for the zones bounded by the baseline model between the equivalent SANS Terrain Categories A and D. The results of the investigation are given in Table 4. As expected, the terrain roughness factors show a fair degree of conservatism.
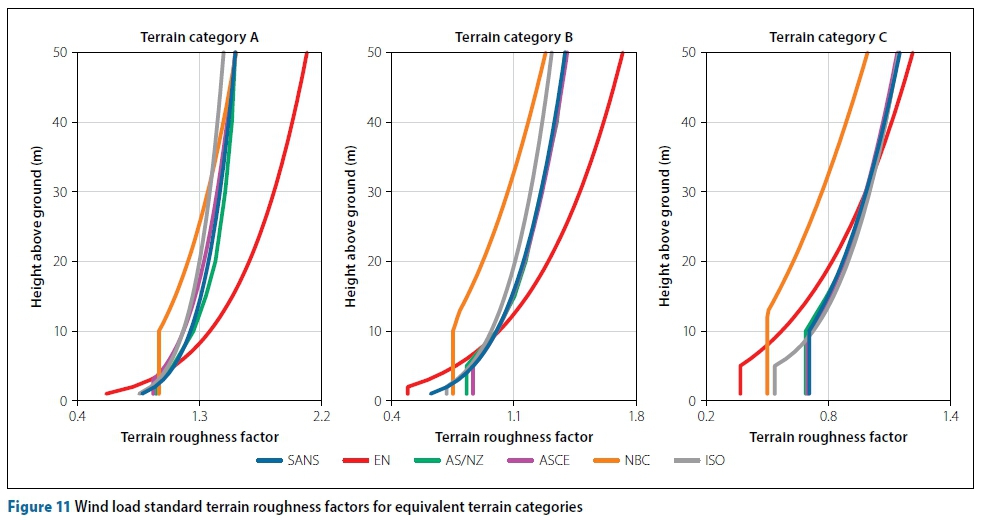
In order to quantify the epistemic variability in the selection of terrain roughness profiles, a comparative study of wind load standards was done using the comparative algorithm developed by Botha (2016). The set of standards used in the investigation consisted of SANS 10160-3 (South Africa), EN 1991-1-4 (Europe), AS/NZS 1170-2 (Australia and New Zealand), ASCE 7-10 (USA), NBCC 2010 (Canada) and ISO 4353 2009 (International). Three representative terrain categories were chosen, namely Terrain Categories A, B and C in SANS. To be consistent, the free-field wind speed roughness factors used by SANS, Eurocode, AS/NZS and ISO were squared to make them equivalent to the ASCE and NBCC values based on free-field wind pressure.
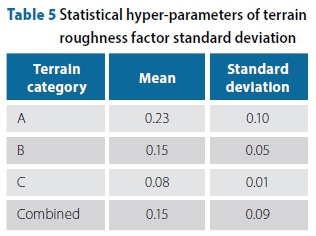
The equivalent roughness factor profiles for each representative terrain category after squaring the appropriate values are shown in Figure 11. The comparison of these profiles was used to determine a distribution of the terrain roughness factor standard deviation. The results are given in Table 5.
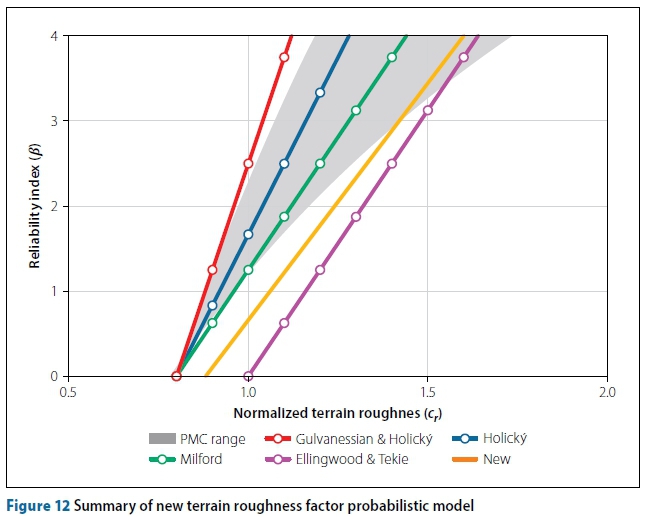
New terrain roughness factor component model
As in the free-field wind pressure and pressure coefficient investigations, the new component model was compared to the equivalent component models from existing probabilistic wind load models. The tail-end component reliability indices of the distributions are shown in Figure 12.
The new model shows lower reliability indices than most of the existing models due to a higher bias. The variability of the new model corresponds well to the existing models. As a result, the new model falls within the JCSS envelope at higher reliability indices, albeit close to the upper limit.
CONCLUSIONS
This paper addresses the underlying reliability basis for the design for wind loading on structures, specifically as provided for in SANS 10160-3:2010. The need for such an investigation is due to inconsistencies between the provisions in the standard and corresponding Eurocode procedures and standardised practice for loading in general, specifically with regard to the partial load factor. The diversity of probability models for wind load compounds the difficulties of deriving design procedures.
The approach followed was to use the latest information on the South African strong wind climate to develop probability distributions for wind load. However, wind load probability models include provision for the wind engineering processes of converting free-field wind pressure into the distributed load across the structure.
The approach followed to reconsider time-independent components of the Davenport wind loading chain was to compare measurement-based results to standardised model results for limited but representative situations. The scope of the investigation was then extended and complemented by comparing procedures from a set of design standards. The investigation considered provisions for terrain roughness and pressure coefficients for global load on the structure as the most significant time-independent wind load components.
General results
The resulting probability models for the three Davenport wind loading components are summarised in Table 6 in terms of the distribution and its parameters. As a general observation, in comparison to the models summarised in Appendix A, these show less conservative bias, with the mean value closer to 1.0, together with larger coefficients of variation.. This implies that insufficient reliability is achieved for design procedures based on present models. Reduced conservatism in the bias and larger variability apply not only to the wind climate probability model, which may be ascribed to better information on South African conditions, but also to the time-independent components, which could be expected to be consistent with international practice. The results should therefore be scrutinised to ensure that they are reasonable.
Free-field wind pressure Qref
Although the distribution for Qref can be regarded as uniquely related to the wind climate, the present results lie at the upper limit of the range indicated by the JCSS model. As indicated in the assessment of the results for the Qref probability model, the basic data for the annual extreme wind speed with an average CoV of 0.12 place a lower limit of about 0.24 on the CoV of wind pressure. The additional uncertainty due to regional differences in wind speed statistics results in an increased CoV for Qref of 0.31.
The use of a Gumbel distribution for Qref may be open for review. It is nevertheless clear that regional differences in the EV tail is so significant that refining the Gumbel tail approximation is not justified at this stage. Furthermore, the extreme value extrapolation is limited to return periods well below 1 000 y in accordance with the reliability target for structures within the scope of SANS 10160. The application of the Gumbel distribution is, however, not inconsistent with the practice followed by the models given in Appendix A. The exception is the JCSS model where a log-normal distribution is indicated, which is somewhat unusual for modelling extreme value phenomena. The use of the Gumbel distribution is consistent with the background information provided by Kruger et al (2013a, b).
A recent assessment of the use of the Gumbel distribution for the calibration of wind load reliability parameters by Baravalle and Köhler (2018) confirms the validity of the approach taken here. In addition to using a Gumbel tail approximation for the calibration of standardised wind load provisions, the combination of the mean Gumbel tail with uncertainties due to regional differences is used to derive a single model for the region as a whole.
Additional examples of the use of the Gumbel approximation for wind storm modelling are provided by Hansen et al (2015), Xu et al (2014), and Holicky (2009). Unreasonable GEV distribution parameters for 235 stations across Canada are reported by Hong and Ye (2014), which are similar to the results obtained for South Africa (Kruger et al 2013a). Harris (2014) advises that Fisher-Tippett Type II and TYPE III asymptotes are not confirmed by wind data, and that the Gumbel distribution is the safe and sensible assumption when the analysis indicates the Type III distribution.
The true nature of EV asymptotes can be investigated from a time series simulation of the parent macrometeoro-logical wind speed from which simulated annual extreme wind speed values are extracted (see Harris 2014; Torrielli et al 2013). Various EV models can then be assessed against the simulated EV record. Indications are that Gumbel extrapolation to reliability levels for important structures may be inadequate, but may be mildly conservative for the reliability classes provided for in SANS 10160. Such general trends can also be observed from the assessment of alternative EV models reported by Rózsás and Sykora (2016). Direct simulation through reanalysis of synoptic wind conditions provide an alternative approach to reflect the South African wind climate (Larsén and Kruger 2014), although con-vective wind storms are excluded from all these simulation techniques.
Pressure coefficients
A surprising result is the large uncertainty obtained for the basic set of pressure coefficients for a well-defined scope of structures for which the static equivalent wind loading procedure is widely accepted. Most significant is that this outcome is primarily based on the direct comparison between experimental measurements and code pressure coefficients as summarised in Table 2. The large standard deviation of the model factor for pressure coefficients can be observed not only for individual test series, but also as a result of differences in mean values between data sets, even systematic differences between roof and wall loads. Although the comparison between various standards is intended primarily to allow the scope of application to be covered more comprehensively, it turns out that the model for pressure coefficients is dominated by the model uncertainty based on measurement (see Figure 9). Comparison of standards nevertheless provides useful insight into the differences between reputable design standards.
Terrain roughness factor
The most significant contribution to uncertainty in provision for site conditions results from the representation of the wind speed profile as a result of upstream terrain roughness. The comparison is done for clearly defined terrain categories. In this case the uncertainties are primarily derived from the comparison of standardised procedures. The wind speed profiles shown in Figure 11 clearly demonstrate the significant differences between standards, which can only be accounted for as a form of epistemic uncertainty. Direct comparison between standard and experimentally based wind speed profiles mostly result in systematic bias.
Although uncertainties in the representation of terrain roughness for standardised conditions are the lowest for all cases under consideration, with a standard deviation of acr= 0.18, they are nevertheless significant, and again beyond the upper ranges of values reported in the literature.
The way ahead
The next logical step is to apply the probability model for wind loading to reassess the reliability performance of South African standard SANS 10160-3. This should be done not so much to establish the implications of the results presented here, but because the need for such an assessment was the primary motivation for the investigation. At the same time, the new map for the basic wind speed proposed by Kruger et al (2017) results on average in a reduction in wind speed. On the other hand, the proposed probability model is bound to result in an increase in the wind load factor to comply with reliability levels that apply to design standards. Simultaneous implementation will limit the impact of the changes while improving the consistency of the intended reliability of structural design.
Each step taken in the assessment of the probability model for wind loading is open to refinement. The procedure presented here could therefore be extended by using updated information on the wind climate, increasing the scope of experimental data to quantify model uncertainty, and even using more advanced models for wind loading components to reduce epistemic uncertainty.
REFERENCES
Alrawashdeh, H & Stathopoulos, T 2015. Wind pressures on large roofs of low buildings and wind codes and standards. Journal of Wind Engineering and Industrial Aerodynamics, 147(1): 212-225. [ Links ]
Ang AH-S & Tang W H 1984. Probability concepts in engineering planning and design: Volume 2 Decision, risk and reliability. New York: Wiley. [ Links ]
ASCE (American Society of Civil Engineers) 2010. ASCE7- 10. Minimum Design Loads for Buildings and Other Structures. ASCE, Structural Engineering Institute. [ Links ]
AS-NZS (Australia-New Zealand Standards) 2011. ASNZS1170-2. Structural Design Actions. Part 2. Wind actions. Standards Australia Limited/Standards New Zealand. [ Links ]
Baravalle, M & Köhler, J 2018. On the probabilistic representation of the wind climate for calibration of structural design standards. Structural Safety, 70: 115-127. [ Links ]
Bashor, R & Kareem, A 2009. Comparative study of major international standards. Proceedings, 7th Asia-Pacific Conference on Wind Engineering, Taipei, China. [ Links ]
Botha, J, Retief, J V, Holicky, M & Barnardo-Viljoen, C 2014. Development of probabilistic wind load model for South Africa. Proceedings, 13th Conference of the Italian Association for Wind Engineering, 22-25 June, Genoa, Italy. [ Links ]
Botha, J, Retief, J V & Viljoen, C 2015. Variability of time-independent wind load components. Proceedings, 12th International Conference on Applications of Statistics and Probability in Civil Engineering, 12-15 July, Vancouver, Canada. [ Links ]
Botha, J 2016. Probabilistic models of design wind loads in South Africa. PhD thesis. Stellenbosch: Stellenbosch University. http://hdl.handle.net/10019.1/100058. [ Links ]
Botha, J, Retief, J V & Viljoen, C 2016. Application of Monte Carlo method for the reliability treatment of wind load variables using Bayesian hierarchical models. Proceedings, 6th International Conference on Structural Engineering, Mechanics and Computation, 5-7 September, Cape Town. [ Links ]
Botha, J, Retief, J V, Viljoen, C 2018. Reliability assessment of the South African wind load design formulation. Journal of the South African Institution of Civil Engineering, 60(3): 30-40. [ Links ]
BS (British Standard) 2010. BS NA EN 1991-1-4. UK National Annex to Eurocode 1: Actions on Structures. Parts 1-4. General Actions-Wind Actions. British Standards Institution. [ Links ]
Chen, X & Zhou, N 2007. Equivalent static wind loads on low-rise buildings based on full-scale pressure measurements. Engineering Structures, 29(10): 2563-2575. [ Links ]
Davenport, A G 1961. The application of statistical concepts to the wind loading of structures. ICE Proceedings, 19(4): 449-472. [ Links ]
Davenport, A G 1983. The relationship of reliability to wind loading. Journal of Wind Engineering and Industrial Aerodynamics, 13(1): 3-27. [ Links ]
Doudak, G, McClure, G, Smith, I & Stathopoulos, T 2009. Comparison of field and wind tunnel pressure coeffcients for a light-frame industrial building. Journal of Structural Engineering, 135(10): 1301-1304. [ Links ]
Ellingwood, B, MacGregor, J G, Galambos, T V & Cornell C A 1980. Development of a probability-based load criterion for American National Standard A58: Building Code Requirements for Minimum Design Loads in Buildings and Other Structures. NBS Special Publication 577. US Department of Commerce/National Bureau of Standards. [ Links ]
Ellingwood, B R & Tekie, P B 1999. Wind load statistics for probability-based structural design. Journal of Structural Engineering, 125(4): 453-463. [ Links ]
EN (European Standard) 2005. EN 1991-1-4 2005. Eurocode 1. Actions on Structures Part 1-4. General Actions-Wind Actions. Brussels, European Committee for Standarization (CEN). [ Links ]
Endo, M, Bienkiewicz, B & Ham, H 2006. Windtunnel investigation of point pressure on TTU test building. Journal of Wind Engineering and Industrial Aerodynamics, 94(7): 553-578. [ Links ]
Ginger, J & Letchford, C 1999. Net pressures on a low-rise full-scale building. Journal of Wind Engineering and Industrial Aerodynamics, 83(1): 239-250. [ Links ]
Goliger, A M, Retief, J V & Kruger, A C 2017. Review of climatic input data for wind load design in accordance with SANS 10160-3. Journal of the South African Institution of Civil Engineering, 59(1): 2-11. [ Links ]
Gulvanessian, H & Holicky, M 2005. Eurocodes: using reliability analysis to combine action effects. Structures and Buildings, 158(1): 243-252. [ Links ]
Hansen, S O, Pedersen, M L & Sorensen, J D 2015. Probability-based calibration of pressure coefficient. Proceedings, ICWE14 Conference, Porto Alegre, Brazil. [ Links ]
Harris, R I 2014. A simulation method for the macro-meteorological wind speed and the implications for extreme value analysis. Journal of Wind Engineering and Industrial Aerodynamics, 125: 145-155. [ Links ]
Holicky, M 2009. Reliability Analysis for Structural Design. Stellenbosch: SUN MeDIA, ISBN 978-1-920338-11-4. [ Links ]
Holicky, M, Retief, J V & Sykora, M 2015. Assessment of model uncertainty for structural resistance. Probabilistic Engineering Mechanics Journal, 45: 188-197. [ Links ]
Holmes, J D 2015. Wind Loading of Structures, 3rd ed. Boca Raton, FL: CRC Press. [ Links ]
Hong, H P, Beadle, S & Escobar, J A 2001. Probabilistic assessment of wind-sensitive structures with uncertain parameters. Journal of Wind Engineering and Industrial Aerodynamics, 89(1): 893-910. [ Links ]
Hong, H P & Ye, W 2014. Estimating extreme wind speed based on regional frequency analysis. Structural Safety, 47: 67-77. [ Links ]
Hoxey, R 1991. Structural response of a portal framed building under wind load. Journal of Wind Engineering and Industrial Aerodynamics, 38(2): 347-356. [ Links ]
ISO (International Standards Organization) 2009. ISO 4353. Wind Actions on Structures. Geneva: ISO. [ Links ]
JCSS (Joint Committee on Structural Safety) 2001. Probabilistic Model Codes. http://www.jcss.byg.dtu.dk/Publications/Probalistic_Model_Code.aspx. [ Links ]
Kasperski, M 1993. Aerodynamics of low-rise buildings and codification. Journal of Wind Engineering and Industrial Aerodynamics, 50(1): 253-262. [ Links ]
Kasperski, M 2001. Specification of the design wind load. A critical review of code concepts. Journal of Wind Engineering and Industrial Aerodynamics, 97: 335-357. [ Links ]
Kemp, A R, Milford, R V & Laurie, J 1987. Proposals for a comprehensive limit states formulation for South African structural codes. The Civil Engineer in South Africa, 29(9): 351-360. [ Links ]
Kruger, A C, Goliger, A M, Retief, J V & Sekele, S 2010. Strong wind climatic zones in South Africa. Wind and Structures Journal, 13(1): 37-55. [ Links ]
Kruger, A C 2011. Wind climatology of South Africa relevant to the design of the built environment. PhD dissertation, Stellenbosch University. http://hdl.handle.net/10019.1/684 . [ Links ]
Kruger, A C, Goliger, A M, Retief, J V & Sekele, S. 2012. Clustering of extreme winds in the mixed climate of South Africa. Wind and Structures Journal, 15(2): 87-109. [ Links ]
Kruger, A C, Goliger, A M & Retief, J V 2013a. Strong winds in South Africa. Part 1: Application of estimation methods. Journal of the South African Institution of Civil Engineering, 55(2): 29-45. [ Links ]
Kruger, A.C., Goliger, A.M., Retief, J V 2013b. Strong winds in South Africa. Part 2: Mapping of updated statistics. Journal of the South African Institution of Civil Engineering, 55(2): 46-58. [ Links ]
Kruger, A C, Retief, J V & Goliger, A M 2017. Development of an updated basic wind speed map for SANS 10160-3. Journal of the South African Institution of Civil Engineering, 59(4): 12-25. [ Links ]
Kwon, D K & Kareem A 2013. Comparative study of major international wind codes and standards for wind effects on tall buildings. Engineering Structures, 51: 23-35. [ Links ]
Larsén, X G & Kruger, A C 2014. Application of the spectral correction method to reanalysis data in South Africa. Journal of Wind Engineering and Industrial Aerodynamics, 133: 110-122. [ Links ]
Levitan, M L, Mehta, K C, Vann, W & Holmes, J 1991. Field measurements of pressures on the Texas Tech Building. Journal of Wind Engineering and Industrial Aerodynamics, 32(2): 227-234. [ Links ]
Milford, R 1985. Extreme value analysis of South African gust speed data. CSIR unpublished Internal Report 85/4. [ Links ]
Milford, R, Goliger, A & Waldeck, J 1992. Jan Smuts experiment. Part 1: Details of full-scale experiment; Part 2: Comparison of full-scale and wind-tunnel results. Journal of Wind Engineering and Industrial Aerodynamics, 43(1): 1693-1716. [ Links ]
Minciarelli, F, Gioffré, M, Grigoriu, M & Simiu, E 2001. Estimates of extreme wind effects and wind load factors: Influence of knowledge uncertainties. Probabilistic Engineering Mechanics, 16: 331-340. [ Links ]
NBCC (National Building Code of Canada) 2010. Structural Commentaries. Ottawa: National Research Council. [ Links ]
Pagnini, L 2010. Reliability analysis of wind-excited structures. Journal of Wind Engineering and Industrial Aerodynamics, 98: 1-9. [ Links ]
Retief, J V & Dunaiski, P 2009. Background to SANS 10160. Stellenbosch: SUN MeDIA. [ Links ]
Rózsás, M & Sykora, M 2016. Effect of statistical uncertainties on extreme wind speeds. Proceedings, 7th International Workshop on Reliable Engineering Computing (REC), Bochum, Germany. [ Links ]
SANS (South African National Standard). 2011b. SANS 10160-3. Basis of structural design and actions for buildings and industrial structures. Part 3. Wind actions. Pretoria: South African Bureau of Standards. [ Links ]
St. Pierre, L M, Kopp, G A, Surry, D & Ho, T C E 2005. The UWO contribution to the NIST aerodynamic database for wind loads on low buildings. Part 2. Comparison of data with wind load provisions. Journal of Wind Engineering and Industrial Aerodynamics, 93: 31-59. [ Links ]
Surry, D 1991. Pressure measurements on the Texas Tech Building. Wind tunnel measurements and comparisons with full scale. Journal of Wind Engineering and Industrial Aerodynamics, 38(2): 235-247. [ Links ]
Tieleman, H W 2003a. Wind tunnel simulation of wind loading on low rise structures: A review. Journal of Wind Engineering and Industrial Aerodynamics, 91: 1627-1649. [ Links ]
Tieleman, H W 2003b. Roughness estimation for wind load simulation. Journal of Wind Engineering and Industrial Aerodynamics, 91, 1163-1173. [ Links ]
Torrielli, A, Repetto, M P & Solari G 2013 Extreme wind speeds from long-term synthetic records. Journal of Wind Engineering and Industrial Aerodynamics, 115: 22-38. [ Links ]
Uematsu, Y & Isyumov, N 1999. Wind pressures acting on low-rise buildings. Journal of Wind Engineering and Industrial Aerodynamics, 82(1): 1-25. [ Links ]
Vickery, P J, Wadhera, D, Galsworthy, J, Peterka, J A, Irwin, P A & Griffis, L A 2010. Ultimate wind load design gust wind speeds in the United States for use in ASCE-7. Journal of Structural Engineering, 136(5): 613-625. [ Links ]
Wang, K & Stathopoulos, T 2007. Exposure model for wind loading of buildings. Journal of Wind Engineering and Industrial Aerodynamics, 95(9): 1511-1525. [ Links ]
Xu, F, Cai, C & Zhang, Z 2014. Investigations on coefficients of variation of extreme wind speed. Wind and Structures, 18(6): 633-650. [ Links ]
Zisis, I & Stathopoulos, T 2009. Wind-induced cladding and structural loads on low-wood building. Journal of Structural Engineering, 135(4): 437-447. [ Links ]
 Correspondence:
J Botha
2 Strasbourg Street, Kraaifontein, Cape Town 7570, South Africa
T: +27 72 948 1694
E: jacques.botha@safrica.com
J V Retief
Department of Civil Engineering, Stellenbosch University, Private Bag X1, Matieland, Stellenbosch 7602, South Africa
T: +27 21 808 4442
E: jvr@sun.ac.za
C Viljoen
Department of Civil Engineering, Stellenbosch University, Private Bag X1, Matieland, Stellenbosch 7602, South Africa.
T: +27 21 808 4444
E: cbarnardo@sun.ac.za

DR JACQUES BOTHA obtained a BEng (Civil) degree in 2012 and a PhD (Structural Engineering) in 2016, both from Stellenbosch University. His research interests are in probabilistic modelling, wind loading and informatics. He is currently employed as a Software Engineer at 4C IT Software Solutions in Bellville, Cape Town.

PROF JOH AN RETIEF (Fellow) Is Emeritus Professor in Civil Engineering at Stellenbosch University. His interests are in the application of structural reliability in the various fields of structural design standards. Accordingly, he has made contributions to the development of design standards nationally and Internationally. He holds DEng degrees from Pretoria and Stellenbosch Universities and degrees from Imperial College, London, and Stanford University, California.

PROF CELESTE VILJOEN (PrEng, MSAICE) is a researcher on structural risk and reliability at Stellenbosch University. She is a member of SABS National Committee TC 98/02, the convenor of the working group developing SANS 10100-3, a member of the working group for the revision of ISO 13824 and a member of the International Joint Committee on Structural Safety.
Distributions of Davenport wind load components as provided by various models for wind load (see Equation (1))


