


Services on Demand
Article
 English (pdf)
 Article in xml format
 Article references
Indicators

Related links
-
 Cited by Google
 -
 Similars in Google
Share

 Permalink
Journal of the South African Institution of Civil Engineering
On-line version ISSN 2309-8775
Print version ISSN 1021-2019
J. S. Afr. Inst. Civ. Eng. vol.60 n.1 Midrand Mar. 2018
http://dx.doi.org/10.17159/2309-8775/2018/v60n1a4
TECHNICAL PAPER
The effect of aeration through an internal gallery of a dam on the cavitation risk of Roberts splitters
G Calitz; G R Basson
ABSTRACT
Roberts splitters is an effective means of energy dissipation for dam spillways. Roberts' (1943) standard unaerated splitter design procedure is, however, limited to a spillway head (H) of 3.0 m (q ~ 12 m2/s). In order to avoid cavitation at higher design spillway heads, this study investigated the artificial aeration of the flow by local air vents positioned on the splitters. A 1:20 scale hydraulic model of an ogee spillway equipped with Roberts splitters was constructed. Two aerated models, with differently sized air vents, were compared to an unaerated control model in order to determine the effect that the proposed aeration system has on the cavitation risk of the splitters at prototype unit discharges (q) of up to 50 m2/s.
At the maximum tested spillway head of 7.6 m (q = 50 m2/s) the minimum pressures and air concentration around the splitters of both aerated models increased considerably. It was further observed that the unaerated splitters were prone to drowning at high spillway heads, leading to unfavourable hydraulic conditions.
Based on the results of this study, the addition of aeration through an internal aeration gallery can increase the unit discharge capacity of Roberts splitters to at least 50 m2/s, up by 43%, from the unaerated limit of 35 m2/s.
Keywords: Roberts splitters, dam spillway, energy dissipation, artificial aeration, cavitation
INTRODUCTION
Roberts splitters as energy dissipator
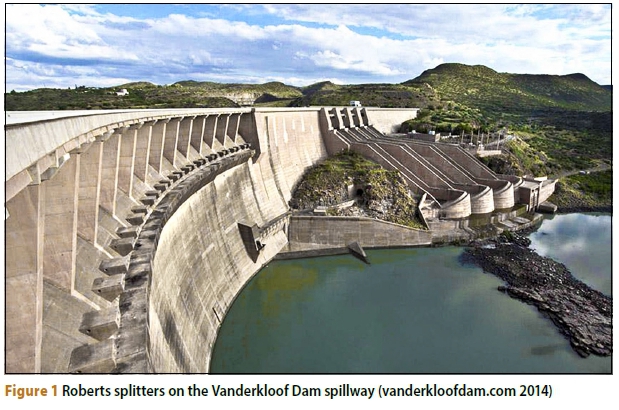
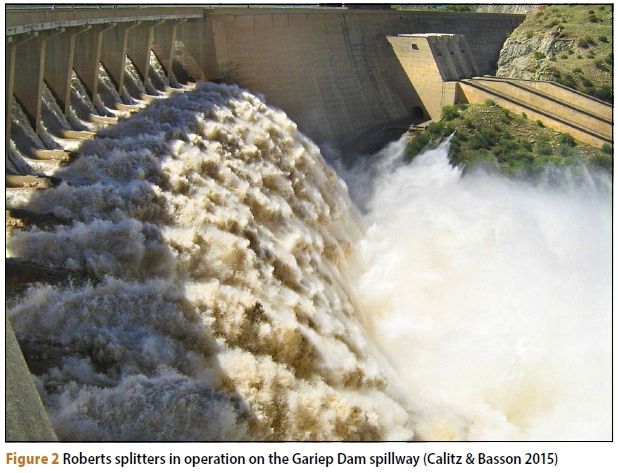
Roberts splitters are a type of energy-dissipating measure located near the top of dam spillways, as can be seen on the Vanderkloof Dam spillway in Figure 1, originally developed by Lt Col DF Roberts for the Loskop Dam in 1936 (Roberts 1943). These splitters are typically used on high dams where the spillway flow velocities are too fast for a stilling basin, or the unit discharge too high for a stepped spillway. The Roberts splitters system consists of a series of projecting teeth or splitters immediately upstream of a continuous lip or step (Mason 1983). If designed correctly, two sets of jets created by the splitters and step will collide in midair, breaking up into spray, and dissipating the energy through air resistance (Roberts 1980), as can be seen in Figure 2.
During operation, the intended goal of the splitters is to split the sheet of water flowing down the spillway. By doing this, the direction of the flow is rapidly changed and flow separation may exist around the splitters, leading to sub-atmospheric pressures. If the pressure in the fluid becomes too low (approaches vapour pressure), cavitation may occur, which could cause serious damage to the spillway structure.
Cavitation in general can be mitigated in two ways: firstly, by ensuring that the fluid pressure remains above 3 m absolute (Chadwick et al 2013), and secondly, by introducing at least 8% air concentration into the flow (Chanson 1992). On a dam spillway with Roberts splitters, air can be introduced to the water flow at atmospheric pressure via air vents connected to an atmospheric air source. This is called artificial aeration. This air flow to the air vents needs not be pumped or pressurised, if properly designed, because sub-atmospheric pressures within the nappe created by the separated flow over splitters will naturally suck air out of the vents. This is true provided that the pressure of the air in the cavity of the aforementioned nappe is lower than the air in the air vent (which should be atmospheric or higher). Although aeration has previously been provided for the Roberts splitters, for example on the spillways of the Gariep and Vanderkloof Dams (both on the Orange River in South Africa), "the need or effectiveness of aeration by internal ducts has, however, not been proved conclusively" (Jordaan 1989).
Objective of the study
The main objective of the study was to determine what effect the artificial aeration of Roberts splitters (through an internal gallery) has on the local negative pressures around the splitters, with the goal of alleviating cavitation risks at prototype unit discharges of up to 50 m2/s.
To achieve the objective, physical hydraulic model tests were conducted in the hydraulic laboratory of the Civil Engineering Department of Stellenbosch University.
Limitations of the study
The maximum discharge that was evaluated was limited by the model scale and the laboratory's pump capacity. The scale had to be large enough to construct each splitter with the necessary detail to apply pressure-monitoring instruments.
The study served mainly as an investigation into the improvement of the original Roberts procedure for the design of crest splitters to dissipate the energy of a flood (Roberts 1943), with the goal to alleviate cavitation risks. Roberts' splitters did not have any form of air vents or ducts, and thus, with the addition of such features, a different optimisation might be needed. The downstream effect of the aeration was not evaluated, including energy dissipation and apron pressures. As mentioned by Mason (1983), until a comprehensive study of these crest splitters is done to point towards a set of design guidelines, further optimisation of the splitter configuration would be needed, especially at the high spillway heads we see on modern dams.
In lieu of Roberts' spillway head limitation of 3 m (q = 12 m2/s), again, optimisation of the crest and step configuration might be needed for a design head of 6.7 m (q = 40 m2/s, as used during the study). It could therefore not be assumed that the dispersive action of the splitters would stay the same as for those with a lesser design head.
During the study, the size of the air vents was limited by the space available between the pressure sensors on the downstream end of the splitter. Thus, only two sizes were investigated. This limited a broad recommendation on the optimal air vent size.
RELEVANT LITERATURE
Limitations to Roberts splitters
Roberts (1943) first introduced the limit of 3.0 m of spillway head. He stated that individual model tests were required to validate his design if the design head (HD) of a given prototype was greater than 3.0 m. If using a conventional ogee spillway, this typically equates to a unit discharge of 12 m2/s. This rule was followed for all subsequent dam designs until that of the Gariep and Vanderkloof Dams.
With the introduction of artificial aeration and the dam type being a double curvature arch dam, the distance the jet had to travel away from the toe of the dam decreased considerably, and the allowable spillway heads (considering future raising) were tripled to 9.1 m and 9.0 m respectively (Jordaan 1989). The splitters were, however, dimensioned for a spillway head of 7.3 m and, while it was discovered that sub-atmospheric pressures existed on the spillway just downstream of the crest at heads greater than 6.0 m, the cavitation coefficient of σ = 0.3 was considered acceptable (Back et al 1973).
Roberts (1943) further stated that a critical head (Hc) exists at which the splitters become drowned. He designated this as 1.2 times the design head. Further tests at the Rhenosterkop Dam in Mpumalanga, South Africa, confirmed Roberts' initial suggestions (Jordaan 1989).
Existing aeration of Roberts splitters
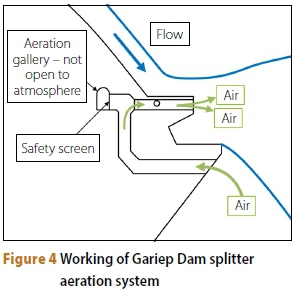
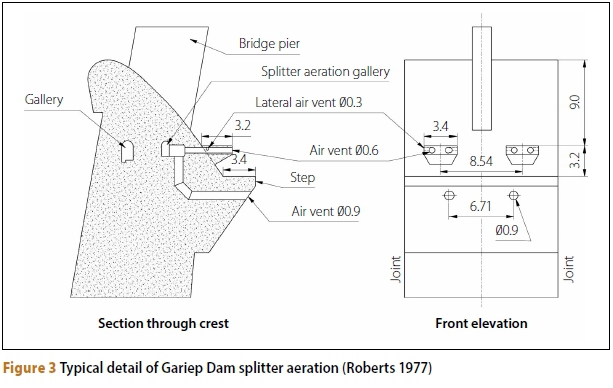
The splitters and aeration of the Gariep and Vanderkloof Dams were similarly and simultaneously designed and tested by the Société Grenobloise d'Etudes et d'Applications Hydrauliques (Sogreah, now Artelia) in Grenoble, France (PJ Mason 2016, personal communication, 24 July). It consists of two 0.6 m diameter air vents at the end of each splitter along with a single 0.3 m diameter lateral air vent on both sides of each splitter. A series of larger 0.9 m diameter vents are located below the continuous step downstream of the splitters (see Figure 3). According to Mason (2016, personal communication, 24 July), the splitter air vents are fed by the larger intake vents set in the step below, hence circulating air locally for each splitter (Figure 4). The aeration gallery is not open to the atmosphere; therefore the air needed to aerate the flow only comes from the intake vents in the step. The aeration gallery rather serves to connect the step's large air vents with the smaller vents of the splitter, and for inspection and access to the splitters. Roberts (1977) mentioned that the aeration of the Gariep Dam's splitters improved the flow stability and reduced vibration noise.
During previous studies at Stellenbosch University (Calitz 2014; Langa 2015) it was found that water would flow into the air vents on the splitters at high spillway heads and cause potential air flow blockage within the system. Thus, this study was further concerned with investigating an aeration system whereby air would solely be provided via the internal aeration gallery, with a separate option for draining any excess inflow water.
HYDRAULIC MODEL
Scope of the hydraulic model
A 1:20 physical hydraulic model of an ogee spillway with three configurations of Roberts splitters were constructed:
1. A control model of unaerated Roberts splitters, intended to measure the pressure and air concentration around a splitter and justify the ideal positioning of air vents on the splitters
2. A first aerated model of Roberts splitters, containing small air vents, intended to alleviate cavitation risks of the splitters and analyse the performance of the proposed aeration gallery
3. A second aerated model of Roberts splitters, containing larger air vents, intended to further improve the flow conditions as stated above, and compare aeration performance with that of the first aerated model.
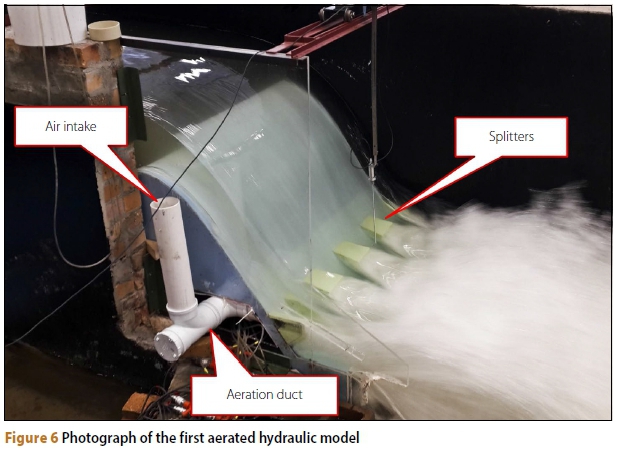
In each case, the spillway was placed within a 24.5 m long and 1.2 m wide plastered brick flume. Figure 5 shows the general layout of the hydraulic models and Figure 6 shows a photograph of the ogee spillway with aerated Roberts splitters in operation.
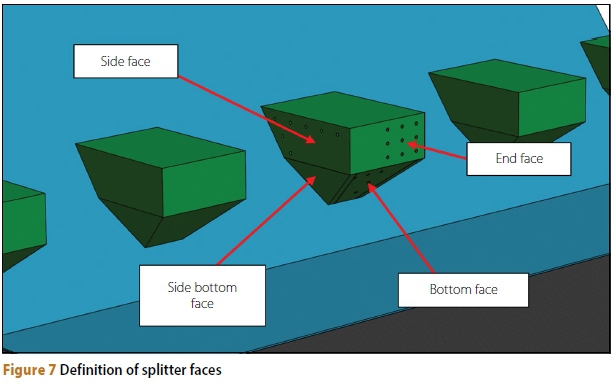
Figure 7 shows a close-up of the centre splitter of the model. This splitter was used to measure the pressure and air concentration of the flow around it (all surfaces below the horizontal top surface) and analyse the performance of the proposed aeration system. Note the definition of faces of the splitter, as used for the entirety of this paper.
Model scale and laboratory limitation:
The scale of the model was selected as 1:20. This was to allow a prototype design unit discharge of 40 m2/s and a maximum unit discharge of 50 m2/s within the limits of the laboratory, whilst avoiding scale effects due to viscosity and surface tension (Robertson 2014). The model was scaled in accordance with the Froude Law, as gravitational and inertial forces were dominant (Bosman & Basson 2012), and was built as small as possible to maximise the model discharge that could be achieved from the laboratory's supply limit of 700 £/s.
Design And Construction
Ogee spillway and Roberts splitters
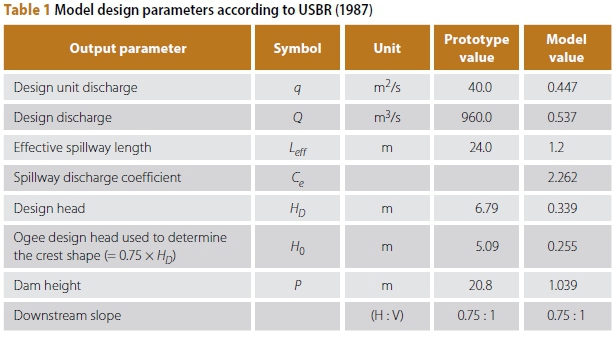
The hydraulic model consisted of an ogee spillway, Roberts splitters and an aeration gallery. As mentioned above, the prototype design unit discharge (q) was chosen as 40 m2/s, due to laboratory limitations, whic equated to a design head (HD) of 6.79 m.
The ogee spillway was designed according to the USBR's (United States Bureau of Reclamation) Design of Small Dams (USBR 1987), which allows the design head (H0) used to determine the ogee's crest shape to be 75% of the maximum head (He) to pass over the spillway. This will produce sub-atmospheric pressures equal to about half the design head (p ≈ -H/2) on the crest. Accordingly, the prototype ogee design head (Ho) used to determine the crest shape was calculated from HD as 5.09 m.
The model's splitters were designed according to the original Roberts (1943) procedure, as simplified by Roberts (1980).
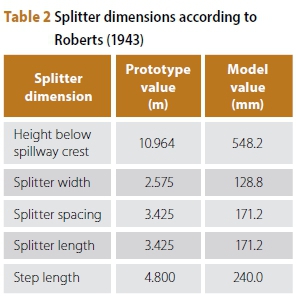
The procedure's main input variable to produce the splitter configuration is the relevant design spillway head (HD) of 6.79 m. The control model's splitters were unaer-ated, whilst the first and second aerated models contained air vents in the splitters. The general design parameters of the ogee spillway are summarised in Table 1, and the dimensions of the splitters in Table 2.
Air vents and aeration gallery
Air vents were placed on the two side faces and the downstream end face of the splitters where the lowest pressures were measured during the unaerated model tests (see Figure 8). The existing aeration systems of the Gariep and Vanderkloof Dams were taken into consideration and the ratio of these dams' design spillway head-to-vent sizes was used in dimensioning the model's air vents. The design head (H0) used for the dimensioning of the Gariep Dam's splitters was 7.3 m, and the main air vent diameter (θmain) is 0.6 m. This gives θmain/H0equalto 0.08. Using this ratio on the ogee design head of the model Ho) of 5.09 m gives a prototype main air vent diameter (θmain) of 0.41 m. This is equivalent to a model diameter of 20.5 mm, but was rounded to 20 mm for ease of construction. The side vents of the Gariep and Vanderkloof Dams are half the size of the main vents, and the model's side vents were accordingly dimensioned.
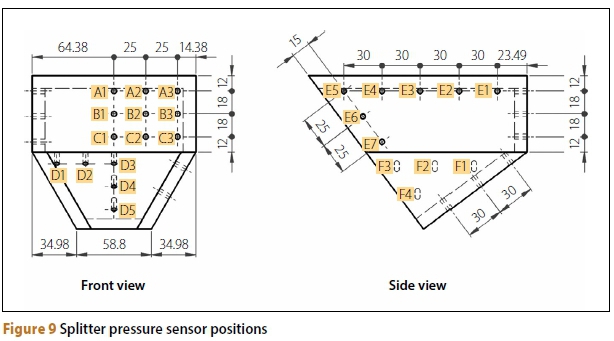
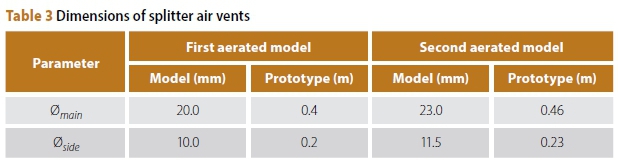
The second aerated model's larger air vents were limited to 23 mm by the space available between the pressure sensors on the downstream face of the model splitters (see Figure 9). This is equivalent to a prototype diameter of 0.46 m, a 15% increase from that of the first aerated model. If larger air vents were to be tested, several pressure sensors would have had to be removed, jeopardising the comparability of the results.
The dimensions of the air vents are summarised in Table 3, where θmain and 0side are the diameters of the main and side vents respectively.
All air vents were fed from one side by a single aeration gallery. The aeration gallery was not open on both sides due the layout of the model's flume. The model's aeration gallery was designed to be large enough to allow the air vents to act as the control of the air flow, and to avoid any significant variability in air flow to each splitter. This meant that the cross-sectional area of the duct had to be significantly more than the accumulated area of all the air vents of the second aerated model.
The required accumulated area of all four splitters' prototype air vents was calculated as 1.662 m2. The constructed aeration duct had a prototype cross-sectional area of 3.801 m2, which included a safety factor of 2.0. The aeration duct included a drainage port and end cap to allow water entering the system through the air vents to be drained when needed.
Measuring techniques and equipment
Pressure readings on splitters
Fourteen Wika S-10 high-quality pressure transmitters were used to measure the dynamic fluid pressure at several positions on the splitters. These were connected to the two measuring splitters by 03 mm outside diameter plastic tubes. The transmitters had a range of ±100 mbar, an accuracy of ±0.2% and a reading repeatability of ±0.1%. The pressure sensors' tubes were symmetrically placed on the central splitter on the spillway, measuring the pressure on four of its faces. This could be mirrored to include all six downstream faces of the splitter. The locations of the sensors are shown in Figure 9. Readings were taken at all locations for a duration of three minutes at a frequency of 100 Hz. Through statistical analysis and recommendations by Calitz (2015), the minimum pressure from each data set was selected as the value exceeded 99.85% of the time.
Air concentration around splitters
To analyse the cavitation risk of the splitters, the air concentration (Air%) of the flow was measured at the positions where cavita-tion was expected. This was compared to Chanson's (1992) recommendation that at least 8% air content within the flow would mitigate the damaging potential of cavita-tion. An intrusive conductive needle probe was used to measure the air concentration of the flow. The diameter of the probe's conductive tip is 00.1 mm. The probe operates by measuring the electric conductivity of air and water, and returning the acquired voltage to a data logger. The data was logged using Thermo Needle Probe (TNP) software. Both the probe and the software were supplied and calibrated by German-based HZDR Innovation. From Calitz's (2015) previous studies, a 1 minute duration at a frequency of 10 kHz was sufficient to produce a representative data set. The air concentration was measured at three positions close to the surface of the splitters in order to determine a representative Air% value. These three positions were:
■ At the centre of the downstream end of the splitter, 5 mm from the splitter's surface
■ At the centre of the side face of the splitter, 5 mm from the splitter's surface
■ At the centre of the bottom face of the splitter, 10 mm from the splitter's surface.
Air discharge of air vents on splitters
The air discharge of the air vents was calculated from air velocity measurements taken within the aeration gallery of both the aerated models. These velocity measurements were taken using a Lutron hot-wire anemometer with an accuracy of ±1%. Data was recorded by hand for 2 minutes at 5 second intervals, before the average air velocity per test was used to calculate the air discharge per splitter. The air discharge per air vent could not be determined, as it was impossible to take measurements within the splitter itself.
Test conditions
The tests were divided between two measuring splitters to accommodate the number of pressure sensors within the splitter, as explained above. Thus, six rounds of tests were done, one for each measuring splitter per model. In each round, ten tests were performed starting, at qp = 5 m2/s and ending at qp= 50 m2/s, increasing in steps of 5 m2/s (where qpis the prototype unit discharge).
The laboratory's pump capacity limited the maximum unit discharge to q = 50 m2/s. Four extra independent repeatability tests were done: two each at qp = 30 m2/s and qp = 40 m2/s. This gave two sets of three tests to analyse the repeatability of the tests.
DISCUSSION OF RESULTS
All values are prototype values unless otherwise indicated.
drowning of unaerated Roberts splitters
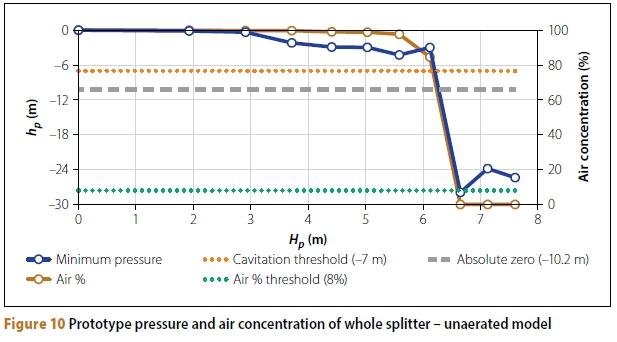
A common theme with the results of the unaerated model tests was the severe change in conditions from spillway heads less than the design head of 6.7 m (q = 40 m2/s), to spillway heads equal to and greater than 6.7 m. The pressure around the entire splitter dropped considerably to below the cavitation threshold of -7 m atmospheric, and the air concentration decreased to 0%. Figure 10 shows the prototype pressure and air concentration of the entire splitter. The probable minimum pressure of all 25 pressure sensors and the average air concentration of all three measured positions were calculated to provide this visual illustration of the drop in performance of the splitters.
From Figure 10 it is clear that the probable minimum pressure of the entire splitter drops to the assumed cavitation threshold of -7 m atmospheric (Chadwick et al 2013), and that the air concentration drops to below the 8% needed to alleviate cavitation (Chanson 1992). (It should be noted that the pressures recorded in the model and converted to prototype which are lower than prototype cavitation pressure will remain at cavitation pressure in prototype.) It was concluded that at unit discharges greater than 35 m2/s, i.e. at spillway heads equal to and higher than the design head of the ogee spillway profile of 6.7 m (q = 40 m2/s), the cavitation risk of unaerated Roberts splitters is so high it can be deemed inevitable that cavitation will occur. This was due to the drowning of the splitters, meaning the air pockets that form in the boil downstream of the splitters were being washed downstream by the flood over the spillway. It should be explained that it was possible to measure 100% air concentration due to the air pockets that formed downstream of the splitters. Especially during low flows, no water would enter these air pockets at all. But, as the flow increased, water would occasionally enter these pockets, up until the moment the splitters became drowned at H = 6.7 m (q = 40 m2/s), when the entire air pocket was washed downstream by the strong current over the splitters.
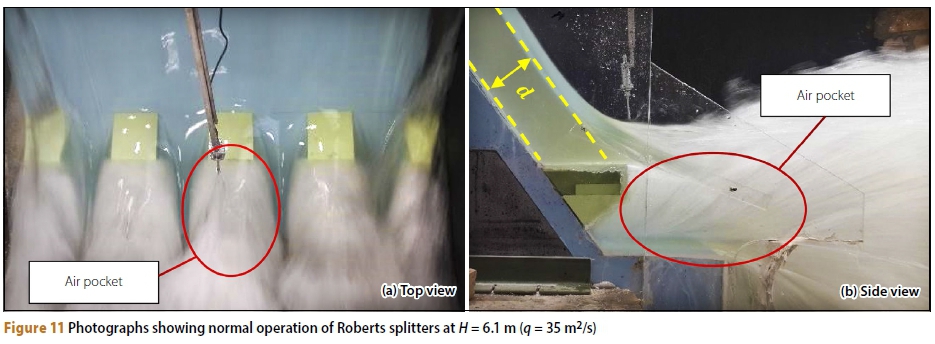
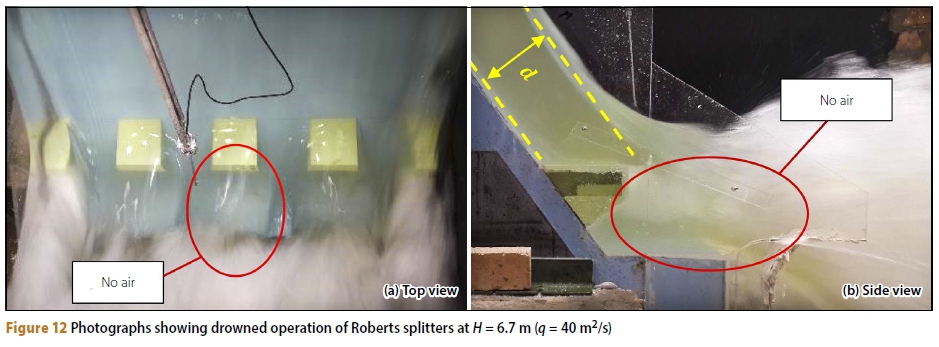
Jordaan (1989) stated that the energy-dissipating performance of Roberts splitters drops when the splitters become drowned at the critical head of 1.2 times the design head. The unaerated model tests found that this critical head was reached at exactly the design head of 6.7 m (q = 40 m2/s) and not at 1.2 times the design head. During the development of the splitter system, Roberts (1943) not only prescribed the critical head limit of 1.2HD, but also limited the use of unaerated Roberts splitters to spillway heads of only 3.0 m. Figures 11(a) and (b), and Figures 12(a) and (b) show photographs of unaerated model tests at prototype spillway heads (Hp) of 6.1 m (q = 35 m2/s) and 6.7 m (q = 40 m2/s) respectively - note that the design head of the ogee profile of the spillway model was 6.7 m (q = 40 m2/s).
An air pocket can clearly be seen in the boil downstream of the splitters in Figure 11. The results indicate that this air pocket greatly alleviated severe negative pressures on the splitters. This was due to the compressibility of air in comparison to water. If air was present within the flow, it absorbed the extreme pressure fluctuations caused by the turbulent flow around the splitters by compressing and expanding accordingly. In contrast, if the air pocket was absent, as is the case with the drowned splitters, the extreme pressure fluctuations were transferred to the surface of the splitters by the incompressible water.
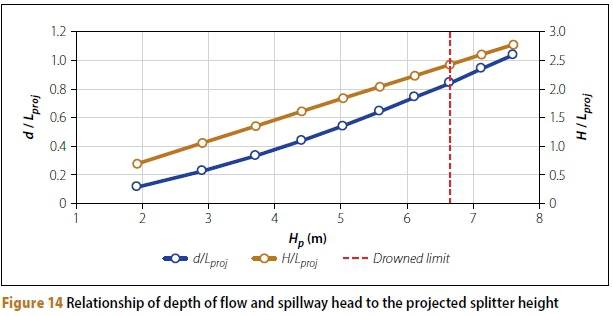
The study found that the drowning of the splitters commenced at a critical flow depth d approaching the splitters, and that the relationship between d and the projected height of the splitters played a role. This is also evident from Figure 12. The projected height of the splitters was defined as Lproj and is related to the length of the splitters L and the downstream slope of the spillway θ, and can be calculated using Equation 1 (see Figure 13).
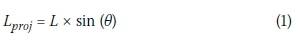
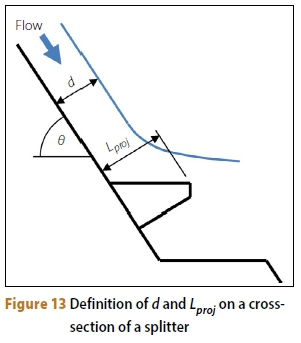
In the case of the studied hydraulic model, the prototype spillway slope was 0.75:1 (H:V), equal to a slope of θ = 53.1°, and the prototype length of the splitters was 3.425. This gave a projected splitter height of Lproj= 2.740 m.
Using the Bernoulli energy equations, the depth of flow was calculated from the spillway head H, the spillway unit discharge q and the height of the splitters below the spillway crest P (Equation 2).
From the depth of flow, the relationship of d/Lprojwas obtained and plotted in Figure 14 against the spillway head to determine when the splitters would become drowned. The plot of Hp/Lprojis included for convenience. Note that the usage of the relationship of Hp/Lproj to determine the point at which Roberts splitters will start to drown is subject to the discharge coefficient of the specific spillway. Using the observation that the splitter became drowned at the prototype design spillway head of 6.7 m (q = 40 m2/s), from Figure 14 it can be concluded that for high-design spillway heads of around 6.7 m (q = 40 m2/s), Roberts splitters could become drowned at a point where H/Lproj is equal to 2.4, and d/Lproj is equal to 0.84.
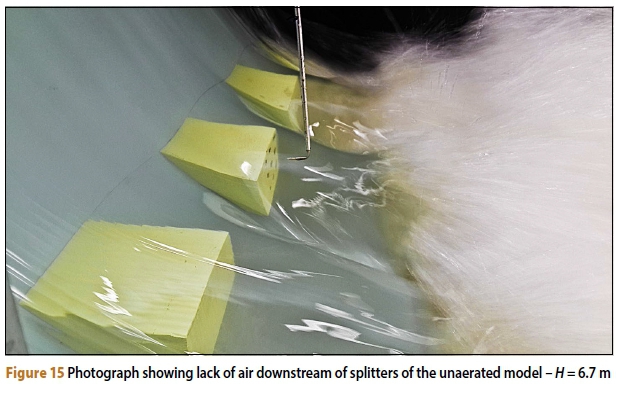
Thus, if the flow was deep enough to effectively flow over the splitters without projecting away, it would flush the air pocket downstream of the step, causing severe pressure conditions around the step, as no air is present to absorb the negative pressures. Figure 15 shows a close-up photograph of the splitters at the design head of 6.7 m (q = 40 m2/s), showing the lack of an air pocket downstream of the splitters.
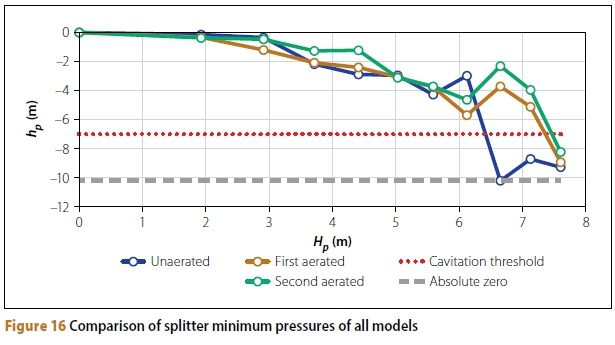
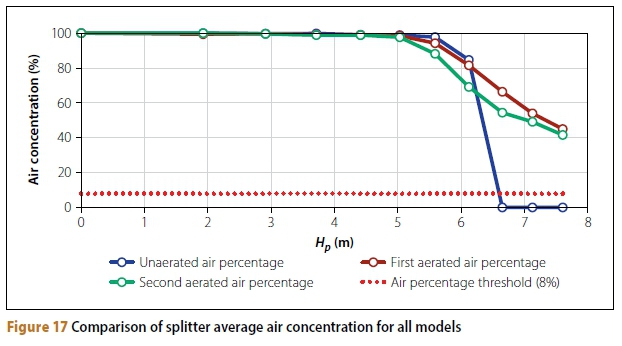
Comparison of local pressures and air concentration
Figure 16 contains the comparison of prototype minimum pressures of the whole splitter, while Figure 17 shows the air concentration for each model. The models behaved similarly for heads up to 6.1 m (q = 35 m2/s) in terms of pressure and air concentration. However, at the design head of 6.7 m (q = 40 m2/s) and above, the splitters became drowned (as discussed above) and the unaerated splitters showed a severe drop in pressure and air concentration. The normal air pocket found in the boil immediately downstream of the splitters was flushed downstream of the step, and the characteristic air entrainment mechanism of Robert splitters was not as effective in this state as intended by Roberts (1943). Pressures close to high vacuum conditions (-10.2 m) were measured at the side face, along with 0% air concentration, leading to the conclusion that cavitation would inevitably occur.
The air vents of the aerated models provided much needed air supply to the splitters in this drowned state. The air pocket was continuously re-established and the pressure conditions improved considerably, as evident from Figure 16. At spillway heads equal to and greater than the design spillway head of 6.7 m (q = 40 m2/s), the change in prototype pressure is clearly evident and beneficial. The air concentration still decreased for the increasing spillway head, but did not drop below 40%. In only one location was a prototype pressure recorded that was less than the cavitation limit of -7 m, as prescribed by Chadwick et al (2013), and, according to Chanson's (1992) findings, this is acceptable, given that the air concentration in the flow at this point is greater than 8%. Referring to Figure 17, it should be noted that the air concentration of the second aerated model decreased slightly compared to that of the first aerated model. It was concluded that the air concentration was not necessarily as dependent on the size of the air vents, but rather on the presence of the air pocket downstream of a splitter.
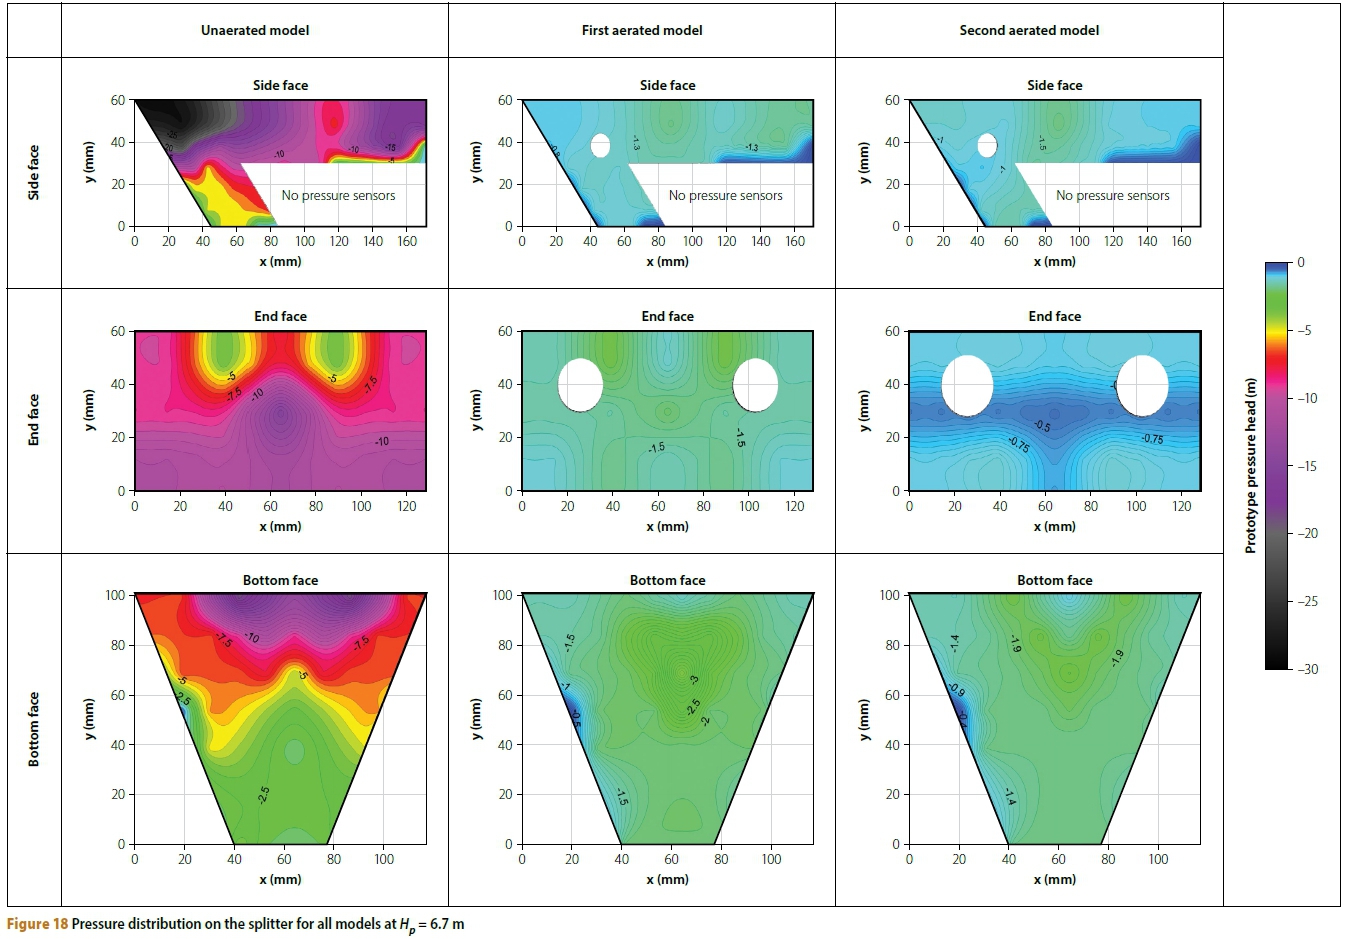
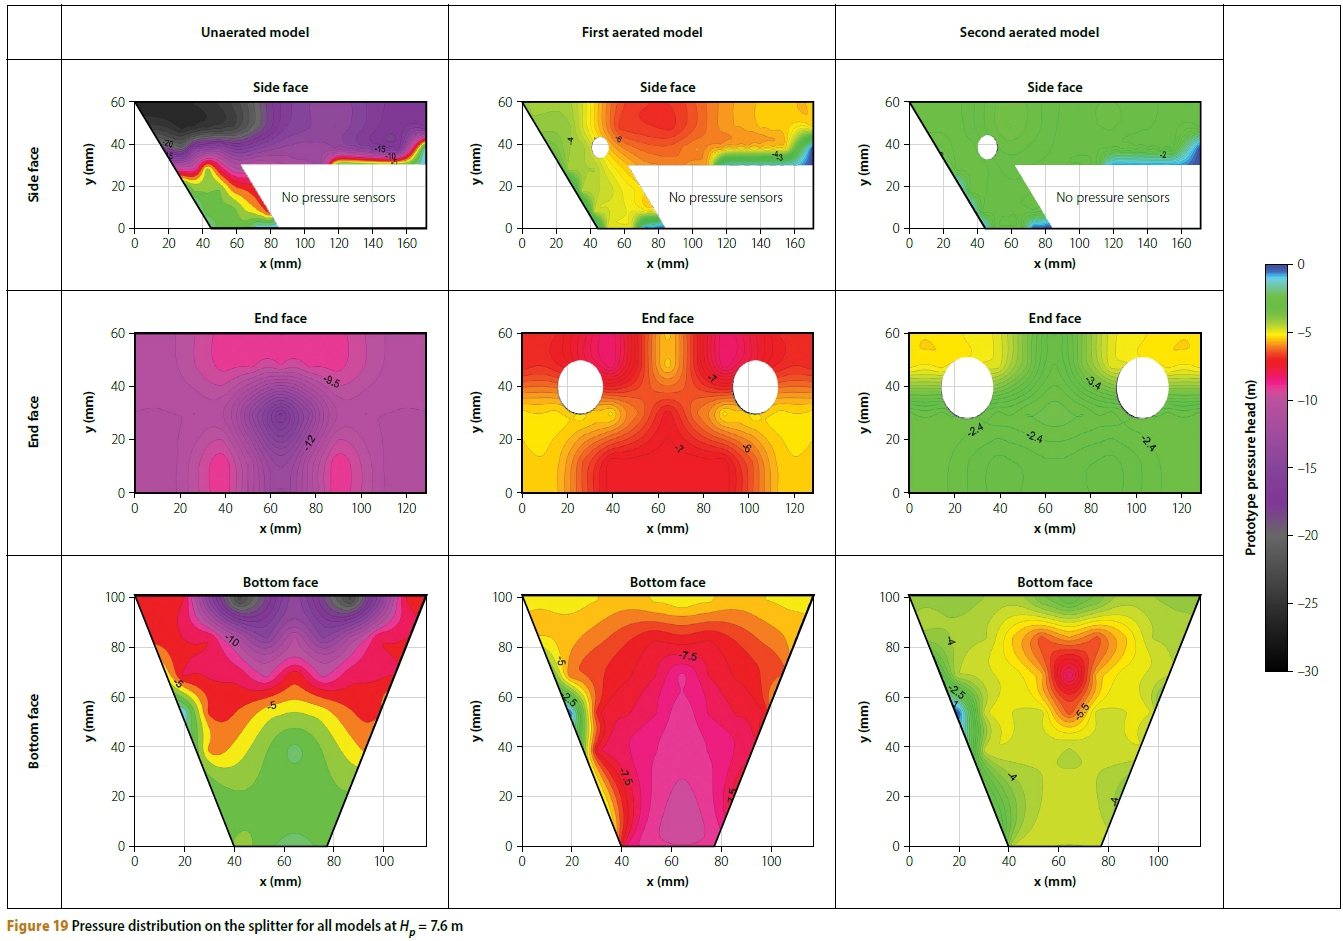
Figures 18 and 19 show 2D contour plots of the minimum measured prototype pressure on the side, end and bottom faces of the model splitter for the design spillway head of 6.7 m (q = 40 m2/s) and the maximum tested spillway head of 7.6 m (q = 50 m2/s). For the definitions of the faces of the splitter, refer to Figure 7. The side bottom face was excluded from these plots, as the four sensors F1 to F4 provided too little data. The blank zone towards the bottom right of the side face indicates that no sensors were placed in that area, and as such, no data existed to plot there. The dimensions of the splitter faces in Figures 18 and 19 are to model dimensions.
The plots clearly indicate that the locations of the most severe negative pressures on the unaerated model were on the side face, near the top and close to the spillway surface. The most severe negative pressure on the end face was measured in the centre, and the most severe negative pressure on the bottom face was measured near the top at the joint with the end face. This justifies the design and placement of the air vents.
Regarding the pressure distributions of the design head of 6.7 m (q = 40 m2/s) in Figure 18, it was noted that the severe pressure situation of the unaerated model was completely alleviated by both the aerated models. At the maximum head of 7.6 m (q = 50 m2/s), the absolute value of the minimum measured pressure on the splitter is similar for the first and second aerated models, as evident from Figure 16. However, the spread and distribution thereof are different. Regarding all splitter faces of the first aerated model in Figure 19, note the large spread of prototype pressure equal to or less than the -7 m cavitation limit set by Chadwick et al (2013) (the red areas on the contour plots). This is greatly reduced in the second aerated model to a single zone on the bottom face. As mentioned, this was acceptable, given that the air concentration in the flow at this point is greater than 8% (Chanson 1992).
Discussion on the performance of the aeration system
The main considerations in estimating the performance of the proposed aeration system were air discharge and water inflow per splitter. Figure 20 shows the prototype air discharge (Qair) and the water inflow (Qinßow) per splitter for all tested spillway heads. It is evident that the decrease in air discharge at heads greater than 5.0 m (q = 25 m2/s), and more prominently at heads greater than 6.1 m (q = 35 m2/s), is linked to the increase in water inflow at the same heads.
As the movement of air and water through the air vents is caused by the pressure differential between the outside and inside of the air vents, and the pressure on the inside of the vents was close to atmospheric, the measured pressure close to the air vent positions was analysed to investigate the flow of air (and possibly water) through the air vents.
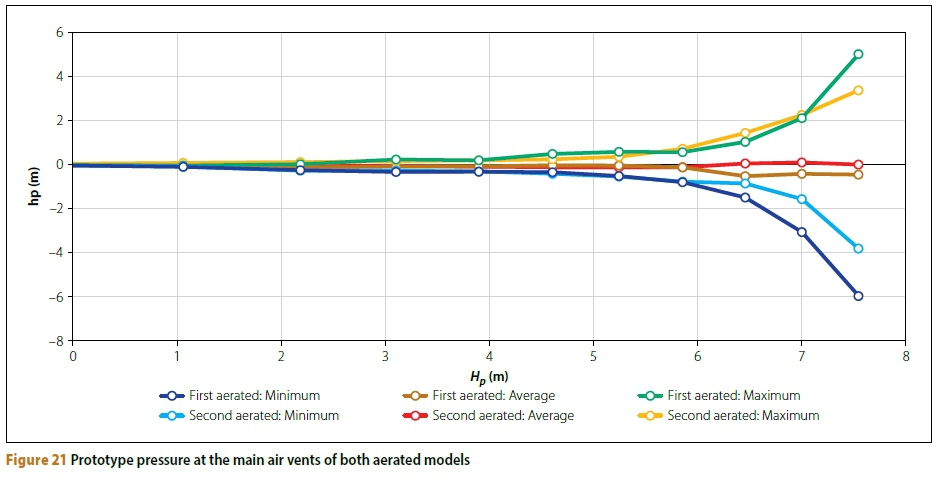
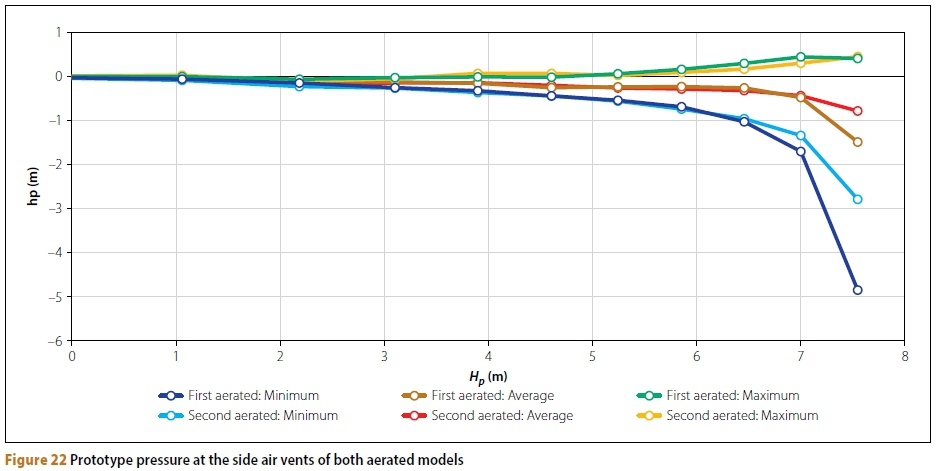
The prototype pressures at the main air vents were interpolated from the values of pressure sensors A2, A3, B2 and B3 (see Figure 9 for the positions of the sensors), while the pressures of the side air vents were interpolated from sensors E4, E5 and E6. By taking the minimum, average and maximum of these interpolated sets of data, Figures 21 and 22 were produced.
In Figures 21 and 22 the negative pressures relate to air being discharged from the air vents, and the positive pressure relates to water that flowed into the vents. It must be noted that the minimum and maximum pressure values in these figures represent pressure peaks. There were several positive peaks and several negative peaks. Each of these peaks would induce a burst of air discharge or a burst of water inflow. Air and water never continuously or steadily flowed through the air vents. However, the average pressures (which are negative in all cases) imply that, over extended periods, air will be discharged out of the vents rather than into them.
The large increase in air discharge of the second aerated model from that of the first aerated model at heads between 1.9 m (q = 5 m2/s) and 7.1 m (q = 45 m2/s) can be explained by the similarity of the pressure results between the two aerated models at the locations of the air vents. If the pressures at the air vents were to be equal, then the larger cross-sectional area of the 023 mm vents would produce a greater volume of air per given time. Referring to the higher heads of 7.1 m (q = 45 m2/s) and 7.6 m (q = 50 m2/s) within Figures 21 and 22, the pressure at the air vents of the second aerated model increased from that of the first aerated model, causing a decrease in air demand, and thus air discharge. The larger air vents still resulted in an increase in air discharge, as can be seen in Figure 20, but the decreased demand meant that the difference between the two aerated models is not as great as is the case with the heads less than 7.1 m (q = 45 m2/s).
Referring to Figure 20, small amounts of water only started sporadically flowing into the air vents at spillway heads equal to and greater than 6.7 m (q = 40 m2/s), the same head as when the splitters became drowned. As mentioned, the inflow of water is due to peaks of positive pressure at the air vents. From observations during the tests it was found that almost no water flowed into the side vents. This is partly due to the size of the side vents being half of that of the main vents, but mostly due to absence of notable positive pressure at the side vents, as can be seen in Figure 22. During the aerated tests, the sides of the splitters produced surprisingly stable and predictable pressure results, especially considering that during the unaerated model tests the pressures on the side were the most severe of all tests.
CONCLUSIONS
The conclusions from the hydraulic model study can be summarised as follows, where all values are prototype values, unless otherwise stated:
■ It was found that the splitters became drowned at the design spillway head of 6.7 m (q = 40 m2/s).
■ A system of unaerated Roberts splitters should not drown under these circumstances:
■ d/Lproj< 0.84
■ H/Lproj < 2.4
Where d is the depth of flow approaching the splitters, H is the spillway head and Lproj is the projected height of the splitters in the direction of the flow (see section above titled "Discussion of results").
■ These drowned conditions would inevitably lead to cavitation of unaer-ated splitters. The minimum pressure was measured at -10.2 m and the air concentration was 0%.
■ The introduction of artificial aeration through air vents greatly alleviated these cavitation risks.
■ The following favourable combinations of pressure and air concentration were measured for each model at the design spillway head of 6.7 m (q = 40 m2/s):
■ First aerated model: -3.7 m pressure and 66% air concentration
■ Second aerated model: -2.3 m pressure and 55% air concentration
In reply to Jordaan's (1989) statement, the need for aeration to Roberts splitters, especially at high spillway heads, is supported by these results.
■ With the increase in air vent size of the second aerated model, the severe negative pressure conditions were significantly improved at the maximum tested spillway head of 7.6 m (q = 50 m2/s - see Figures 18 and 19).
■ The observed decrease in air discharge at unit discharges higher than 25 m2/s was due to higher pressure volatility and more regular and higher positive pressure peaks at the air vent positions. This resulted in water inflow into the air vents that needed to be continually drained. This, however, did not influence the performance of the model's aeration gallery. The peak water drainage per splitter was 0.092 m3/s (second aerated model tests).
■ The maximum measured unit discharge that was safely passed over the spillway splitters was 50 m2/s (H = 7.6 m), which is significantly more than the 12 m2/s (H = 3 m) limit set by Roberts (1943) (see section above titled "Limitations to Roberts splitters") and the limit of 35 m2/s (H = 6.1 m2/s) as measured in this study for unaerated splitters.
■ The unit discharge of 50 m2/s was limited due to the laboratory's pump capacity. The tests showed that Roberts splitters could possibly be used at higher unit discharges, but this was not evaluated during the study.
In closing, it was found that the main objective of the study was successfully achieved, as aeration of Roberts splitters, through an internal gallery, had a satisfactory effect on the local negative pressures around the splitters, and sufficiently alleviated the cavitation risk at prototype unit discharges of up to 50 m2/s (H = 7.6 m).
RECOMMENDATIONS FOR FURTHER WORK
The following summary can be used as starting points for further investigation into establishing practical design guidelines for aerated Roberts splitters at spillway heads greater than the 3 m limit as set by Roberts (1943):
■ Test and evaluate a broad spectrum of splitter configurations, based on a wide range of design heads, up to and exceeding at least 10 m. These tests should primarily focus on the energy dissipation and downstream dispersive action of the splitters before focusing on local structural and surface effects.
■ With the focus on the air vents, a wider range of air vents should be investigated before a set of guidelines can be prepared with regard to the splitter air vents.
■ The aeration gallery can be optimised and compared to the current bottom vent (see section above titled "Existing aeration of Roberts splitters") with regard to air supply and avoiding potential drainage problems that may arise from water inflow into the air vents.
REFERENCES
Back, P A A, Frey, J P & Johnson, G 1973. P. K. le Roux Dam spillway design and energy dissipation. Proceedings, 11th ICOLD Congress, Madrid, Spain, Vol. Q. 41, R. 76, No. II, pp 1439-1468. [ Links ]
Bosman, E & Basson, G R 2012. Investigation of unsteady flow conditions at dam bottom outlet works due to air entrainment during gate closure: Physical modelling. WRC Report TT528-12, Pretoria: Water Research Commission. [ Links ]
Calitz, G 2014. The effect of aeration on local negative pressures of Roberts splitters. Final year research dissertation, Stellenbosch University. [ Links ]
Calitz, G & Basson, G R 2015. The design of Roberts splitters for energy dissipation at dam spillways. Design and Construction of Hydraulic Structures Course, Stellenbosch University, September 2015. [ Links ]
Calitz, J A 2015. Investigation of air concentration and pressures of a stepped spillway equipped with a crest pier. MEng dissertation, Stellenbosch University. [ Links ]
Chadwick, A, Morfett, J & Borthwick, M 2013. Hydraulics in Civil and Environmental Engineering, 5th ed. Boca Raton, FL: Taylor & Francis. [ Links ]
Chanson, H 1992. Air entrainment in chutes and spillways. Report CE133, Brisbane, Australia: University of Queensland, Department of Civil Engineering. [ Links ]
Jordaan, J M 1989. The Roberts splitter: Fifty years on. The Civil Engineer in South Africa, 31(10): 319-321. [ Links ]
Langa, M C 2015. Dam spillway energy dissipation by Roberts splitters: Study of cavitation and aeration requirement. Final year research dissertation, Stellenbosch University. [ Links ]
Mason, P J 1983. Energy dissipating crest splitters for concrete dams. International Water Power & Dam Construction, 35(11): 37-40. [ Links ]
Roberts, C P R 1980. Hydraulic design of dams. Report. Pretoria: Department of Water Affairs, Forestry and Environmental Conservation, Division of Special Tasks. [ Links ]
Roberts, D F 1943. The dissipation of the energy of a flood passing over a high dam. Proceedings of the South African Society of Civil Engineers, XLI(1): 48-92. [ Links ]
Roberts, P R 1977. Energy dissipation by dam crest splitters. The Civil Engineer in South Africa, 19(11): 263-264. [ Links ]
Robertson, G K 2014. Labyrinth weir hydraulics: Validation of CFD modelling. MEng dissertation, Stellenbosch University. [ Links ]
USBR (United States Bureau of Reclamation) 1987. Design of Small Dams, 3rd ed. Washington, DC: US Department of the Interior: USBR. [ Links ]
Vanderkloof Dam 2014. About Vanderkloof Dam. Available at: http://www.vanderkloofdam.co.za (accessed on 24 October 2014). [ Links ]
 Correspondence:
Gerard Calitz
Aurecon Centre
Lynnwood Bridge Office Park
4 Daventry Street
Lynnwood Manor
Pretoria 0081
South Africa
T: +27 12 427 2823
E: gerard.calitz@aurecongroup.com
PROF Gerrit Basson Pf Eng (FSAICE)
Department of Civil Engineering
Stellenbosch University
Private Bag X1
Matieland 7602
South Africa
T: +2 7 21 80 8 4355
E: grbasson@sun.ac.za

GERARD CALITZ obtained his MEng in Civil Engineering cum laude from Stellenbosch University in 2016. He currently works in Aurecon's Pretoria office as a graduate civil engineer specialising in the design and detailing of hydraulic structures. His research interests include dams, dam spillways and open channel hydraulics.

PROF GERRIT BASSON Pf Eng (FSAICE) is Head ofthe Water Division in the Department of Civil Engineering at Stellenbosch University, South Africa. He specialises in river hydraulics, sedimentation and design of hydraulic structures. He has 30 years' experience in the design of hydraulic structures and iswell known internationally as the recent past vice-president of ICOLD (International Commission on Large Dams) and of WASER (World Association of Sediment and Erosion Research). He has work experience from 21 countries and has been involved in several missions of the World Bank as expert.

