


Services on Demand
Article
 English (pdf)
 Article in xml format
 Article references
Indicators

Related links
-
 Cited by Google
 -
 Similars in Google
Share

 Permalink
Journal of the South African Institution of Civil Engineering
On-line version ISSN 2309-8775
Print version ISSN 1021-2019
J. S. Afr. Inst. Civ. Eng. vol.60 n.1 Midrand Mar. 2018
http://dx.doi.org/10.17159/2309-8775/2018/v60n1a1
TECHNICAL PAPER
Measurement of free-flow conditions on multilane intercity highways under heterogeneous traffic conditions
A Boora; I Ghosh; S Chandra; K Rani
ABSTRACT
Vehicles travelling at their desired speed under free-flow conditions (FFC) on a highway without getting influenced by other vehicle types travelling in the same lane exhibit a good level of service (LOS) on that particular highway facility. Few studies could be identified that provide guidelines on the measurement of FFC on multilane highways, including the latest version of the United States' Highway Capacity Manual (TRB 2010). As these guidelines are mostly based on homogeneous traffic conditions, they may or may not be applicable to heterogeneous traffic conditions. Previously used methodologies (for two-lane and multilane highways) were examined in the current study, but were found to be unsuitable for multilane highways. Therefore a new measure, named speed difference (SD), was introduced in the present study. SD is the difference in speed of two consecutive vehicles travelling in the same lane. A relationship was established between SD and gap (the difference between two consecutive vehicles from back to front bumper while travelling in the same lane), instead of headway (the difference between two consecutive vehicles from back to back or front to front bumper while travelling in the same lane). A gap value of 10 seconds was identified, beyond which vehicles would be travelling in FFC. The guidelines proposed in the present study will be helpful for traffic engineers and planners in developing countries.
Keywords: free-flow condition, gap threshold, headway threshold, speed difference
INTRODUCTION
India has the second longest road network in the world - 5 263 001 km covering different road categories, namely national highways, state highways, other PWD roads, rural roads and urban roads, as per the annual report of the Ministry of Road Transport and Highways (MoRT&H 2015). As per the latest basic road statistics of MoRT&H (2013), two-lane roads dominate with 53% of the total road network, while multilane highways (four lanes or above) represent around 25%.
The latest statistics of MoRT&H (2015) show that vehicle ownership is continually increasing in India. This growth in the number of vehicles on the highways results in increased congestion, making it difficult for vehicles to travel at their desired speed (vehicles are forced to travel at a lower speed as they are influenced by the presence of vehicles in the adjacent lanes). At the same time different vehicle categories with different static and dynamic characteristics use the same roadway facility, and this further increases the vehicular interaction in the traffic stream. This diversity in traffic characteristics makes it more challenging to identify FFC as a part of capacity and LOS measurements. This is particularly the case in developing countries, e.g. India. If vehicles on a particular highway travel at speeds lower than their desired speed, it represents a poor LOS (as the number of followers will be more). Followers are those vehicles that travel behind a slow-moving vehicle willingly or unwillingly (due to the absence of suitable sight distance and gap to enable overtaking). Vehicles can travel at their desired speeds under FFC only (i.e. interaction between vehicles will be minimum). FFC is the condition where vehicles travel at their desired speed without any influence from vehicles travelling in the same lane or adjacent lane. As it is clear that the FFC is directly related to LOS, there is a need to identify the FFC for four-lane divided highways. As there are no concrete definitions or guidelines to calculate free-flow speed (FFS) on four-lane divided highways under heterogeneous traffic conditions, research ers globally are typically using the same guidelines as suggested by the US HCM (TRB 2010) (i.e. to calculate the FFS at low traffic volumes of 1 400 PCU/hr or less). But the FFS observed using this guideline can be different from the actual FFS, particularly at a different time interval (e.g. from 11:00 to 13:00, or from 16:00 to 18:00). It was concluded earlier (Dixon et al 1999) that the HCM guidelines could not be used to calculate FFS. Tseng et al (2005) calculated FFS by taking those vehicles that were travelling with a headway value greater than 5 seconds as vehicles travelling in FFC without getting influenced by other vehicles present on the same roadway facility. Arasan and Dhivya (2010) conducted a study to determine the concentration of heterogeneous traffic conditions on multilane highways. The FFS in their study was calculated at low traffic volumes, as the movement of a vehicle was not influenced by the presence of another vehicle in the same lane or in the adjacent traffic lane on the same highways facility. Alternatively, Semeida (2013) calculated the FFS of vehicles that were travelling with a headway value greater than 8 seconds, while Robertson et al (2014) described free-moving vehicles as those vehicles that were travelling with headway values of 5 seconds, and tailway values of 3 seconds. In most of these studies, the FFS was calculated by adopting th guidelines from what had previously been proposed for two-lane highways. In the lit erature only a single study was found that related to the car-following interaction. Al-Kaisy and Karjala (2010) used eight study sites in Montana State to examine car-following behaviour, as well as to calculate the FFS on two-lane roads and four-lane roads. It was concluded from the study that after 6 seconds headway thresh old, interaction between different vehicles diminishes and vehicles will travel at their FFS or in FFC on two-lane roads. In the case of four-lane roads no pattern was observed, and it was concluded that the vehicle interaction on multilane highways under low traffic volume is very difficult to observe. An earlier study (Fitzpatrick et al 2005) was conducted to calculate FFS in suburban/urban and rural areas by taking the average speed of the vehicles that were travelling with 5 seconds headway and 3 seconds tailway. In another study (Figueroa & Tarko 2005) a headway value equal to or greater than 5 seconds was identified, beyond which vehicles were found to travel in FFC on the tangent segment and horizontal curve of two-lane rural highways. Earlier, Al-kaisy & Durbin (2008) proposed a headway threshold value ranging from 5 to 7 seconds, beyond which interaction between vehicles diminished, i.e. the vehicles were travelling in FFC. Another study (Lobo et al 2011) was conducted on Portuguese two-lane rural roads to calculate the FFS, and a free gap of 6 seconds was found appropriate to calculate the FFS, as vehicles were travelling in a free condition beyond that gap value. In another study, Hashim (2011) analysed speed characteristics on two-lane rural highways in Egypt. From the study it was revealed that 85th percentile speed did not vary after a critical headway value of 5 seconds, which indicates that vehicles will travel in FFC after 5 seconds headway value, and FFS can be calculated for headway value equal to or more than 5 seconds between two consecutive vehicles. In contrast, Vogel (2002) characterised free vehicles in urban areas by collecting the data on a single location, which was a four-leg two-way stop-controlled intersection with a 6 seconds headway, beyond which interaction between vehicles was diminished, while another study (Radwan & Kalevela 1985) suggested a headway greater than 9 seconds to identify FFC. But these guidelines are based on homogeneous traffic conditions and may or may not be applicable to heterogeneous traffic conditions, as the use of these guidelines can give misleading results. Measurement of FFS is required to exhibit the LOS provided to the road users, i.e. vehicles travelling at their desired speed in FFC exhibit good LOS at that particular site, otherwise there is a need to widen (i.e. in the case of congestion) the roadway. Besides this, once the FFS has been obtained for the different study sites, a capacity model can be developed by using the ratio of FFS to the capacity values of different sections, which makes the capacity estimation easy in the field. Therefore, instead of applying the guidelines directly to four-lane divided multilane highways, all the previously used methodologies for multilane and two-lane highways are examined in this study.
DATA COLLECTION
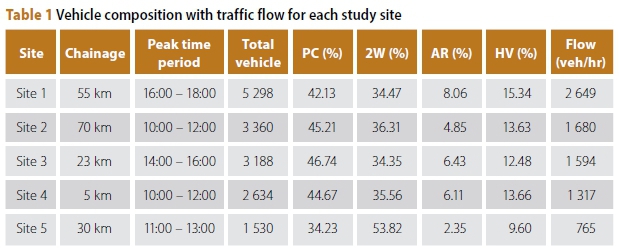
Different study sites were identified, namely NH-3 (Mumbai-Nashik Highway) for Site 1, three sections (Sites 1, 2 and 3) from NH-58 and SH-30 (Ujjain-Indore Highway), and Site 5 which was selected from different regions of India. All of the study sites are located on level terrain. These study sites were located far away from any influence factors such as curves, traffic control devices and access points up to 500 m in both directions. The data collection was conducted during daylight hours (between 08:00 and 18:00) on typical weekdays using a videography technique. A longitudinal trap of 50-60 m was made on the road surface for measuring the speed. A video camera was positioned in such a manner that each vehicle could be identified easily along the entire trap, especially at the entry and exit points. Data extraction was done manually by playing the video in the laboratory on a large television screen for a different time interval (peak hours only) as per the study requirements, as shown in Table 1. Consequently traffic volume, composition, vehicular speed, 85th percentile speed, and the travel mean speed of both the traffic stream and every vehicle category were calculated. The headway and gap values between two consecutive vehicles travelling in a lane were extracted from the collected video data. Vehicles were categorised into four categories, namely passenger car (PC), motorised two-wheeler (2W) (motor cycle), auto-rickshaw (AR) (three-wheeler) and heavy vehicle (HV). This was done for all five study sites, as shown in Table 1.
Other vehicle categories, such as animal-drawn vehicles and bicycles, were not considered in the study. The traffic volume was found to vary from 765 veh/hr to over 2 649 veh/hr. The variation in traffic composition is shown in Table 1, which indicates a high proportion of PC on all the study sites, except Site 5 where 2W was dominating the traffic.
MEASUREMENT OF FREE-FLOW CONDITION
In the present study, previously used methodologies that were proposed for two-lane highways in order to identify the FFC, are tried for multilane highways under heterogeneous traffic condition. As discussed earlier, Al-Kaisy and Karjala (2010) carried out a study to examine the car-following interaction on two-lane highways, as well as on multilane highways. A headway threshold value of 6 seconds was identified, beyond which all vehicles were travelling in FFC, while on multilane highways contradicting results were obtained, i.e. average travel speed (ATS) was decreasing with headway threshold value.
In another study Hashim (2011) identified a headway value of 5 seconds, beyond which vehicles were identified as free-moving vehicles (i.e. travelling with equal to or greater than 5 seconds headway value), while Al-kaisy and Durbin (2008) identified FFC with headway threshold values ranging from 5 to 7 seconds. In the present study, same methodologies were examined by establishing different relationships for headway threshold with ATS and 85th percentile speed of the traffic stream (i.e. including all vehicle categories) for all the study sites. Here the ATS of vehicles travelling with the same or greater than a specific headway threshold value were plotted at all the study sites. Figure 1 shows the same relationship for Site 4 and Site 5. It is a general hypothesis that ATS will increase with an increase in headway value and become constant after a critical headway threshold value which exhibits FFC. At study Site 4, the ATS was found to decrease with increasing headway threshold value, which contradicts the general expectation, as shown in Figure 1(a), while in the case of Site 5, ATS was found to increase with headway threshold value, as shown in Figure 1(b). But none of these graphs showed any headway threshold value beyond which vehicles could be characterised as free-moving vehicles as obtained in a previous study (Al-Kaisy and Karjala 2010).
The main reason for the contradicting results could be the difference in traffic volumes, as shown in Table 1. Another reason could be driver behaviour and age (e.g. an aggressive driver). Following this, other relationships were established at all the study sites for 85th percentile speed with a headway threshold value in order to identify the FFC. The same hypothesis was made for 85th percentile speed with a headway threshold value as made in the case of the ATS. However, no trend was observed from any graph, as shown in Figures 1(c) and 1(d).
Similar relationships were developed for all the study sites and similar results were obtained as shown in Figure 1 for Site 4 and Site 5. A total of about 15 369 headway and gap values were observed during the analysis. Consequently, a new definition for headway threshold value was introduced in the present study in which ATS and 85th per-centile speeds of vehicles travelling with less than a specific headway value were plotted. Figure 2 shows such a relationship for the same study sites (Site 4 and Site 5). However, after plotting the graphs, the ATS was found to decrease with the headway threshold value at Site 4, which contradicts the general hypothesis (i.e. due to the variation in vehicle length which also affects the headway value and result), while at Site 5 the relationship of the ATS with headway threshold value did not show any trend, as the ATS was found to increase with the headway threshold value. On the other hand, 85th percentile speed also did not show any trend as per the general hypothesis. At Site 5, 85th percentile speed was found to increase with the headway threshold value, while no trend was observed at Site 4, as shown in Figures 2(d) and 2(c) respectively. It was concluded from Figures 1 and 2 that headway cannot be used to identify the FFC in which vehicles would travel at their desired speed. Difference in the traffic characteristics of developing and developed countries (i.e. heterogeneous versus homogeneous) can be a reason why previous methodologies seem inappropriate for heterogeneous traffic conditions.
Earlier, Van As (2003) and Penmetsa et al (2015) also observed that US HCM methodologies are not appropriate for heterogeneous traffic conditions. Van As (2003) proposed a headway value of 3.5 seconds to identify the following vehicles instead of 3.0 seconds as proposed by the HCM 2000 (TRB 2000), while Penmetsa et al (2015) proposed a gap value of 2.6 seconds to differentiate follower and not-following vehicles. Consequently, gap value was used instead of headway to measure the FFC in the present study.
Characterisation of gap distribution
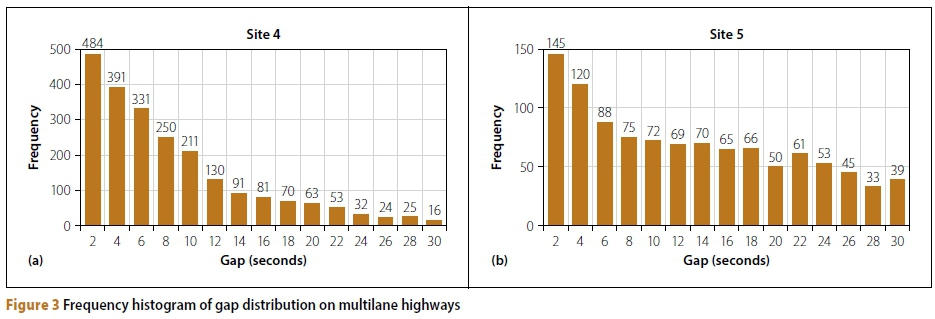
As gaps do not vary with vehicle length, it was used in the present study to identify the FFC. Initially, in order to understand the vehicle interaction on multilane highways, gap distributions were investigated at all the study sites. A frequency histogram showing the gap distribution at two of the study sites (Site 4 and Site 5) is shown in Figure 3. As the traffic volumes varied from low to a high on all the study sites, data up to a 30 seconds gap value was used to analyse the gap distribution. The general pattern shows the high frequency at low gap values, which decreased gradually with an increase in the gap value between vehicle arrivals at both study sites. From these distribution graphs, two regions were identified. The first region was identified where a sharp decrease in frequency was observed, which was evident in the first five gap values, while the second region was identified after the first five gap values where a steady decrease in frequency was observed. The kink in the fictional curve is found between two regions some place after a gap value of 10 seconds. Earlier, Miller (1961) identified this boundary with a headway value of 6 seconds at two-lane highways. The same histograms were plotted for the remaining study sites, which also exhibited the same trend.
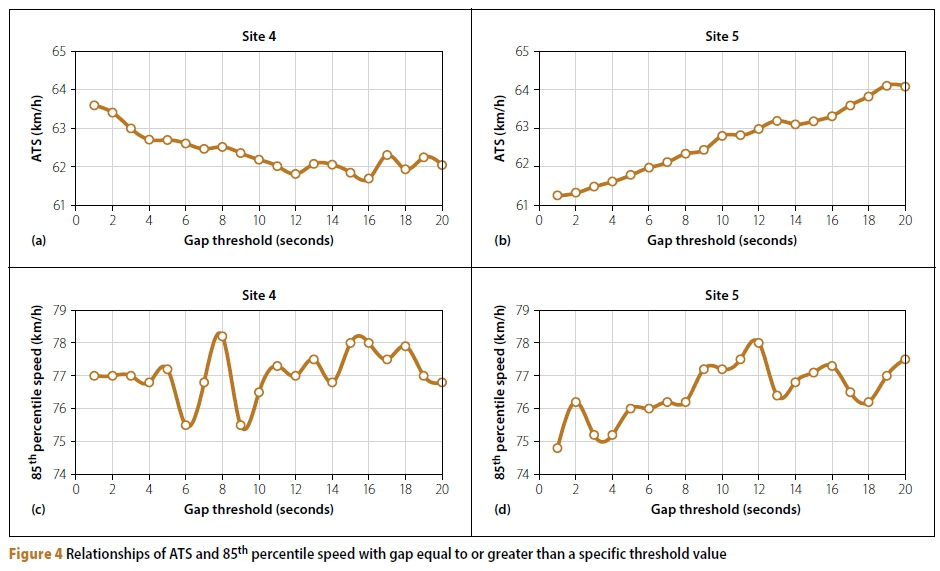
Thereafter different graphs were plotted for ATS and 85th percentile speeds with a gap equal to or greater than a specific gap threshold value as plotted earlier, with a headway threshold to identify the FFC as shown in Figure 4. Similar results were obtained with the gap threshold as in Figure 1. Later on, these graphs were plotted again with the gap less than a specific gap threshold value, as shown in Figure 5. As is evident from Figure 5(a) in the case of Site 4, the ATS did not show any trend, while at Site 5 the ATS was found to increase with gap threshold value, as shown in Figure 5(b). On the other hand, 85th percentile speed also did not show any trend with the gap threshold value. After analysing different relationships of ATS and 85th percentile speed with headway and gap threshold values, it was concluded that previously used parameters to identify the FFC on multilane highways under heterogeneous traffic condition cannot be used.
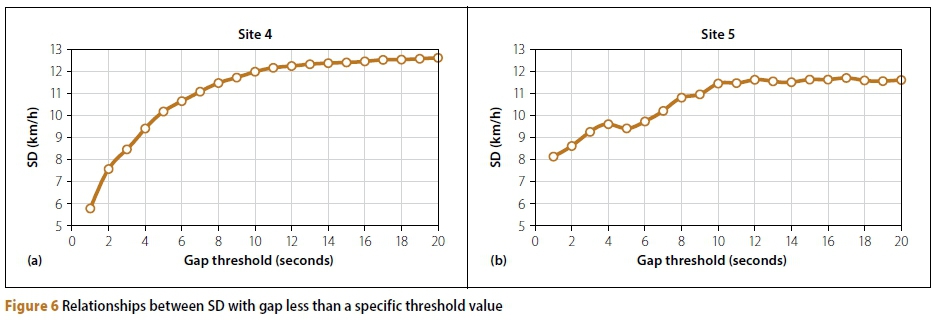
Because of that, a new measure, named speed difference (SD), was introduced in the present study. SD is the difference in speed of two consecutive vehicles in the same direction of travel in the same lane. Same relationships were established again for SD with gaps less than a specific gap threshold value at both study sites, as shown in Figure 6.
After analysing at the microscopic level it was observed that the SD between two consecutive vehicles increased continuous ly up to a critical gap value, beyond which this SD curve becomes almost flat. This gap value was observed to be 10 seconds, which indicates that a vehicle travelling with a gap value greater than 10 seconds can be considered as a free-moving vehicle travelling at its desired speed under FFC.
During the study, two types of drivers were identified - those who travel in following mode by choice and who can be termed as "happy to follow", and those wh< are forced to travel in following mode due to overtaking restrictions. A gap value of 10 seconds was identified, beyond which vehicles would travel as free-moving vehicles at their desired speeds on four-lane divided highways under heterogeneous traffic condition.
FOLLOWING BY CHOICE PHENOMENA
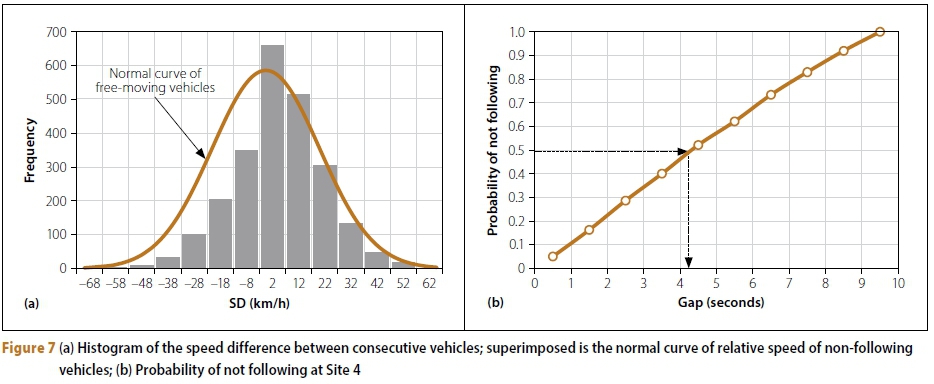
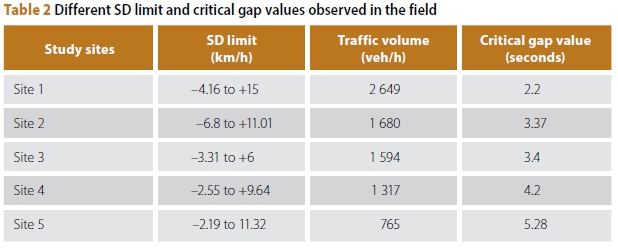
There is a possibility of free-moving vehicles below the 10 seconds gap value (i.e. happy to follow). So, there is a need to identify a critical gap value below which all vehicles would travel in following mode. A histogram of a whole data sample was plotted, as shown in Figure 7(a) for study Site 4. Simultaneously, a normal curve of free-flowing vehicles (i.e. travelling with equal to or greater than 10 seconds gap value) was superimposed on the histogram to identify an SD limit beyond which a vehicle would be in FFC, as shown in Figure 7(a). A superimposed normal curve intersects the histogram and exhibits an SD limit of -2.55 to +9.64 km/h, with a maximum number of vehicles travelling in the field. After observing the field data, an SD limit range of -7 to +15 km/h seemed more appropriate to identify the followers and non-followers. Later, an acceptance curve method was used to identify a critical gap value beyond or below which vehicles would travel as free vehicles and following vehicles respectively, as shown in Figure 7(b). A critical gap value of 4.2 seconds was identified, beyond which the probability of vehicles travelling in FFC would increase, as shown in Figure 7(b). Similarly, different SD limit ranges and critical gap values were identified on all the remaining study sites, as shown in Table 2. Due to the fact that a driver expects high speed at four-lane divided highways (as there is no interaction from the opposite direction), high ranges of SD were observed in the field, as shown in the second column of Table 2 on page 8.
DEVELOPMENT OF MODEL
It is difficult for traffic engineers and planners to repeat the full set of procedures in the field in order to identify followers and non-followers. Consequently, a model was developed by establishing the relationship between the traffic volume and the gap values observed on all the study sites, as shown in Figure 8. An exponential trend was found to be the best fit and can be expressed in mathematical form as shown in Equation 1.
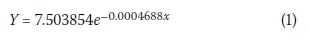
Where:
Y = Gap value
x = Traffic volume observed in the field
Validation of model
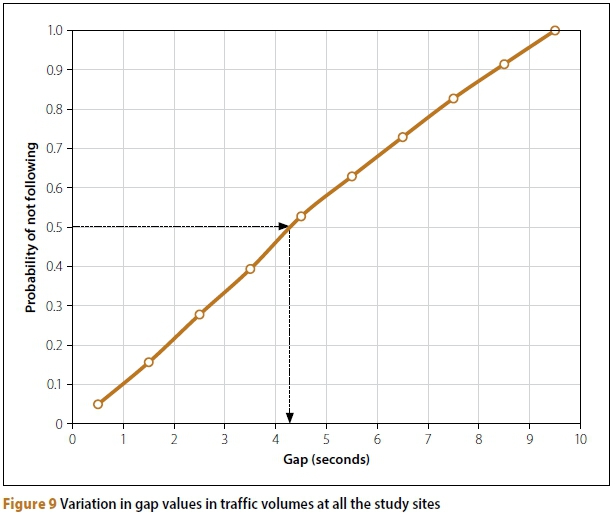
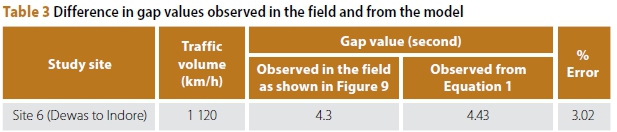
Thereafter a new study site located on the Dewas to Indore State Highway (SH)-18 was selected to validate the model. The same procedure was used to identify the critical gap value for SH-18 in the field that was used for Site 4, as shown in Figure 9. Table 3 shows the different gap values observed in the field, and from Equation 1. After comparing the gap value obtained from the field and from the model, an error of 3.02% was observed, which appears acceptable. By using this exponential model, users or traffic planners can identify the followers and non-followers easily, but this model is valid only for the particular range of traffic volumes as shown in Table 3.
SUMMARY OF FINDINGS AND RECOMMENDATIONS
In this study FFC was identified on four-lane divided multilane highways under heterogeneous traffic conditions. The most important findings of the study are the following:
■ It was concluded that previously used parameters (i.e. ATS and 85th percentile speed) and methodologies for two-lane highways cannot be used for multi-lane highways under heterogeneous traffic conditions.
■ It was also concluded that the headway cannot be used for multilane highways under heterogeneous traffic conditions to identify FFC, as it is dependent on vehicular length.
■ Gap is found appropriate instead of headway for heterogeneous traffic conditions, as it does not vary due to vehicle length.
■ A new measure named speed difference (SD) was introduced in this study and found to be appropriate in identifying the FFC.
An SD limit ranged from -7 to +15 km/h and a gap value of 10 seconds were identified. This gap value was used to identify the followers on four-lane divided highways under heterogeneous traffic conditions.
■ Consequently, an exponential model was also developed to identify the critical gap value in the field.
■ The empirical observation revealed that the vehicle interaction diminished after a 10 seconds gap value on four-lane divided multilane highways.
■ A significant proportion of drivers give preference to maintaining a shorter gap while travelling on four-lane divided highways, irrespective of passing (overtaking) restrictions.
This analysis of four-lane divided highways under heterogeneous traffic conditions can be further extended by using comprehensive field data from different parts of the country. Guidelines proposed in the present study to identify the FFC on four-lane divided highways would help traffic engineers and planners to calculate the FFS under heterogeneous traffic conditions. Furthermore, different LOS thresholds can be calibrated for four-lane divided highways under heterogeneous traffic conditions using the guidelines proposed in this study.
ACKNOWLEDGEMENTS
The work reported in this paper is part of an ongoing research project (Development of Indian Highway Capacity Manual (INDO-HCM)) sponsored by CSIR-CRRI, New Delhi, India. The financial assistance provided by the sponsoring agency for traffic studies is gratefully acknowledged.
REFERENCES
Al-Kaisy, A & Durbin, C 2008. Evaluating new methodologies for estimating performance on two-lane highways. Canadian Journal of Civil Engineering, 35(8): 777-785. [ Links ]
Al-Kaisy, A & Karjala, S 2010. Car-following interaction and the definition of free-moving vehicles on two-lane rural highways. Journal of Transportation Engineering, 136(10): 925-931. [ Links ]
Arasan, V T & Dhivya, G 2010. Methodology for determination of concentration of hetrogeneous traffic. Journal of Transportation Systems Engineering and Information Technology, 10(4): 50-61. Available at: http://dx.doi.org/10.1016/S1570-6672(09)60052-0. [ Links ]
Dixon, K, Wu, C H, Sarasua, W & Daniel, J 1999. Estimating free-flow speeds for rural multilane highways. Transportation Research Record, 1678: 73-82. [ Links ]
Figueroa, A M & Tarko, A P 2005. Speed factors on two-lane rural highways in free-flow conditions. Paper presented at the 84th Annual Meeting of the Transportation Research Board, 9-13 January, Washington, DC. [ Links ]
Fitzpatrick, K, Miaou, S P, Brewer, M, Carlson, P & Wooldridge, M D 2005. Exploration of the relationships between operating speed and roadway features on tangent sections. Journal of Transportation Engineering, 131(4): 261-269. [ Links ]
Hashim, I H 2011. Analysis of speed characteristics for rural two-lane roads: A field study from Minoufiya Governorate, Egypt. Ain Shams Engineering Journal, 2(1): 43-52. Available at: http://dx.doi.org/10.1016/j.asej.2011.05.005. [ Links ]
Lobo, A, Jacques, M, Rodrigues, C & Couto, A 2011. Free-gap evaluation for two-lane rural highways. Transportation Research Record, 2223: 9-17. [ Links ]
Miller, A 1961. A queueing model for road traffic flow. Journal of the Royal Statistical Society. Series B (Methodological), 23(1): 64-90. [ Links ]
MoRT&H (Ministry of Transport & Highways) 2013. Basic Road Statistics of India 2011-12, p 109. New Delhi, India: MoRT&H. [ Links ]
MoRT&H (Ministry of Transport & Highways) 2015. Annual Report 2014-15. New Delhi, India: MoRT&H. [ Links ]
Penmetsa, P, Ghosh, I & Chandra, S 2015. Evaluation of performance measures for two-lane intercity highways under mixed traffic conditions. Journal of Transportation Engineering, 141(10): 04015021. [ Links ]
Radwan, A E & Kalevela, S 1985. Investigation of the effect of change in vehicular characteristics on highway capacity and level of service. Transportation Research Record, 1005: 65-71. [ Links ]
Robertson, J, Fitzpatrick, K, Park, E & Iragavarapu, V 2014. Determining level of service on freeways and multilane highways with higher speeds. Transportation Research Record, 2461: 85-93. [ Links ]
Semeida, A M 2013. New models to evaluate the level of service and capacity for rural multilane highways in Egypt. Alexandria Engineering Journal, 52(3): 455-466. Available at: http://dx.doi.org/10.1016/j.aej.2013.04.003. [ Links ]
TRB (Transportation Research Board) 2000. HCM (Highway Capacity Manual) 2000. Washington, DC National Research Council. [ Links ]
TRB (Transportation Research Board) 2010. HCM (Highway Capacity Manual) 2010. Washington, DC National Research Council. [ Links ]
Tseng, P, Lin, F & Shieh, S L 2005. Estimation of free-flow speeds for multilane rural and suburban highways. Transportation, 6: 1484-1495. [ Links ]
Vogel, K 2002. What characterizes a "free vehicle" in an urban area? Transportation Research Part F: Traffic Psychology and Behaviour, 5(1): 313-327. [ Links ]
Van As, C 2003. The development of an analysis method for the determination of level of service of two-lane undivided high-ways in South Africa. Project Summary. Pretoria: South African National Roads Agency Limited (SANRAL). [ Links ]
 Correspondence:
Amardeep Boora
Department of Civil Engineering, Indian Institute of Technology Roorkee Uttarakhand
India 247667 T: +91 9416 803757
E: amardeepboora9@gmail.com
Rindrajit Ghosh
Department of Civil Engineering, Indian Institute of Technology Roorkee Uttarakhand
India 247667 T: +91 1332 285533
E: indrafce@iitr.ac.in
DR Satish Chandra
Central Research Road Institute (CRRI)
Mathura Road, New Delhi, India 110025
T: +91 1126 848917
E: satisfce@gmail.com
Kavita Rani
Department of Civil Engineering, Indian Institute of Technology Roorkee Uttarakhand
India 247667 T: +91 9468 478687
E: kavita12aug@gmail.com
AMARDEEP BOORA received a Bachelor of Technology (BTech) degree from Kurukshetra University, Kurukshetra, India, in 2010, and a Master of Technology (MTech) from the National Institute of Technology Kurukshetra (NIT) in 2012 on the topic "Effect of fly ash on the CBR value of different soils". He is currently a PhD research scholar at the Indian Institute of Technology (IIT) Roorkee, India, and is working on the topic "Operational performance measures for intercity roads". He has published more than ten research papers in reputed international journal! and conference proceedings.

RINDRAJIT GHOSH is an Assistant Professor at e Indian Institute of Technology (IIT) Roorkee, dia. He received his Bachelor of Engineering E) and Master of Engineering (ME) degrees om the Bengal Engineering and Science niversity, Shibpur, India, in 2003 and 2005 respectively, and a Master of Science (MS) and PhD degrees in Civil Engineering from Wayne State University, Detroit, Michigan, United States, in 2008 and 2010. He is a Member ofthe Institute of Transportation Engineers (ITE) and an Associate Member of the American Society of Civil Engineers (ASCE). He has teaching experience of more than six years, and has published several research papers in reputed international journals and conference proceedings. He has been involved in research on traffic safety and operations, traffic management and transportation data analysis using statistical and econometric methods.
DR SATISH CHANDRA is currently the Director of the Central Road Research Institute (CRRI), New Delhi (since January 2016). Prior to that he was Professor ofTransportation Engineering at the ndian Institute of Technology Roorkee. Dr Chandra has published more than 200 research papers in journals and conference proceedings. He developed the original concept of the Dynamic Passenger Car Unit for mixed traffic conditions He has guided 17 PhD and more than 100 MTech dissertations, and he was the nodal officer for preparing the Indian Highway Capacity Manual.

KAVITA RANI received her Bachelor of Technology (BTech) from Kurukshetra University, Kurukshetra, India, in 2012, and a Master of Technology (MTech) degree from the Indian Institute of Technology Roorkee, Roorkee, India, in 2017 on the topic "Wal kab il ity analysis of urban transport network".

