


Services on Demand
Article
 English (pdf)
 Article in xml format
 Article references
Indicators

Related links
-
 Cited by Google
 -
 Similars in Google
Share

 Permalink
Journal of the South African Institution of Civil Engineering
On-line version ISSN 2309-8775
Print version ISSN 1021-2019
J. S. Afr. Inst. Civ. Eng. vol.59 n.4 Midrand Dec. 2017
http://dx.doi.org/10.17159/2309-8775/2017/v59n4a6
TECHNICAL PAPER
Application of metaheuristic algorithms to the improvement of the MyCiTi BRT network in Cape Town
OA Nnene; MHP Zuidgeest ; EA Beukes
ABSTRACT
This paper discusses a design approach aimed at improving bus transit networks and their operations. In combining metaheuristic algorithms and a GIS procedure the paper shows how the level of network utilisation of a bus service can be improved. To achieve this goal, the procedure is applied to the design of a bus network. It is then, accordingly, compared with the current phase of the MyCiTi BRT network in the City of Cape Town, South Africa. The results indicate that the designed network performs better in terms of network utilisation and other operational parameters. It is hoped that this research will add value to the design and implementation of bus networks in Cape Town, together with their operation.
Keywords: MyCiti, metaheuristics, network design, network utilisation, BRT
INTRODUCTION AND PROBLEM DESCRIPTION
The large amount of resources (economic, land and environmental) required to supply transportation infrastructure and services, makes it imperative to continually seek cheaper ways of providing them. Such initiatives include, inter alia: developing and adopting optimal transit network design procedures, implementing travel demand management schemes, and reviewing existing public transit policies and practices with a view to improving them. A case study is the ongoing Bus Rapid Transit (BRT) moderation exercise in the City of Cape Town, as revealed in the MyCiTi business plan update (CoCT 2015), which was embarked upon by the transportation authority in the City with the aim to:
1. Optimise the network in order to increase its utilisation levels
2. Curtail some routes and frequencies where demand is low
3. Tackle administrative issues that hamper the smooth running of the service
4. Investigate potential cost reductions resulting from improved bus/driver ratios
5. Develop strategies for Transit Oriented Development (TOD) and shifts in urban form, over the longer term, to improve sustainable transport services.
While this list is not as exhaustive as articulated in the original business plan, the scope of the work described here is restricted to the first two points that deal with network design and operations management. Therefore, with the implementation of the Cape Town BRT services still in its early stages, the main objective of this paper is to propose a model which can be used to optimise the existing network, thereby improving its utilisation. The results will also inform the future design and implementation of the MyCiTi BRT.
Cape Town's public transportation network is comparable to those in other South African cities. Some features of the network include the existence of non-integrated public transit services; imbalanced network utilisation (over-utilised in some parts of the City and under-utilised in others), due to flawed legacy transportation planning policies; and selective network coverage, which imposes high network access costs on some inhabitants, particularly the urban poor of the City (Behrens 2004).
Some of these issues arise from the existing transit network design approaches in the City, which basically involves the development of ad-hoc solutions to given network design problems. In contrast, this paper will attempt to improve the existing service by utilising Public Transit Network Design (PTND) knowledge, which focuses on the systematic application of mathematical modelling techniques and computer-based algorithms to solve transit network problems. With recent advances in computational science it is now possible to take on large-scale transit network problems. This may not have been possible previously, due to the prohibitive cost in terms of computing resources. To this end, an innovative model for network optimisation, which is adapted from genetic algorithms (GA) and combined with a GIS-based operation, is presented in this paper. The model is compared with the first phase of the MyCiti network to demonstrate how an improvement in network utilisation can be achieved.
LITERATURE REVIEW
Transit Network Design (TND) deals strictly with the planning of transit lines and the efficient coordination of their operations to provide a satisfactory service to passengers (Ceder 2015). It branches out of the broader transportation planning field and concentrates on the optimised design of transportation networks by attempting to minimise transit costs and maximise network operating efficiency, subject to certain feasibility constraints. When formulated as an optimisation problem, a Transit Network Design Problem (TNDP), is typically characterised by an objective function which is a mathematical expression to be optimised, constraint(s) that should be satisfied in order to arrive at a feasible solution, and design variables and other parameters.
According to Baaj and Mahmassani (1991), TNDPs, especially large-scale ones, are typically combinatorial optimisation problems. Such problems have a finite set of solutions with a defined representation, such as a graph, while the number of potential solutions is enormous and grows exponentially as the number of decision variables increases (Schrijver 2003). TNDPs can be classified in the computational complexity literature as "np-hard" (non-deterministic polynomial time). This implies that their equivalent decision problem is np-complete, hence there is no verifiable efficient algorithm that exists to solve them in polynomial time (Talbi 2009; Fan & Machemehl 2004). Consequently, searching through the entire solution set for the optimal solution is virtually impossible. This situation therefore calls for the development of a strategy to search for a good solution to the problem within an acceptable time frame, with the possibility that the solution may not necessarily be optimal, but is considered good enough given the circumstances.
MODEL FORMULATION
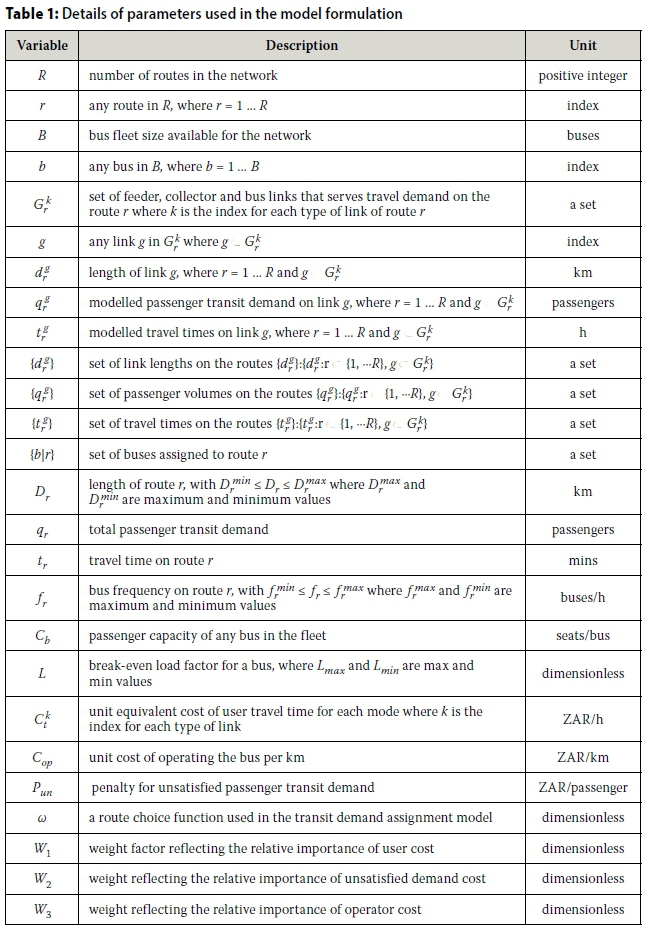
The objective of this transit network design optimisation problem is to obtain a solution from a population of feasible network options, which minimises transit costs for the users and operators of a given bus network, subject to feasibility constraints on route length, route frequency, bus capacity, bus breakeven load factor and travel demand assignment. The objective function of the optimisation model therefore seeks to reduce costs for users, as a way of increasing the utilisation of the service. The parameters used in the model formulation are presented in Table 1.
In formulating the objective function the following three separate terms are formulated, and each one is subsequently described in full:
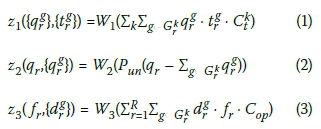
The terms represent the sets of passenger volumes, travel times and the length of the component links of the network routes (see Table 1). The objective function (see Equation 4) comprises three terms (z1, z2 and z3 in Equations 1-3 above). In z1which symbolises the total weighted cost of travel incurred by users over the network (comprising passenger access time and in-vehicle travel time), the link set
  represents all the links (feeder collector and main links) that facilitate passenger flow on the network routes, with the index k denoting the travel mode for each link group. Similarly, the equivalent time cost for the links is represented by
  which is the link cost by mode for each respective link k. Lastly,
  and
and  are the passenger volume and travel time on each link. It should be noted that there is room for the inclusion of additional time factors in the formulation of the user cost, such as transfer time; however, such modifications fall outside the scope of this paper. The expression z2(see Equation 2) denotes the weighted cost of unsatisfied demand represented as the difference between the total transit demand qr and the demand served by the sum of links on each network solution
  .Finally, z3(see Equation 3) represents the weighted operator cost of travel over the network. It should be noted that the values for the cost factors (see
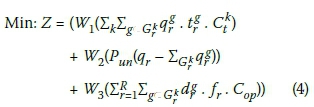
  , Punand Copin Table 1) and weightings (see W1, W2, W3in Table 1) used in the objective function were obtained from transport experts from the City of Cape Town's Department of Transport. The objective function is thus stated as the summation of z1, z2and z3as follows:
Subject to:
Where:
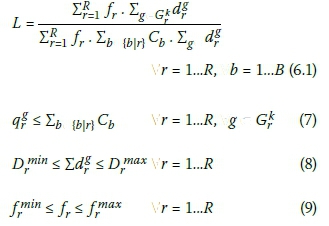
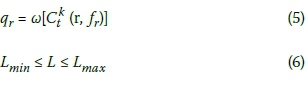
The first constraint in the model (see Equation 5) is a travel demand assignment constraint that describes user behaviour on the network in terms of passenger route choice, under equilibrium conditions, and it estimates the total volume of travel demand assigned to the bus network. Equation 6 is a bus break-even load factor constraint, which is a function of the number of passengers assigned to individual routes on the bus network. The constraint requires that the flows in full buses are bound by the maximum value (Lmax, see Equation 6) of the bus breakeven load factor L (see Equations 6.1) where {b|r} is the set of buses assigned to route r. Equation 7 is the bus capacity constraint which defines the maximum amount of passenger demand that can be satisfied on the network. Equation 8 is a route length constraint, which indicates the upper and lower bounds beyond which it would be illogical to operate the bus service. This constraint prevents the algorithm from proposing to operate a bus service on a route where walking is preferred, due to its short distance, or operating one on routes that are extremely long, which could discourage maintaining adequate bus schedules. The last constraint (Equation 9) is the frequency feasibility constraint, which is introduced to represent the maximum and minimum operable frequency on each route within the bus network.
EARLIER SOLUTION ATTEMPTS
Previous approaches of solving the TNDP were either empirical or analytical. Empirical techniques focus on the use of:
(1) proprietary transportation planning software which are often very expensive;
(2) documented strategies (design manuals) such as the South African Technical Recommendation for Highways (SATRH) and the National Cooperative Highway Research Program (NCHRP); and (3) other manually iterative processes. On the other hand, analytical methods employ mathematical programming techniques to solve a transit network design problem. However, the major criticism of empirical and analytical methods is their limited application to large-scale network design problems (Shih & Mahmassani 1994). This is occasioned by the overly simplistic assumptions that need to be made in formulating them as mathematical models, and the excessive computational time required to solve them (Chakroborty 2003).
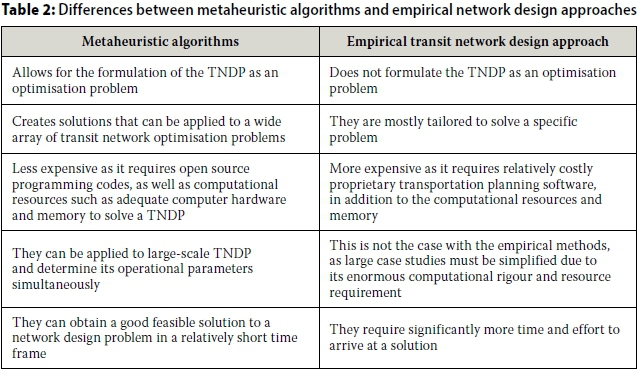
Owing to these limitations, computational solution techniques that utilise computer-based optimisation algorithms were developed to solve the TNDP. These classes of algorithms are considered an improvement on the earlier mentioned solution techniques, since they can generate "acceptable" solutions in a reasonable time. This paper therefore makes a case for the use of a computational approach based on metaheuristic algorithms in the design of public transit networks. Metaheuristics are a class of algorithms used as a strategy to guide the search for the solution of an optimisation problem. Examples of metaheuristics are genetic algorithms (GA), tabu search, simulated annealing, ant colony optimisation and greedy search algorithms (Fan & Machemehl 2006). Some of the differences between metaheuristic algorithms and empirical solution techniques are given in Table 2.
PROPOSED SOLUTION
The solution approach proposed in this paper will be implemented with an algorithm named a Bus Route Network Design Algorithm (BRNDA) (see outline of algorithm below). It is adapted from a genetic algorithm (GA). The choice of a GA as the solution algorithm in this paper is motivated by the issues raised in the preceding section, concerning the advantage of metaheuristics over empirical methods when applied to np-hard problems. Furthermore, the fact that genetic algorithms have also been used to find solutions to problems in several disciplines (Michalewicz 1996) make them a good fit for the problem at hand.
As reported by (Poli et al 2008), GA is a class of metaheuristic algorithms whose operations were conceptualised from the principles of natural selection and genetics.
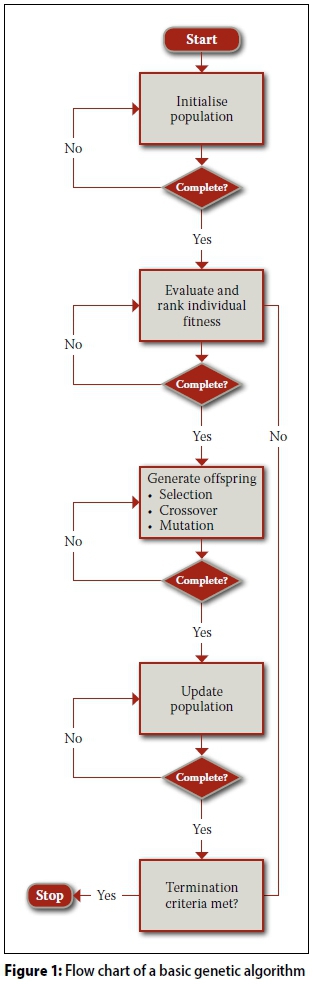
A typical GA (Talbi 2009; Michalewicz 1996) consists of a population of individuals or chromosomes which, in turn, contains genes. In terms of the TNDP, an individual (chromosome) will be a network with its routes denoting the genes. Each chromosome in the population usually represents a feasible solution, or in the case of the TNDP, a network solution. Genetic algorithms are approximate procedures and, as such, they do not obtain a globally optimal solution. However, they can generate a locally optimal solution (usually considered acceptable) in a reasonable amount of time. Typically an initial population is randomly generated in the first step of the GA, followed by an evaluation of the individuals in the population to determine their "fitness" or objective function value.
A pair of individual solutions or "parents" with desirable objective function values, chosen from the solution search space, has a higher possibility of combining to produce the next "generation of offspring" through a process known as "reproduction" (Kumar 2012). This process is facilitated by the interaction of genetic operators - selection, crossover and mutation (see Siriwardene & Perera 2006 for details). Generally the algorithm yields better generations in successive iterations until it attains a predefined termination criterion. In subsequent sections the operations of the BRNDA will be described, in addition to its application to a typical public transit network design problem. The solution space for the bus network problem, as modelled in the previous section, will be "searched" by the BRNDA for an "acceptable" solution, given, some predetermined criteria. A basic flow diagram of a GA is presented in Figure 1.
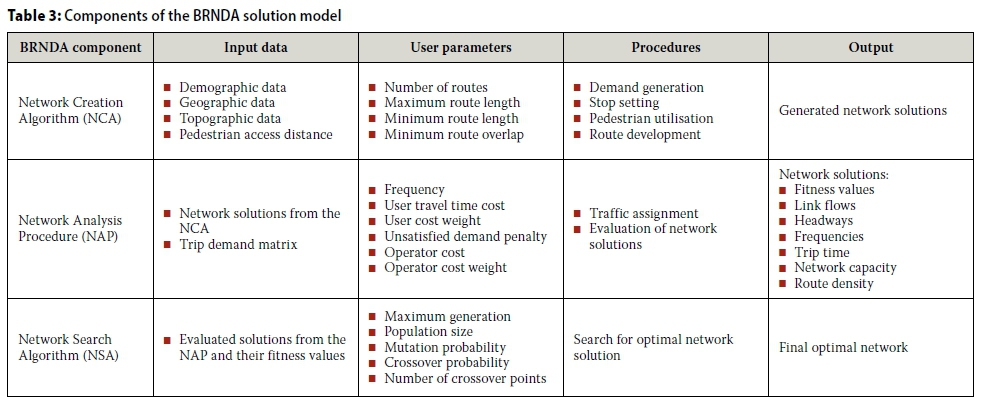
The so-called BRNDA comprises three sub-processes that are similar to the operators of a GA, namely (1) a generator function or Network Creation Algorithm (NCA), comprising the network generation and utilisation phases respectively; (2) an evaluator function or Network Analysis Procedure (NAP), which analyses the generated bus network; and (3) a GA-based Network Search Algorithm (NSA), a solution strategy that involves the simulation of biological evolution. In the BRNDA, each individual solution is represented by a bus network option that possesses a specific number of genes or routes. The BRNDA is developed with the Python scripting language (Python Software Foundation 2012), using two open-source libraries - Inspyred Evolutionary computation library (Garrett 2014) and networkX graphing library (Hagberg et al 2008). The former offers an extensible GA template which the authors modified by writing custom functions for the BRNDA, while the latter is used to represent the topology of the network solutions in graphical format. The components of the solution model proposed in this paper can be seen in Table 3.
Network Creation Algorithm (NCA)
The network creation stage of the BRNDA is essentially a three-step process comprising demand generation, stop setting and route development stages. An intermediate step between the stop setting and route developments, known as a pedestrian utilisation module, is also introduced to appropriately model pedestrian access to the designed network solution. The output of this stage is a large pool of feasible routes from which the initial bus network population will be initialised. The component steps of the BRNDA are discussed as follows:
Demand generation
The demand generation consists of the trip generation and trip distribution steps in the four-step transportation modelling process (de Dios Ortúzar & Willumsen 2011). Trip productions and attractions are estimated for each Transportation Analysis Zone (TAZ) within the Cape Town transportation area using available geographic, topographic, and demographic data of the study area's inhabitants.
Stop setting
After demand generation, the optimal number of stops within the transportation area under study is obtained by balancing the trade-off between the total average distance passengers need to access the stops and the average total travel time it takes a bus to operate between the stops. To achieve this, stops are initially generated randomly in the transportation area, followed by an iterative relocation of the generated stops, until the average distance for accessing the stops is minimal. It should be noted that, in this model, stops are not allowed on network links that coincide with freeways in the transportation area.
Pedestrian utilisation module
For pedestrian access to the final designed network, a GIS buffer tool is used to create buffer zones around the stops. The zones define the maximum distance a pedestrian must walk to access the given stop, hence pedestrian demand for the designed network will be obtained from within each stop's buffer zone. The objective of this operation is to accurately model pedestrian access to the stops of the designed network. For instance, if a buffer zone of 5 km is created around a stop, only pedestrians within the buffer zone can potentially access that stop. However, buffer distances of 1 km and 2.8 km were used in this work; the former was used for stops that are situated in parts of the City with access to public transit facilities, while the latter was specified for areas without access to the network. These specified buffer distances correspond with observed access distances discussed by Behrens (2004).
Route Development
At this stage, an implementation of Dijkstra's shortest path algorithm (Johnson 1973) is used to obtain the shortest path between the stops. The routes are created using criteria such as maximum and minimum route length, and maximum allowed deviation of the route from the shortest path. This pool of feasible routes, created through this process, serves as the source from which the BRNDA selects routes for each network solution when it initialises the population.
Network Analysis Procedure (NAP)
In the network analysis stage, candidate network solutions are analysed so that their performance can be evaluated. The initial step in the NAP involves the assignment of travel demand to each network solution by means of a user equilibrium assignment (Sheffi 1985), to obtain total travel demand (qrin Table 1) which is satisfied by the routes of each candidate bus network solution. After demand assignment, the unsatisfied demand for each respective network solution is evaluated as the difference between the total travel demand and the demand satisfied by that solution; each solution is penalised (Punin Table 1) in proportion to its amount of unsatisfied demand. The satisfied and unsatisfied demands are then used as inputs, alongside other objective function parameters, to evaluate the fitness scores for each network solution. Finally, the scores are then assigned to the respective solutions as their performance measure.
Network Search Algorithm (NSA)
After evaluating the generated networks, as discussed in the preceding section, the NSA starts by calling both the NCA and NAP respectively. The output from both functions, namely the generated candidate networks and their fitness values, are used as inputs in the NSA stage. The generated candidate networks are first initialised as parents, then individuals in the population are assigned their respective fitness values, after which the algorithm uses the fitness values to determine each individual's survival capacity. Lastly, the process of reproduction is carried out by the respective actions of the earlier discussed genetic operators - selection, crossover and mutation. A termination criterion (based on the number of generations) is then used to ensure that the algorithm stops once this criterion is met.
TESTING THE BRNDA
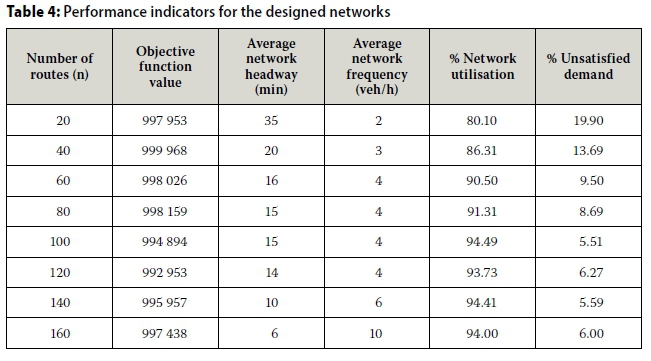
To test the BRNDA, networks of different sizes (20 - 160 routes) are designed and evaluated using both network and operational performance indicators. Data for the tests was made available by the transportation authority in Cape Town - Transport for Cape Town (TCT). A comparison is then made between the designed networks' characteristics to see if they are practical when compared to patterns obtained on realistic public transit networks. The results of the test are presented in Table 4, showing a combination of network-based and operational indicators.
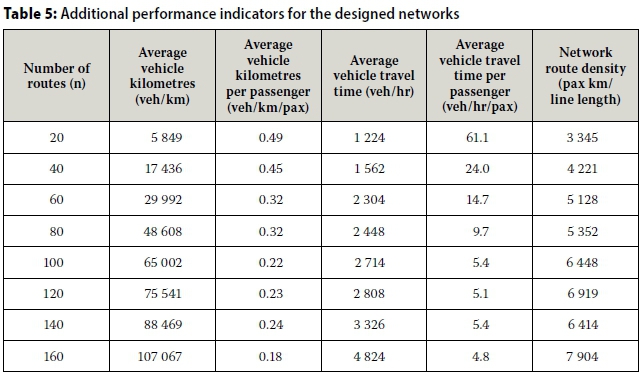
In Table 4 the network utilisation increases as the size of the network increases. This is realistic, since the amount of travel demand satisfied on a network usually grows as the number of operated routes increase. The best network option in terms of objective function value (Z in Equation 4) is the network with 120 routes. It can also be observed that it performs relatively better than the other options in terms of unsatisfied demand (Pun in Table 1). Another noticeable trend in Table 4 is that, as travel demand increases, there is a reduction in vehicle headways, which entails an increase in service frequency. Therefore, on the whole, passenger travel time and vehicle operating distance per passenger decrease. This observation implies that there is a general increase in network efficiency as travel demand increases, which justifies the axiom that the marginal cost of transit reduces with increasing ridership (Lee 2006). Finally, the results in Table 4 show that the network with 100 routes has the lowest unsatisfied demand (5.51%). However, this may be attributed to its low demand, hence among the larger networks the network with 120 routes has the least unsatisfied demand and highest network route density. Further numerical results in terms of vehicle operational characteristics, presented in Table 5, also show a realistic trend for the indicators, since there is an increase in average vehicle travel time and average vehicle travel distance as the network size (number of routes) increases. The obvious implication of an increase in the number of transit routes operated in a network is that there will be an increase in travel demand volumes (qrin Table 1) that can be handled, assuming that the network is not saturated. This will likely motivate an operator to increase the number of vehicle trips on that network, thereby resulting in an increase in the number of trips, longer vehicle operating hours, and longer vehicle operating kilometres.
Comparing the BRNDA Network to the MyCiTi BRT
In this section a bus network is designed with the BRNDA and compared with the MyCiTi BRT status quo network. Optimal values for design parameters, such as maximum number of generations, mutation and crossover probability factors, and weight factors utilised in this paper are obtained from a sensitivity analysis. With some of the earlier mentioned parameters being decimals (continuous over a very broad range) it was practically impossible to test all value combinations for these parameters, given the time constraints for the research. Hence, the strategy used to obtain a reference value for each parameter involved randomly generating a set of 30 values for each parameter, after which the algorithm was tested five times with the values, and the Mean Average Deviation (MAD) for each run was obtained relative to their objective function values. In the last stage of the test, the network characteristics of the best, median and worst design options were compared with that of the MyCiTi. Performance indicators are used, because the networks cannot be compared directly. As seen before in the testing stage of the BRNDA, a mix of both network and operational indicators are tested, including demand volumes, unsatisfied demand, area frequency, objective function values, total vehicle operating time, and total vehicle operating distance.
Numerical results
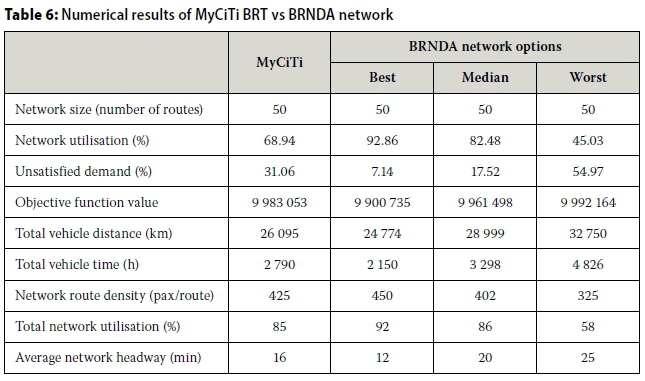
The numerical results, shown in Table 6, reveal some of the indicators obtained from the MyCiTi BRT network versus the best, median and worst performing BRNDA network solutions. The previously utilised indicators formed the basis of the comparison. The BRNDA's best network clearly shows a higher performance when compared to the status quo. These include a 34% increase in the volume of passengers it can handle, which indicates a higher network utilisation percentage. Furthermore, the objective function value of the designed network is also less than that of the MyCiTi, which shows that the BRNDA network was an improved solution, since the problem was modelled as a minimisation problem. Lastly, the higher efficiency of the BRNDA network can be seen in that it performs better relative to other indicators like network route density, total vehicle distance and total vehicle time.
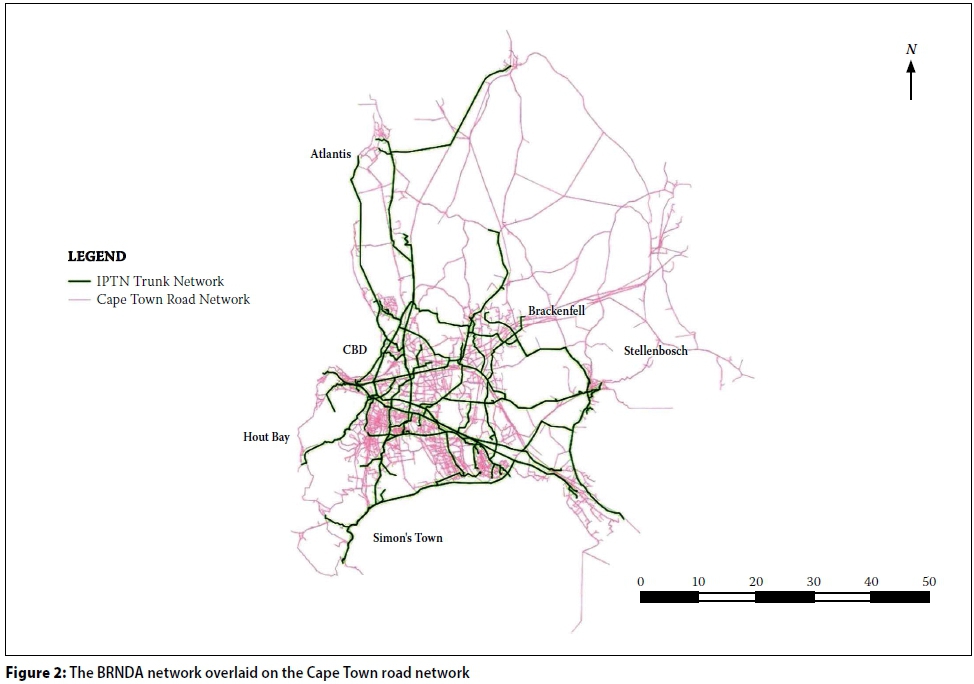
In Figures 2 (page 61) and 3 the BRNDA and the MyCiTi networks are respectively overlaid on the Cape Town road network. The routes of the BRNDA network, like those of the MyCiTi network, originate from the CBD. However, the former has a wider spread, especially towards the south-eastern parts of the City, which has the greatest need for public transport facilities (Behrens 2004). This implies that the BRNDA has a better network coverage, which increases the possibility of a higher network utilisation. These results suggest that the network, as designed in this paper, is an improvement on the existing MyCiTi BRT network and its service levels in terms of the earlier highlighted objectives. The results also assert the fact that the design approach used in this paper is superior to that used in designing the MyCiTi BRT network.
CONCLUSION
Current observed trends in the design of the MyCiTi BRT service in the City of Cape Town reveal the need to improve the service on many fronts - network utilisation, service operations, and even in administrative terms. A moderation exercise, which commenced in 2015, constitutes the greatest effort on the part of the City government to date of addressing some of these issues. As part of these efforts, the objective of this research was to propose a transit network design solution approach, based on computational algorithms, which could be used to improve the design of bus networks in the City. The results obtained indicate that the so-called BRNDA can design efficient bus networks. The results make a case for why the approach should be embraced, and it is recommended that metaheuristic algorithms should be considered as a crucial tool in the public transportation network planning toolbox in Cape Town. Future research efforts are currently underway to extend the research to a multimodal transportation context, and to utilise the research and study the effect of transportation policies, such as transport subsidies, in Cape Town.
REFERENCES
Baaj, M H & Mahmassani, H S 1991. An Al-based approach for transit route system planning and design. Journal of Advanced Transportation, 25(2): 187-209. [ Links ]
Behrens, R 2004. Understanding travel needs of the poor: Towards improved travel analysis practices in South Africa. Transport Reviews, 24(3): 317-336. [ Links ]
Ceder, A 2015. Public Transit Planning and Operation: Modeling, Practice and Behavior. Boca Raton, FL: CRC Press/Taylor and Francis. [ Links ]
Chakroborty, P 2003. Genetic algorithms for optimal urban transit network design. Computer-aided Civil and Infrastructure Engineering, 18(3): 184-200. [ Links ]
CoCT (City of Cape Town) 2015. MyCiTi Business Plan 2015 Update. Cape Town. Available at: http://www.myciti.org.za/en/about/management-reports/business-plan [ Links ]
De Dios Ortúzar, J & Willumsen, L G 2011. Modelling transport. Oxford, UK: Wiley. [ Links ]
Fan, W & Machemehl, R B 2004. Optimal transit route network design problem: Algorithms, implementations, and numerical results. Report No. SWUTC/04/167244-1, Austin, TX, Center for Transportation Research, [ Links ]
Fan, W & Machemehl, R B 2006. Optimal transit route network design problem with variable transit demand: Genetic algorithm approach. Journal of Transportation Engineering, 132(1): 40-51. [ Links ]
Garrett, A 2014. inspyred: A framework for creating bio-inspired computational intelligence algorithms in Python, Available at: https://www.aarongarrett.github.io/inspyred [ Links ]
Hagberg, A, Schult, D & Swart P 2008. Exploring network structure, dynamics, and function using NetworkX. Proceedings, 7th Python in Science Conferences (SciPy 2008), 19-24 August, Pasadena, CA, 11-16. [ Links ]
Kumar, R 2012. Jyotishree: Blending roulette wheel selection & rank selection in genetic algorithms, International Journal of Machine Learning and Computing, 2(4): 365-370. [ Links ]
Lee, Y 2006. Transit network sensitivity analysis, Journal of Public Transportation, 9(1): 21-52. [ Links ]
Michalewicz, Z 1996. Genetic Algorithms + Data Structures = Evolution Programs, 3rd ed. New York: Springer. [ Links ]
Poli, R, Langdon, W B, McPhee, N F & Koza, J R 2008. A Field Guide to Genetic Programming, London: Lulu Enterprises. [ Links ]
Python Software Foundation 2012. The Python programming language, Available at: https://www.python.org. [ Links ]
Schrijver, A 2003. Combinatorial Optimization: Polyhedra and Efficiency, Berlin/Heidelberg: Springer Science & Business Media. [ Links ]
Sheffi, Y 1985. Urban Transportation Networks: Equilibrium Analysis with Mathematical Programming Methods, Englewood Cliffs, NJ: Prentice-Hall. [ Links ]
Shih, M & Mahmassani, H S 1994. A design methodology for bus transit networks with coordinated operations, Report No. SWUTC/94/60016-1, Austin, TX, Center for Transportation Research. [ Links ]
Siriwardene, N & Perera, B 2006. Selection of genetic algorithm operators for urban drainage model parameter optimization, Mathematical and Computer Modelling, 44(5): 415-429. [ Links ]
Talbi, E 2009. Common concepts for metaheuristics, In: Talbi, E & Zomaya, A Y (Eds.). Metaheuristics: From design to implementation, 2nd ed. New York: Wiley. [ Links ]
 Correspondence:
Nnene OA
Centre for Transport Studies
Department of Civil Engineering
University of Cape Town
Private Bag X3
Rondebosch 7701
South Africa
T: +27 73 658 7656
E: nnnobi002@myuct.ac.za
Zuidgeest MHP
Centre for Transport Studies
Department of Civil Engineering
University of Cape Town
Private Bag X3
Rondebosch 7701
South Africa
T: +27 21 650 4756
E: mark.zuidgeest@uct.ac.za
Beukes EA
PO Box X9181
Cape Town 8001 South Africa
T: +27 21 400 1073
E: eddiebeukes@gmail.com

OBIORA A NNENE is a student member of the South African Institution of Civil Engineering (SAICE), and is presently completing his doctoral studies at the Centre for Transport Studies in the Civil Engineering Department at the University of Cape Town. He graduated with an MSc (Civil Engineering) from the University of Cape Town, and his research interest is in Transportation Engineering and Planning, with emphasis on public transportation network design and improvements. Prior to this he worked as a civil engineer in highway design and construction.

PROF MARKHP ZUIDGEEST is a member of the South African Institution of Civil Engineering (SAICE), and is currently Associate Professor of Transportation Planning and Engineering (SANRAL Chair) at the University of Cape Town. He graduated with an MSc (Civil Engineering) from the University of Twente, The Netherlands, in 1997, and a PhD from the Netherlands Research School for Transport, Infrastructure and Logistics (TRAIL) in 2005. His fields of interest include land use - transport systems analysis, with an emphasis on questions around sustainability, equity and accessibility.

DR EDWARD ABEUKES is an associate member of the South African Institution of Civil Engineering (SAICE), and is currently a principal professional officer at the City of Cape Town's Transportation and Urban Development Authority. He graduated with his MSc and PhD in Civil Engineering from the University of Cape Town in 2006 and 2011 respectively. His fields of interest include transport systems planning and modelling. He also has vast industry experience and, until his current position, he was a civil engineer with Ero Engineers for over seven years.

