


Services on Demand
Article
 English (pdf)
 Article in xml format
 Article references
Indicators

Related links
-
 Cited by Google
 -
 Similars in Google
Share

 Permalink
Journal of the South African Institution of Civil Engineering
On-line version ISSN 2309-8775
Print version ISSN 1021-2019
J. S. Afr. Inst. Civ. Eng. vol.59 n.4 Midrand Dec. 2017
http://dx.doi.org/10.17159/2309-8775/2017/v59n4a5
TECHNICAL PAPER
An investigation into the evidence of seasonal rainfall pattern shifts in the Western Cape, South Africa
J A du Plessis; B Schloms
ABSTRACT
Climate change is a highly contentious topic in the modern world. There is much evidence to indicate that climatic shifts and extreme weather anomalies are taking place globally, in some places more than others. This paper presents the findings on research to determine whether shifts in seasonal rainfall patterns are indeed already visible in historical rainfall data in the Western Cape of South Africa. The paper aims to provide some baseline information which can stimulate further research in this field.
Different analytical methods were formulated to investigate the relationships between daily rainfall indices over a set timescale. Data was collected from the South African Weather Service (SAWS) in order to accumulate 20 rainfall stations, each with at least 100 years of historical daily rainfall data. Statistical analysis, linear trend line distributions, time lag comparisons, cumulative distributions, moving average plots and autocorrelation relationships were applied to the data.
The results of the analysis indicated that (1) the rainfall season undergoes fluctuations of wetter and drier years (approximately 20-year cycles), (2) the South Coast region exhibits a shift towards a longer rainfall season, and in contrast the Mediterranean region is shifting to a shorter rainfall season when linear trend lines were analysed, and (3) the moving average plots showed only isolated seasonal shifts at the boundary months.
Keywords: rainfall pattern, shifts in seasonal rainfall, climate change
INTRODUCTION
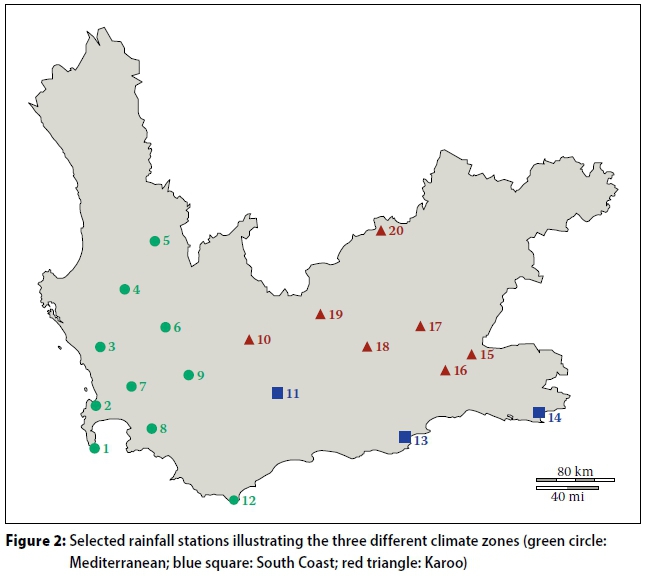
South Africa is classified as a predominantly semi-arid country. However, due to its variable topography, its climate varies from desert and semi-desert in the dry northwestern region to sub-humid and wet along the eastern coastal area (Benhin 2006). The Western Cape Province is located at the southwestern tip of South Africa and is bordered by the Northern Cape to the north, the Eastern Cape to the east and the Indian and Atlantic Oceans to the south and west respectively. The Western Cape covers an area of 129 370 km2 (Winter et al 2001) and experiences a range of climatic and topographic heterogeneity. The region is dominated by the Cape Fold Belt which extends along the length of the province, forming on L-shaped mountain range. Van Niekerk and Joubert (2011) identified three climatic zones induced by the Cape Fold Belt, namely the Mediterranean, South Coast and Karoo regions (Figure 1).
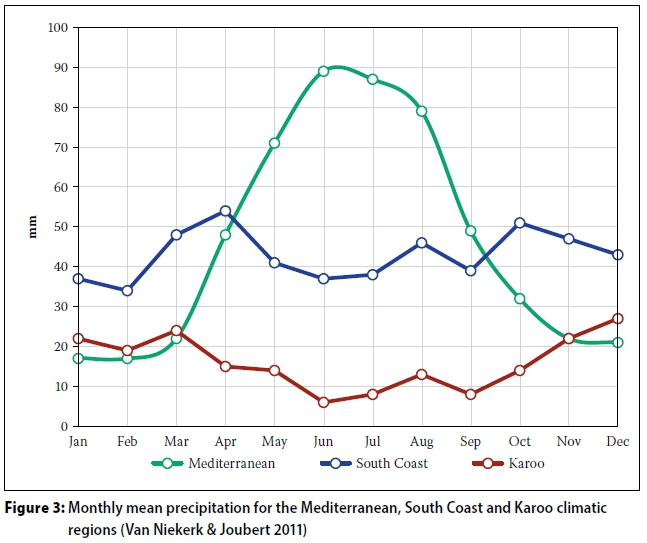
The Mediterranean region, which encompasses the southwestern and west coast part of the province, typically receives winter rainfall (May to August) from cyclones originating over the South Atlantic. The leading stimulus for winter rainfall in this region is the combination of the cold Benguela current and the northward displacement of high-pressure systems. In contrast, the climate of the South Coast region, which stretches eastward from Cape Agulhas, is influenced by the movement of warm, moist air from the Indian Ocean, producing all-year rainfall. The effect of the Indian Ocean does not extend further than the Cape Fold Belt which forms a natural divide between the South Coast and Karoo climate regions. The Karoo region is therefore limited to the inland plateau of South Africa. It also receives all-year rainfall, with a summer maximum in the form of thundershowers (Van Niekerk & Joubert 2011).
The main objectives of this research are to investigate rainfall patterns in the Western Cape Province, and to determine whether any shifts in seasonal rainfall patterns are evident in historical rainfall records. A number of previous studies examined the long-term changes in rainfall in South Africa. Acosta et al (1999) predicted a loss of up to 25% of the Western Cape's then current (1999) winter rainfall. Lynch et al (2001) observed a gradual increase in annual rainfall in the Potchefstroom area from 1925 to 1998. In contrast, Van Wageningen and Du Plessis (2007) observed a yearly decrease, specifically after 1998, in the number of rainfall events, and a logical increase in rainfall intensity at the foot of Table Mountain in Cape Town. Du Toit and O'Connor (2014) mirror a significant increase in rainfall intensity since 1988 in the eastern Karoo. At a national level, Lumsden et al (2009) noted an increase in the number of rainfall days and rainfall intensities in the eastern half of South Africa where, by contrast, the west coast and adjacent interior showed a decrease.
According to the Western Cape Department of Agriculture, Economic Development and Tourism (2014), more than 50% of South Africa's agricultural exports is produced by the Western Cape, and it supplies about 20% of the national agricultural production. The Mediterranean climate of the Western Cape specifically yields a very productive wine industry in the Cape Wineland area. Much of the produce is exported all over the world, while, at the same time, it also stimulates tourism in the area. The remainder of the area is acknowledged for its trade in animal products, some of which include sheep (meat and wool), chickens (eggs), cows (dairy), beef and pork (meat). The coastline is also abundant in a large variety of marine life which fuels a highly profitable fishing sector. Much of the Western Cape relies on its tourism and agricultural industry for economic enrichment, and it is therefore clear that any shift in seasonal rainfall patterns, which might influence agricultural production, is of great importance to the Western Cape.
RAINFALL MECHANISMS
Ocean currents flowing past landmasses have a major influence on their climate and environment, specifically the coastal regions which are directly affected. It is evident that the precarious position of the Western Cape Province, relative to the warm Indian Ocean and the cold Atlantic Ocean, creates a hub for diverse oceanic and atmospheric circulation systems which influence the climate, and more specifically the rainfall, of the province (Chase & Thomas 2007).
In the winter months, the South Atlantic high-pressure system shifts northward, which carries cold fronts to the west coast. The combination of these cold fronts and the persistent winds over the cold Benguela region introduces rain to the Mediterranean Region, specifically along the west coast (Chase & Thomas 2007). Cut-off low pressure systems are a common weather occurrence in South Africa, bringing rain to certain parts of the country, typically from March to May, and September to November. Cut-off low pressure systems are exactly what their name suggests. It is described as airflow over South Africa, in the mid-levels of the atmosphere, usually flowing from west to east. Heavy rains are the result of this airflow being disturbed, forming a trough which intensifies and develops into a low-pressure system. The low-pressure system gets "cut off" from the westerly flow and causes heavy rains in the western and southern parts of the country (Singleton & Reason 2007). The Cape Fold Belt triggers an orographic effect along the South Coast Region, initiating all-year rainfall. The Karoo Region similarly also receives all-year rainfall, with a summer maximum. Reason and Rouault (2005), and Philippon et al (2011) conclude that the Antarctic Oscillation (AAO) and El Niño Southern Oscillation (ENSO) are considered as teleconnections (climate anomalies being related to each other over large distances) which may respectively contribute to rainfall over the South Western Cape, during different times of the year.
CLIMATE CHANGE
According to the Intergovernmental Panel on Climate Change (IPCC) (IPCC 2001), climate change is considered to be the change in climate over a period of time. It can be the result of natural variability or can be attributed directly or indirectly to human activity. Those variables alter the structure of the earth's atmosphere. However, climate change is not just a shift in a single climatic condition, such as temperature, but a shift in many interlinked climate variables, such as temperature, rainfall, humidity, frost, chill units and atmospheric carbon dioxide to name only a few.
The concept of greenhouse gas emissions and their contribution to climate change is a well exhausted debate amongst politicians, scientists and the eco-friendly community. What many do not realise is that the greenhouse effect occurs naturally. Radiation from the sun is absorbed mainly through the surface of the earth. Atmospheric and oceanic circulations redistribute this energy, which is then radiated back into space. The IPCC (2001) states that whenever this cycle is influenced in any way (e.g. a change in the retention or release of radiation from the earth, or a change in the redistribution of energy across land, ocean, or through the atmosphere), the climate will be affected.
According to the Synthesis Report of the Fifth Assessment Report of the IPCC (2014), the temperature at the Earth's surface has become progressively warmer per decade since 1850. Due to a rapidly growing economy and population, a definite increase in the anthropogenic greenhouse gas emissions has been evident since the pre-industrial era. Predictions of global precipitation changes on a regional and seasonal scale are uncertain; however, studies have found that extreme weather anomalies are likely to change.
With clear suggestions of possible changes in the climatic conditions due to various reasons, the purpose of this research is to investigate, based on statistical analysis, whether significant shifts can be observed in the seasonal rainfall patterns within the Western Cape Province. No attempt is made to link a definite cause to a possible shift, but rather to identify a broad appreciation of whether shifts in rainfall patters do occur in the Western Cape, and to propose further research which may provide a better understanding thereof.
METHODOLOGY
Acquired data
Data was originally sourced from both the Agricultural Research Council Institute for Soil, Climate and Water (ARC-ISCW) and the South African Weather Service (SAWS) to ensure data from at least two independent sources to allow for a greater selection of rainfall stations. However, data from the ARC-ISCW did not provide data sets that were long enough, hence these were omitted. Daily rainfall data was sourced as the ideal median between monthly rainfall data, which could have concealed possible small trends, and hourly rainfall data, which is not available for a significant length of time, as well as being too specific.
Kruger (2006) emphasises that quality control is more difficult to manage with rainfall data, compared to other climatic factors such as temperature, partially due to rainfall having relatively poor spatial correlation. In other words, the Western Cape's diverse topography and relatively sparse distribution of rainfall stations make it difficult to find a significant correlation between rainfall stations. Thunderstorms also occur sporadically and over small, localised areas, which could influence the correlation between rainfall stations. However, in this research it is argued that the use of monthly rainfall over a 100-year period will overcome the possible impact of isolated, localised thunderstorms on the correlation, and therefore the completeness of rainfall data sets. Thunderstorms typically occur on a single day for a few hours at most, making up less than 1% of the data in the data set. Therefore, if thunderstorms are a regular occurrence, it would be included in the year to year monthly rainfall data.
Rainfall data, for the most part, was accepted as being correct, relying on the SAWS for their respective quality control measures to ensure the accuracy of the data.
The final selection of rainfall stations used for this research depended on:
1. The length of rainfall data set (> 100 years)
2. The authenticity of the data, i.e. data sets with little or no missing data
3. The regional distribution of the rainfall stations, in other words, an even and representative distribution (geographical position within the Western Cape) of the stations meeting the requirements of (1) and (2) above.
Rainfall station selection
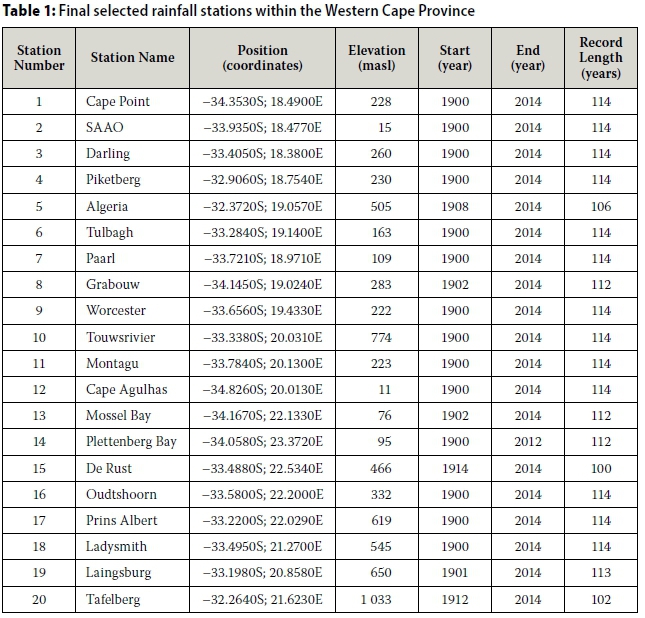
The record length for each station was evaluated first. Rainfall stations with record lengths longer than 100 years were considered, based on the extent of missing data within the data set. Data sets exhibiting little or no missing data (less than 10% of the total data within the data set) were accepted for possible inclusion in the analysis. This process yielded approximately 30 rainfall stations. These stations were plotted spatially and the final selection of rainfall stations (20) was based on their record length and their geographical distribution within the Western Cape. The final stations, selected according to the aforementioned conditions, are presented in Table 1.
The distribution of the rainfall stations is presented in Figure 2, where it is illustrated that they adequately represent the three different climatic regions in the Western Cape.
The typical mean precipitation distribution for the Mediterranean, South Coast and Karoo climatic regions is illustrated in Figure 3.
Using the results according to Van Niekerk and Joubert (2011), presented in Figure 3, each rainfall station was categorised based on the following criteria which define the rainfall season:
O Mediterranean Region - May (April) to August (September)
O South Coast Region - All-year rainfall
O Karoo Region - November to March.
ANALYSIS AND RESULTS
To investigate the research question regarding the presence of any possible changes in the rainfall patterns in the Western Cape, four main analyses were conducted:
1. A statistical analysis of key parameters, using trend lines
2. A time lag analysis to compare changes in some statistical parameters for different data sets
3. A cumulative plot analysis
4. A moving average analysis.
These analyses will be discussed briefly and the results presented in the section to follow, wherein conclusions will be drawn from the results presented.
Statistical analysis
Various statistical parameters were used to evaluate daily rainfall data on a monthly basis. These parameters include total, maximum and minimum, average and percentile monthly rainfall. In this research, daily data was obtained and used to calculate average daily rainfall and the total monthly rainfall. Thereafter, the maximum and minimum daily rainfall values were identified for each month and were recorded as the month's daily minima and maxima. The 25th and 85th percentiles of the monthly rainfall data were included in the analysis to observe trends in daily rainfall data between the minimum, average and maximum daily rainfall values.
Linear trend analysis
To determine whether a relationship exists between values in a data set, a trend line was fitted to the data. For the purpose of this research, a linear trend line would be most beneficial as it would show either an increasing or decreasing trend. The inclination of the trend line is identified by the gradient of the straight line (linear) equation. To identify a possible shift in the seasonal rainfall from one year to the next, the statistical parameters were plotted as a function of time in years for a specific month. This provides an indication of the monthly trend from year to year. A positive or negative gradient indicates an increase or decrease, respectively, in monthly rainfall. The strength of the relationship (trend) is reflected in the regression coefficient. The regression coefficient is a value which varies between 0 and 1. A value of 1 indicates a perfect fit, while 0 represents no statistical correlation. The total monthly rainfall, maximum daily rainfall, 85th percentile monthly rainfall and average daily rainfall were plotted for a specific month from year 1900 to year 2014.
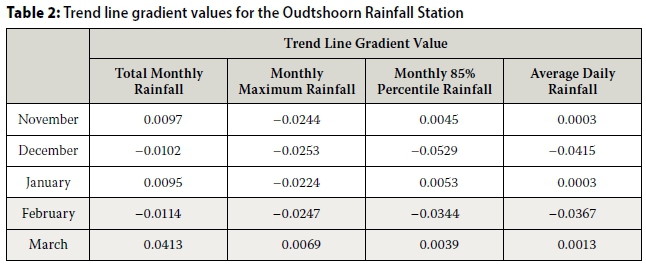
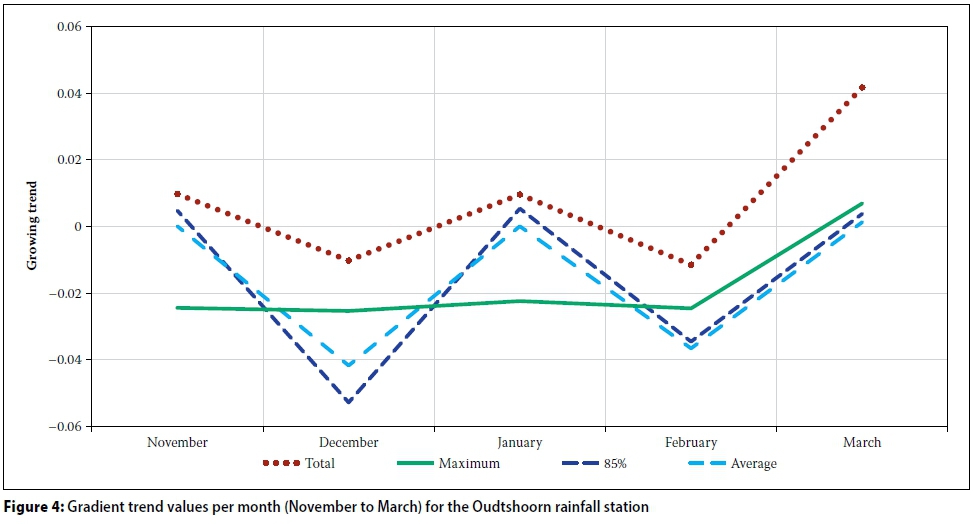
Linear trend lines were then fitted to the different data sets for each of the four statistical parameters and the gradient value was recorded. The gradient of the trend line was then plotted for each month under evaluation. The results of the analysis for the Oudtshoorn station (Station 16 in Table 1) are shown in Table 2 and are presented graphically in Figure 4.
Table 2 (with specific reference to the months of February and March) and Figure 4 can be used, for example, to conclude that the total, maximum, 85% and average monthly rainfall trend for February decreases (shown by negative gradient values), and the trend for the corresponding rainfall statistics for March increases (shown by positive gradient values) over the full record length (1900 to 2014). It can be concluded that in this specific case, based on all four statistical parameters, the rainfall pattern is possibly shifting, indicating a later end of the rainfall season.
The results of the linear trend analysis indicated that the linear regression coefficients were very low (no value greater than 0.2), which demonstrates that the statistical significance, in terms of a linear model, of the changing trend of the rainfall data for all the stations included in this research is very poor. Nonetheless, opposing gradient values at the boundary months (i.e. boundary of the peak rainfall period for the specific climatic zone), which were present in two or more of the calculated statistical parameters, were identified and recorded.
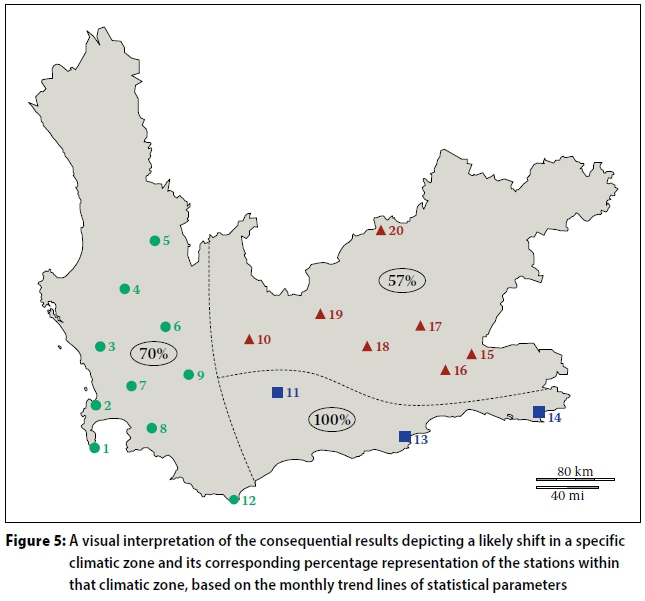
When the stations were grouped into their respective climatic zones, specific trends were evident. These include:
■ 100% of the stations in the South Coast Region showed a decrease in at least two statistical parameters of the rainfall data in March, and an increase in April -pointing towards the possibility of a later end to the rainfall season in this zone.
■ 70% of the stations in the Mediterranean Region showed an increase in at least two statistical parameters of the rainfall data in August, and a decrease in September - pointing towards the possibility of an earlier end to the rainfall season in this zone.
■ 57% of the stations in the Karoo Region showed an increase in at least two statistical parameters of the rainfall data in November, and a decrease in December -pointing towards the possibility of an earlier start to the rainfall season in this zone.
These results are illustrated in Figure 5.
Time lag comparison
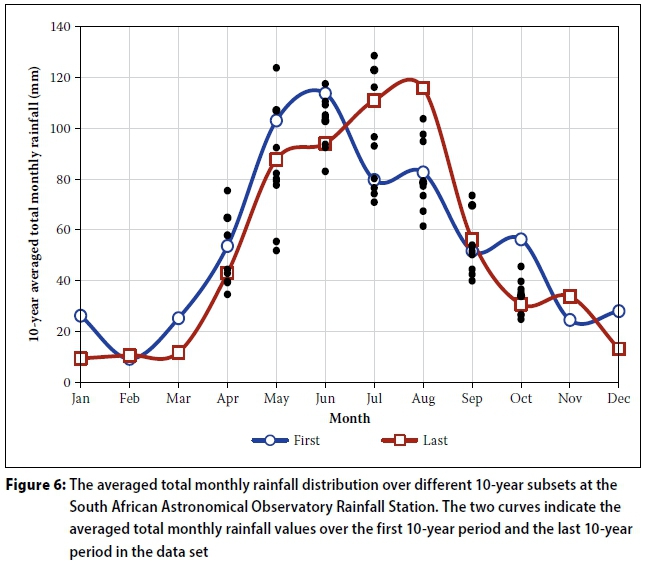
The time lag plot is the name given to the comparison of two data sets, in this case the comparison of two 10-year averaged total monthly rainfall data sets. It is a simple way to visualise a possible "shift" in a data set over time, and may provide an indication of the trend which is likely to occur.
In an attempt to determine the presence of a possible shift in rainfall patterns, this method is beneficial in comparing, as a first step, the averaged total monthly rainfall over the first 10 years of the time series with that of the last 10 years. This comparison was then followed by a second step where a comparison of sequential 10-year subsets within the two boundaries, i.e. total monthly rainfall over a 10-year period and lagged by 10 years, was done. The results can indicate whether the initial assumption of comparing the boundary cases in step 1 was indeed valid or not. It will be supported if most of the averaged total monthly rainfall values over the sequential 10-year subsets fall between the two boundary comparisons, and unsupported if they do not. The time lag approach was important to compare the main rainfall seasons and to determine whether the rainfall in these periods had shifted backwards (later rain), forwards (earlier rain) or remained constant. It also aided in confirming what could be established as the "rainfall season" and whether a change had occurred along the boundary months. In Figure 6, the solid lines represent the averaged total monthly rainfall over the first 10-year period and last 10-year period of a specific station's data set. The singular points represent the averaged total monthly rainfall values over the lagged 10-year subsets between the first and last 10-year periods. For this research, focus is not placed on which 10-year period the black dot represents, but rather whether it lies within the boundary of the first and last 10 years of the data set. In this case it is evident that most of the subset values do not.
If the shift, shown by the different averaged total monthly rainfall values as observed in Figure 6, is a true reflection of the trend, all the 10-year subset values are expected to distribute themselves between the two solid lines, which would confirm a gradual shift in the rainfall season (peak rainfall month shifting from June to August). However, this is not the case with the 10-year time-step average rainfall values presented in Figure 6, with the data points being seemingly scattered at random.
It is, however, interesting to note the relationships between stations in the same area. It was found that in the areas depicted in Figure 7, the stations showed similar shifts from the first 10 years to the last 10 years. The encircled stations in the Mediterranean Region indicate a foreward shift (later start of the rainfall season) in average total monthly rainfall from June to August. The included stations in the Karoo Region show a forward shift from March to June (later start of the rainfall season) and the South Coast Region indicates a backward shift from October to August (earlier decrease in rainfall at end of season).
No similarities or patterns could be identified between the stations which have not been grouped as shown by Figure 7. They therefore did not conform to the shifts indicated above, but exhibited patterns unique to their position within the Western Cape Province.
Cumulative plot
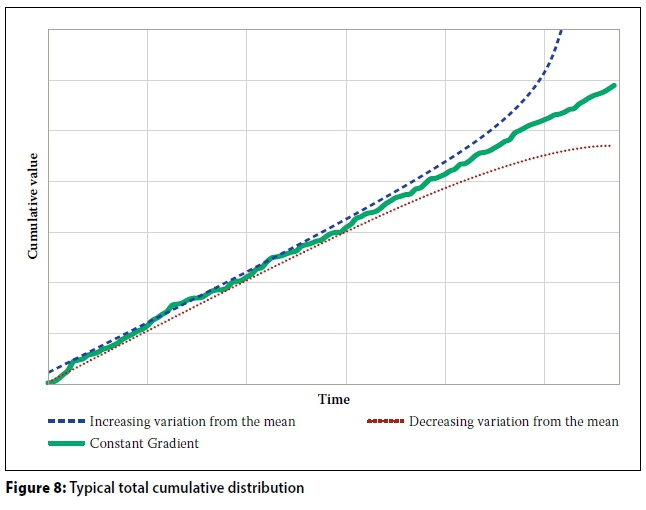
Cumulative, by definition, means "increasing or decreasing by successive addition" (Concise Oxford English Dictionary 1964). For data without any changes, a perfect cumulative distribution would maintain a constant gradient, and any deviation from the general trend would indicate either an increase or decrease of the data as a function of time. The cumulative distribution draws attention to consistent variations from the mean and is therefore a valuable tool for observing possible changes within a data set. The cumulative distribution function Tnis given by Equation 1 and could be effective in the analysis of rainfall data when plotted as a function of time.
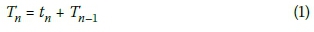
where tnis the total rainfall in a specific year and Tn-1is the cumulative total rainfall of all the previous years. When the cumulative values are plotted as a function of time, the general trend relationship is illustrated as in Figure 8.
Figure 8 illustrates three possible outcomes that can result from a cumulative plot. When the research problem is considered, a constant gradient would indicate no significant shift in the rainfall pattern, while increasing variation would indicate that rainfall is increasing with time and decreasing variation would indicate that rainfall is decreasing over time. A shift would be demonstrated by a point where two consecutive months show consistent opposite trends (i.e. one month shows a decreasing variation and the next shows an increasing variation).
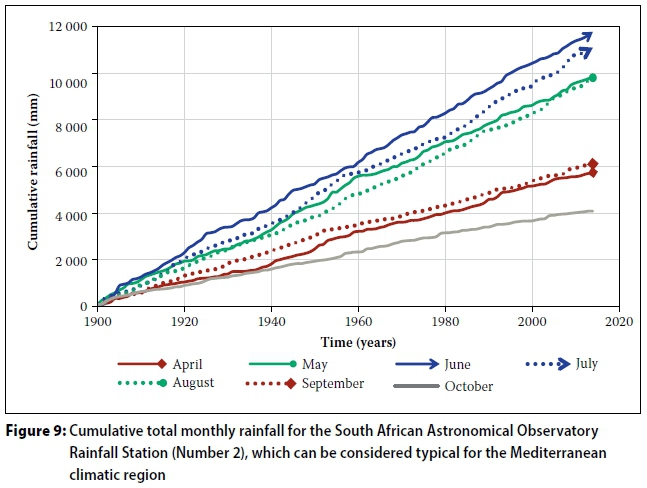
When the cumulative total monthly rainfall values are plotted against time, the general trend for the 20 rainfall stations shows that no major change in rainfall can be identified based on a year to year observation, illustrated by a mostly consistent gradient. This relationship is depicted for the South African Astronomical Observatory rainfall station (Station 2 in Table 1) in Figure 9, which can be considered typical for the Mediterranean climatic region.
In general, small fluctuations from the cumulative trend were observed, but for the most part the gradient of the cumulative trend remained the same. If the assumption that a change in the rainfall patterns of the Western Cape is valid, a deviation from the general trend would have to be observed in some of the months.
Figures 10(a) and (b) illustrate what is meant by a small fluctuation from the general cumulative trend for the same rainfall station shown in Figure 9. These trends usually appear as single (approximately 20-year) or double (approximately 40-year) cycles.
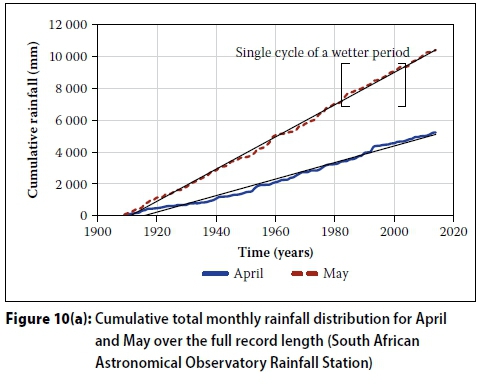
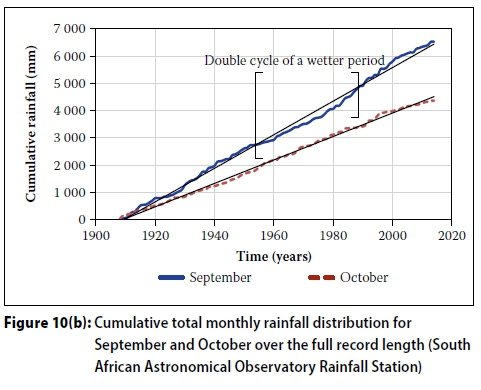
The general trend, when all rainfall stations were considered, did not indicate any continuous increasing or decreasing shifts from the mean. It does, however, illustrate small fluctuations from the mean (as illustrated in Figure 10) which are indicative of rainfall variability.
Moving average
A moving average is a method which analyses a series of data points by determining the averages of different subsets (Business Dictionary 2016). The simple moving average method adjusts fluctuations of consecutive values in a data set which identifies the direction of a specific trend. It could be extremely beneficial when applied to rainfall data to compare the general trend of consecutive subsets. In this research, consecutive months were analysed where opposite trends (i.e. one increases while the other decreases) could indicate a possible shift in rainfall patterns.
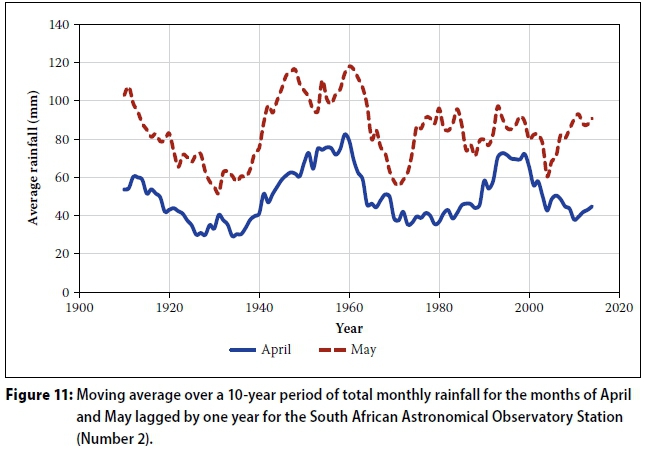
In this analysis, subsets of 10 years were used with a one-year time lag interval and the average total monthly rainfall calculated for each subset. This approach was implemented for each month, and the moving averages that had been calculated were plotted over the full record length. Figure 11 demonstrates this technique for the months of April and May for Station 2, the South African Astronomical Observatory, in the Mediterranean Region as an example.
Figure 11 indicates that there is a continuous escalation of the mean, between 1940 and 1960, which would suggest an increase in the total monthly rainfall experienced from year to year for a specific month (April and May in this case). Conversely, a continuous decline of the mean, as indicated between 1910 and 1930, would suggest a decrease in the total monthly rainfall experienced from year to year for a specific month. Figure 11 can also indicate that the general increasing and decreasing trends of the two illustrated months correlate with each other and show periods of wetter or drier years. Similar fluctuations indicating slightly wetter or drier periods, as seen previously with the cumulative plot, appear in the moving average approach. These cycles seem to have a lifespan of single (20-year) and double (40-year) periods. At points where these increasing or decreasing trends diverge for consecutive months, it would indicate possible shifts in the rainfall pattern.
When the moving average plots for all the stations were analysed, the border months received special attention. It proved difficult to identify significant shifts or points of change within the data sets. When the stations were grouped into their respective climatic regions, specific trends were evident, which include:
■ 100% of the stations in the South Coast Region showed an increasing October and decreasing November trend from approximately 1980 to 1995, pointing towards the possibility of an earlier start to the rainfall season in this region over this period.
■ 80% of the stations in the Mediterranean Region showed an increasing September and decreasing October trend between 1970 and 2000 which expresses the possibility of an earlier end to the rainfall season in this region during this period.
■ The Karoo Region showed no significant trend.
CONCLUSION
Climate change is one of the most debated topics of the modern world. The United Nations Conference on Environment and Development (UNCED), informally known as the Earth Summit, meets every year to discuss the impacts of climate change and how to slow this process. There are many factors indicating that climate change is indeed taking place. However, whether climate change has had an effect on the Western Cape seasonal rainfall patterns during the past 100 years is inconclusive.
Three features are evident from the research provided in this paper: 1. A pattern that seems to be evident in all the different analyses is that there are periods of wetter and drier years within the rainfall season. This relationship oscillates in periods of approximately 20 years.
2. The gradient of the trend plot (linear trend plot) brought to light some interesting points in all three climatic regions. The rainfall season is possibly shortening in the Mediterranean Region and comparatively lengthening in the South Coast and Karoo Regions. Although it was proved that the statistical significance of this data was very poor, this statement does, however, correspond with the conclusions made by Lumsden et al (2009), i.e. that the western half of the province (Mediterranean Region) will experience warmer but drier weather, and the eastern half (South Coast and Karoo Regions) will comparatively experience warmer but wetter weather.
3. It was found that the moving average plots indicated isolated occurrences of variation in rainfall patterns in the Mediterranean and South Coast Regions. A longer data set would need to be analysed to determine if these occurrences are repeated over a few decades.
Although no significant single trend was found across the Western Cape, the features that have been brought to light show interesting changes that have occurred in the past century. It is clear that further research needs to be done to gain a better understanding of the possible changing rainfall trends in the Western Cape Province. This could include doing more localised analysis within the three climatic regions, or analysing the different regional rainfall patterns and not specific rainfall stations within the regions. An analysis of the annual rainfall pattern, as apposed to only analysing the perceived main rainfall season, might also provide a better understanding of the possible changes suggested by climate change theory. In conclusion, South Africa needs to accumulate a more extensive database of climate data in order to perform more detailed analyses. Research as presented in this paper provides baseline research, which can be used as a reference for future research.
REFERENCES
Acosta, R, Myles, A, Cherian, A, Granich, S, Mintzer, I, Suares, A & Von Hippel, D 1999. Climate change information kit. United Nations Environment Programme (UNEP) and the United Nations Framework Convention on Climate Change (UNFCCC). Available at: http://www.unfccc.int/cop3/fccc/climate/factcont.htm (accessed in February 2016). [ Links ]
Benhin, J K A 2006. Climate change and South African agriculture. Discussion Paper 21. Centre for Environmental Economics and Policy in Africa (CEEPA), University of Pretoria. Available at: https://www.researchgate.net/publication/265074602 [ Links ]
Business Dictionary.com. n.d. Moving average. http://www.businessdictionary.com/definition/moving-average.html [ Links ]
Chase, B M & Thomas, D S 2007. Multiphase late Quaternary aeolian sediment accumulation in western South Africa: Timing and relationship to palaeoclimatic changes inferred from the marine record. Quaternary International, 166(1): 29-41. [ Links ]
Concise Oxford English Dictionary, 5th ed. 1964. London: Oxford University Press. [ Links ]
Du Toit, J C O & O'Connor, T G 2014. Changes in rainfall pattern in the eastern Karoo, South Africa, over the past 123 years. Water SA, 40(3): 453-460. [ Links ]
IPCC 2001. Climate change 2001: The scientific basis. Contribution of Working Group I to the Third Assessment Report of the Intergovernmental Panel on Climate Change (IPCC). Houghton, J T., Ding, Y, Griggs, D J, Noguer, M, Van der Linden, P J, Dai, X, Maskell, K & Johnson, C A (Eds.). Cambridge, UK: Cambridge University Press. [ Links ]
IPCC 2014. Climate change 2014: Synthesis report. Contribution of Working Groups I, II and III to the Fifth Assessment Report of the Intergovernmental Panel on Climate Change (IPCC). Pachauri, R K & Meyer, L A (Eds.). Geneva, Switzerland: IPCC. [ Links ]
Kruger, A 2006. Observed trends in daily precipitation indices in South Africa: 1910-2004. International Journal of Climatology, 26(15): 2275-2285. [ Links ]
Lumsden, T G, Schulze, R E & Hewitson, B C 2009. Evaluation of potential changes in hydrologically relevant statistics of rainfall in Southern Africa under conditions of climate change. Water SA, 35(5): 649-656. [ Links ]
Lynch, S D, Zulu, J T, King, K N & Knoesen, D M 2001. The analysis of 74 years of rainfall recorded by the Irwins on two farms south of Potchefstroom. Water SA, 27(4): 559-564. [ Links ]
Philippon, N, Rouault, M, Richard, Y & Favre, A 2011. The influence of ENSO [El Nino Southern Oscillation] on winter rainfall in South Africa. International Journal of Climatology, 32(15): 2333-2347. [ Links ]
Reason, C J C & Rouault, M 2005. Links between the Antarctic Oscillation and winter rainfall over western South Africa. Geophysical Research Letters, 32(7). doi: 10.1029/2005GL022419. [ Links ]
Singleton, A T & Reason, C J C 2007. Variability in the characteristics of cut-off low pressure systems over subtropical southern Africa. International Journal of Climatology, 27: 295-310. [ Links ]
Western Cape Department of Economic Development and Tourism. 2014. Annual Report 2013-2014. Cape Town: Government Printing Works. [ Links ]
Van Niekerk, A & Joubert, S J 2011. Input variable selection for interpreting high-resolution climate surfaces for the Western Cape. Water SA, 37(3): 271-279. [ Links ]
Van Wageningen, A & Du Plessis, J A 2007. Are rainfall intensities changing, could climate change be blamed and what could be the impact for hydrologists? Water SA, 33(4): 571-574. [ Links ]
Winter, K, Bottaro, J & Oelofse, C 2001. Oxford intermediate atlas of Southern Africa. Cape Town: Oxford University Press. [ Links ]
 Correspondence:
J A du Plessis
Department of Civil Engineering
Stellenbosch University
Private Bag X1
Matieland 7602
South Africa
T: +27 21 808 4358
E: jadup@sun.ac.za
B Schloms
Department of Civil Engineering
Stellenbosch University
Private Bag X1
Matieland 7602
South Africa
T: +27 (0) 82 306 9279
E: bianca.schloms@gmail.com

PROF JA DU PLESSIS (Pr Eng) is Head of the Department of Civil Engineering in the Engineering Faculty of Stellenbosch University, where he has also been responsible for Hydrology for the past 15 years. He obtained his PhD (Water Governance), MEng (Water Resource Management) and BEng (Civil) from the University of Stellenbosch. He has more than 30 years' experience in the water sector. Prof Du Plessis is a member of the South African Institution of Civil Engineering (SAICE) and serves on their Education and Training Panel. He is also a Fellow of IMESA (Institute of Municipal Engineering of Southern Africa) and serves on both their Council and their Executive Committee.

BIANCA SCHLOMS (BEng Civil), who is a member of SAICE, is a roads engineer for the Western Cape Department of Transport and Public Works, where she has been working since the completion of her engineering degree at Stellenbosch University in 2014, and where she is enrolled in a graduate programme that prepares her for registration as a professional engineer.

