


Services on Demand
Article
 English (pdf)
 Article in xml format
 Article references
Indicators

Related links
-
 Cited by Google
 -
 Similars in Google
Share

 Permalink
Journal of the South African Institution of Civil Engineering
On-line version ISSN 2309-8775
Print version ISSN 1021-2019
J. S. Afr. Inst. Civ. Eng. vol.59 n.4 Midrand Dec. 2017
http://dx.doi.org/10.17159/2309-8775/2017/v59n4a2
TECHNICAL PAPER
Development of an updated fundamental basic wind speed map for SANS 10160-3
A C Kruger; J V Retief; A M Goliger
ABSTRACT
This paper evaluates the need for updating the strong wind climate stipulations of South Africa for the design of structures in accordance with SANS 10160-3:2010, as based on the latest information presented by Kruger et al (2013a; 2013b). The primary objective is to provide the geographic distribution of the characteristic gust wind speed by means of the fundamental value of the basic wind speed, stipulated as vb,0in SANS 10160-3. A reassessment of previously published information is made to incorporate additional wind speed modelling results and to investigate identified anomalies. The format of presentation, based on local municipal districts, is subsequently motivated, assessed and implemented. In order to provide for situations requiring the consideration of the dynamic effects of wind loading, similar information on characteristic hourly mean wind speed is provided. It is concluded that the presentation of wind speed on a district basis provides an effective balance between the spatial resolution of the available information and its use in operational standardised design.
Keywords: basic wind speed, wind loading code, mapping, strong wind climate, South Africa, extreme wind statistics
INTRODUCTION
Stipulation of the geographical distribution of the free field wind speed across South Africa provides a direct link to the strong wind climate of the country and the design wind loads on structures. The nominal treatment of the map of the fundamental value of the basic wind speed vb,0was identified as one of the major deficiencies of the South African National Standard SANS 10160:2010 Basis of structural design and actions for buildings and industrial structures Part 3 Wind Actions (Goliger et al 2009). The publication of SANS 10160-3:2010 (reissued in 2011 with corrections) was therefore followed up with extensive investigations into the strong wind climate of South Africa and the statistical treatment of strong wind observations to derive extreme value probability models, and the compilation of representative free field wind speed maps (Kruger 2011; Kruger et al 2013a; 2013b).
Prior to the latest revisions of extreme wind statistics, a comprehensive strong wind analysis for the purpose of the South African loading standard was conducted in 1985 (Milford 1985a; 1985b). Considering that wind loading represents the dominant environmental action in South Africa to be considered in the design of structures, an accurate estimation of strong winds is of cardinal importance to the built environment, and should be updated as new information becomes available. A review of the historical development of climatic data for wind load design in South Africa is provided by Goliger et al (2017).
The updated maps and statistics not only take into account the historical increase in the availability of extreme wind data in South Africa (presently at least seven-fold), but also considers a range of the most widely applied statistical procedures utilised internationally in the estimation of extreme wind statistics. The choice of appropriate statistical methods depends largely on the length and quality of data records, the exposures of associated measuring instruments, the mixed strong wind climate of South Africa, as well as the averaging time scales. For example, there are fundamental differences between the methods suitable for the estimation of extreme hourly average wind speeds, which have high volumes of temporally interdependent strong wind values in their associated data sets, and gust speeds, which have lower interdependence.
This paper presents the background to the reassessment and application of the strong wind information in a format that is suitable for implementation in standardised structural design and thereby for incorporation into an update of SANS 10160-3. The stipulation of the basic wind speed provides the starting point for the process. The representation of vb,0as the gust wind speed constitutes the only rational way to resolve the differences between synoptic, convective thunderstorm and mixed climate strong wind. This implies that the introduction of vb,0as the 10-minute mean wind speed, in order to be consistent with the reference Eurocode standard EN 1991-1-4:2005, ought to be reversed to the practice followed in SABS 0160:1989. The stipulation of vb,0 as the 1:50 year or 0.02 fractile of the annual extreme gust wind speed forms part of the reliability representation of strong wind occurrences. Although structural dynamic effects are beyond the scope of SANS 10160-3, mapping of the hourly mean characteristic wind speed is readily available from the background research, and is therefore included here as additional information on the South African strong wind climate.
An initial update of vb,0is presented by Kruger et al (2013b). The resultant map of vk, the 1:50 year gust wind speed derived from automatic weather station data of the South African Weather Service (SAWS), is considered here as the basis of the update of statistics for vb,0. However, reassessment is needed to review some anomalies that can be identified from the published maps in terms of apparent outliers. Additional metadata on the influence of terrain conditions on strong wind measurements are taken into account. Complementary information on strong wind occurrences, based on reanalysis of synoptic information during wind storms, provides extensions of the probability models based on annual extreme value observations. Reanalyses of the results are particularly useful for spatial interpolation of values and consideration of complex topography.
For implementation as a design wind map, a suitable format is needed to fully exploit the geographic resolution of strong wind information, whilst the stipulated wind speed is presented in an unambiguous normative manner for use in operational design. The selection of the areas corresponding to local municipal districts, as the units for the geographical description of vb,0, is motivated and assessed. Alternative schemes are considered for selecting wind speed intervals to represent the continuum of values. Various constraints affecting the resolution of the format for the stipulation of vb,0are taken into account.
The main steps in compiling the map of the fundamental values of the basic wind speed can be summarised as:
i. the optimal selection of wind speed intervals,
ii. deriving optimal values to local municipalities with measurements, and
iii. assigning values to the remaining municipalities through interpolation.
Subsequently, the consistency of values is checked between contiguous areas, specifically the metropolitan regions, but also for smaller areas where high values were obtained. From the above it follows that an iterative process is necessary, with due consideration of the original measurements, to converge to a map that is consistent with the overall resolution of information and operational requirements.
The main features of the resulting map are summarised in conclusion, considering the advancement achieved compared to the present map. The potential for future updating is assessed, as based on extension of the dataset for both the present automatic weather station (AWS) records to improve the time variant probability models, and the inclusion of additional AWS data to extend the spatial resolution.
REASSESSMENT OF UPDATED STRONG WIND STATISTICS
Main features of revised maps for characteristic wind speed
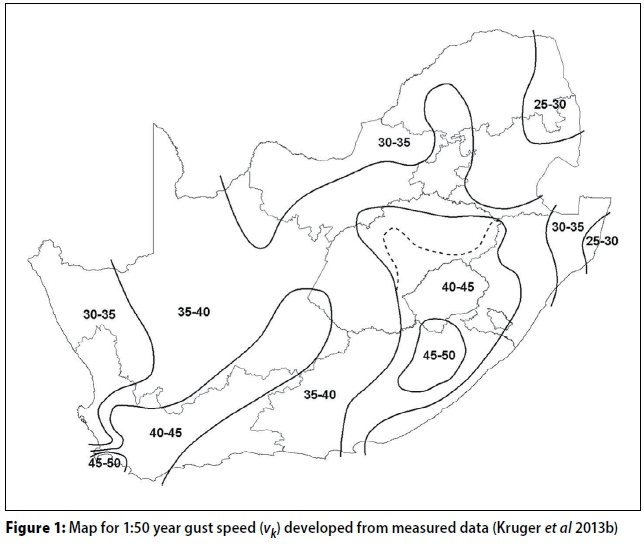
The primary output of the updated statistical analysis and mapping of the South African strong wind climate is a map of the characteristic gust wind speed (vk) shown in Figure 1 (Kruger et al 2013a; 2013b). Quality control measures and extreme value analysis to derive input values for this map are discussed in these references. As vkis derived from the instantaneous wind speed measured from automatic weather stations (equipped with an RM Young propeller sensor), the time-resolution of the wind speed value obtained is 1 s, instead of the 2-3 s which is the conventional gust standard. Shorter duration gusts than the standard 3 s are more appropriate for structural design (Holmes & Ginger 2012; Holmes et al 2014). Differences in the response of the AWS and the structure are not accounted for in the map for vb,0on the assumption that it is included in the uncertainties provided for by the procedures for determining the wind load.
The main feature of this map, compared to the current map of the basic wind speed (vb,0) given in SANS 10160-3:2010, is its increased complexity due to the improved resolution resulting from a spatially denser network of observations and consideration of the mixed strong wind climate. Values of vkrange from 45-50 m/s in the southwest extreme to 25-30 m/s in the northeastern regions; on a localised scale a range of 30-50 m/s is obtained within the Cape Town metropolitan district. Significant spatial features can be observed at intermediate scales, particularly for wind speeds above 40 m/s.
A critical assessment of Figure 1 in comparison to the underlying wind speed data indicates the smoothing effect of the interpolation needed to represent vkas wind speed intervals, which may omit significant sub-regional trends. In addition to finding a suitable format for presenting vkas the basic wind speed vb,0, a reassessment and updating with new information is needed.
A direct comparison between the wind speed given by Figure 1 for vkand for vb,0in SANS 10160-3:2010 is reported by Kruger et al (2013b), indicating a noticeable reduction over large regions of the country, particularly towards the north, including the metropolitan regions of Gauteng.
Moderation of updated gust statistics
The estimations of the design values developed in Kruger et al (2013a; 2013b) took into consideration:
i. The selection of appropriate statistical methodologies
ii. The provision for uncertainty in the results due to the use of short wind time series
iii. The spatial extents of relevant strong wind mechanisms (Kruger et al 2010; 2011a-b; 2013a)
iv. Adjustment of wind speed measurements to account for non-standard terrain roughness surrounding the AWSs (Kruger 2011).
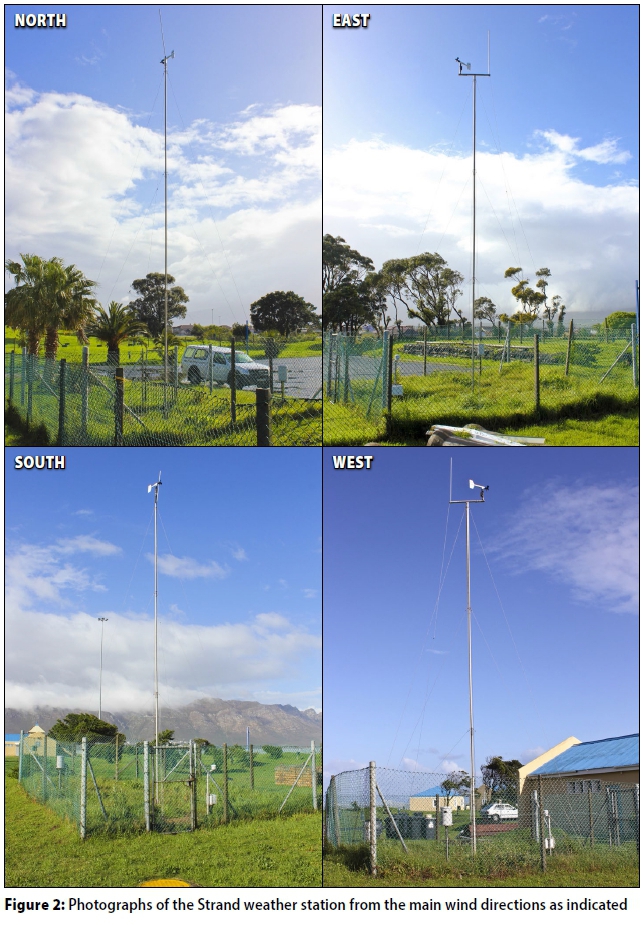
The adjustment for terrain roughness was identified to be the most subjective, partly due to the limited metadata information on the roughness conditions surrounding each AWS. Assessment was limited to Google Earth aerial imaging, where roughness classification could not be based on inspection records or photographs for the surrounding environments for an AWS (Kruger 2011; Kruger et al 2013c). These roughness adjustments had a significant influence on the estimation of the extreme wind statistics, as reported by Kruger et al (2013a & b). The measurements at the Strand, Elliot and Umtata stations where vkvalues exceed 45 m/s, were identified as requiring further scrutiny.
Recently SAWS has embarked on a comprehensive programme of updating all metadata in its AWS network. This involves documenting the environment around the AWS, including estimated distances to significant obstacles, tabulated assessments of surface roughness, nearby topography, and photographs of the AWS taken from each of the four main wind directions. This updated information made the objective reassessment of wind speed values possible, where adjustment of measured wind speed to an equivalent value for Terrain Category 2 terrain roughness made previously, could have been too conservative.
For the Strand, updated assessment based on photographic documentation (Figure 2), indicates standard roughness towards the northern sectors. Where wind speed was initially adjusted by as much as a factor of 1.67, a significant fraction of the measurements was used subsequently without adjustment. Consequently vkcould be reduced from 46.7 m/s to 41.0 m/s for this location.
The station at the Umtata Airport, which is well exposed, remained at 45 m/s. The value at Elliot could be re-estimated from 46.0 m/s to 44.7 m/s by extending the time series, effectively diluting the influence of a small number of relatively high annual maximum values.
Input from the Wind Atlas project
The Wind Atlas for South Africa (WASA 2015) project is coordinated and run under the auspices of the South African National Energy Development Institute (SANEDI).
The main aim of the project is to identify regions of high wind energy potential in the country. The project partnership includes SANEDI, the University of Cape Town (UCT), the Danish Technical University (DTU), the Council for Scientific and Industrial Research (CSIR) and SAWS.
The WASA project included a work package managed by SAWS and DTU, aimed at the development of information on extreme wind speeds. The class of wind turbine at a specific location is hence based on the extreme wind speed to be expected over a 50-year period. The atlas provides high-resolution maps for the project domain at two time scales, i.e. gust (2-3 s) and a 10-minute averaging period. An important component of the project relates to the integration of the extreme wind statistics derived from model and measured data, from which the final maps could be developed. Particularly the modelling part of the project required the development of new methodologies, to take into account the complex strong wind climate of South Africa (Kruger et al 2014; Larsén & Kruger 2014; Larsén et al 2013a and b; Larsén et al 2015). The verification of the modelled results comprised thorough comparisons with the results derived from measurements, i.e. those in Kruger et al (2013b). Where discrepancies occurred, particularly where the modelled results were significantly lower than those from the measurements, upward adjustments were made to the modelled data. In addition, all values were adjusted upwards to the closest 5 m/s interval above the specific values, accounting for the inherent uncertainty in extreme wind estimations, and also for simplification purposes, to produce the final statistics for the 1:50 year gust map at a resolution of about 4 km. These verified high-resolution outputs proved to be invaluable for the assignment of return values, especially within sparsely populated and topographically complex regions, where results from measured data were scarce or non-existent.
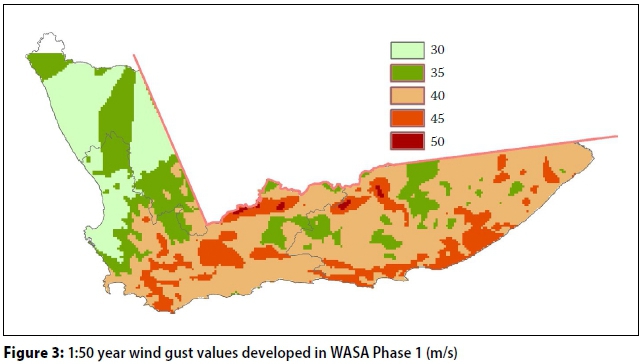
Figure 3 presents the 1:50 year wind gust map for the spatial domain of WASA Phase 1, concluded in March 2014. Apparent from the map is that most values in the southwestern Cape and eastwards are 40-45 m/s, while to the north of the southwestern Cape it is lower at 30-35 m/s. This pattern broadly confirms the results produced from measurements (Kruger et al 2013b), but also emphasises the role of local topography as a significant factor in the potential of strong wind gusts to develop. Examples of these are especially visible in the northeast and east of the domain, e.g. the isolated values of 50 m/s in the Nuweveld Mountains north of Beaufort-West and the Sneeuberg mountain range to the north and northeast of Graaff-Reinet. In contrast, lower values are shown in areas with relatively lower elevation than the surrounding areas, e.g. between the Swartberg and Nuweveld mountain ranges to the south of Beaufort-West, and to the east of the Sneeuberg mountain range.
Considering the spatial variability of strong winds due to local topographical features, it is important to note that the design wind statistics to be implemented in the loading standard should provide a conservative estimation of 1:50 year gust values over flat terrain, which conforms to Terrain Category 2. Special provision, as stipulated in the code, has to be made for those cases that do not conform to the above criteria. The WASA gust map shown in Figure 3 provides realistic data on strong wind climatology over the project domain, and it reflects the topographical detail which is expected to be resolved separately in the loading standard. The WASA map is therefore used mainly for interpolation purposes, while drafting the map for SANS 10160-3. The information presented in Figure 3 nevertheless provides useful background information for any designs within that region, particularly for mountainous localities.
BASIC WIND SPEED FORMAT
The objective of formatting the data on the basic wind speed is to present the updated information on the characteristic wind speed vkas the fundamental value of the basic wind speed vb,0unambiguously geographically across the country in terms of a stipulated wind speed interval. Whilst the map of vk and the WASA reanalysis are taken as indicative of regional trends, the updated set of vkaws wind speed values are considered as the basis for stipulating vb,0. This provides a limit to the spatial resolution of the format, determined by the 74 AWS dataset used by Kruger et al (2013a and b). The resolution of the wind speed range of 29-45 m/s is limited by the record period of 10-18 years. Some enhancement is achieved through advanced extreme value probability modelling, including the peak-over-threshold method for the short time series, as well as the statistical assessment of the mixed strong wind climate. Constraints on the resolution are eventually mitigated by the reliability modelling that accounts for all residual uncertainties, in addition to the time-variant nature of windstorms.
Basis for spatial resolution -local municipal districts
Presentation of the basic wind speed vb,0on a scale similar to that implied by the point values derived from the network of 74 AWS records, vk,AWSshould ensure the optimal use of the underlying information. This is in contrast to the approach taken for the compilation of the latest map of where an extensive set of isophlets is derived through a process of interpolation, including a degree of subjectivity (see Figure 1). Although the geographical distribution of local authority districts may appear to be unrelated to the strong wind climate of the country, similarities in the scale are nevertheless apparent when it is noted that there are 52 metropolitan areas and district municipalities, with a total of 240 local municipality districts. Additional commonalities can also be identified, such as the placement of AWSs, concentration of structures, regulatory functions of district centres, and even the influence of topographical features, e.g. mountain ranges and valleys, often forming natural district boundaries.
The use of a combination of metropolitan and district municipality areas will result in a close match between map zones and vk,AWSvalues. However, such coarse zoning would lead to an underutilisation of the available information. Furthermore, such zoning results in zero to five vk,AWSvalues per zone, with multiple values obtained for both large districts, such as the Northern Cape Province, and smaller districts, resulting from the nature of geography or settlement. This format was therefore not investigated further.
Local municipal districts, together with metropolitan areas, were therefore selected as basis for zones to represent uniform values of vho per zone, as derived from vkXws values obtained for the districts where the AWSs are situated. The average ratio of about three local municipalities to an AWS data point implies a mild degree of interpolation to estimate vh0values for all zones across the country. The mapping process is thereby discretised into 240 zones across the country to use as footprint for each of the 74 AWS data points (vk aws), with discrete interpolation for the remaining zones.
Wind speed resolution
Wind speed is presented in discrete format as vho values to represent selected intervals of vk aws values. The value of vho is selected at mid-range of the interval in order not to introduce a conservative bias into the format. The limit of 5 m/s applied to the vkmap (Figure 1) was relaxed to consider intervals of 4 m/s and 3 m/s. Such refinement was deemed to be justified by the simplification of the spatial zoning. Fragmentation of the discrete mapping of vb,0 was used as basis for setting a lower limit of 3 m/s, to the wind speed intervals.
Assessment of discrete format
While there was a significant improvement in the availability of data for the development of the maps in Kruger et al (2013a & b) compared to when the previous map was developed by Milford (1985a & b), the eventual spatial resolution can still be considered as inadequate over many regions of the country, especially those with significant topographical variation. The use of only in-situ measurements, which is the case for the greatest part of South Africa, will, at best, be able to provide a general impression of the strong wind climate only.
However, it should be considered that the vast majority of weather stations are located close to main built-up centres, particularly towns. In many cases these stations are situated at the local airports, which are in open terrain but still relatively close to built-up centres. Therefore it can be argued that the measurements from weather stations can be considered to be biased towards the areas of densest population or of strategic/developmental importance. This justifies an assumption that the strong wind statistics from the weather stations are largely representative of the built-up areas of the local municipalities in which they are located. The development of new infrastructure is most often also biased towards these areas.
Referring to municipal borders, these follow, where possible, the local topography and other natural features. Figure 4 presents a map of the topography of South Africa, with the local municipal borders superimposed. It is apparent that some borders between provinces, e.g. between the Free State and KwaZulu-Natal, and the Western and Northern Cape provinces are defined by the topography, particularly the escarpment, which in turn dictates the municipal borders in the relevant areas. Especially in the Limpopo, Mpumalanga, Eastern Cape and Western Cape provinces many local municipal borders follow the regional topography.
A third important consideration, which is relevant to the practicality and user-friendliness of the final basic wind speed map, is that it would be convenient to unambiguously identify the appropriate basic wind speed value by only having to reference the value assigned to the local municipality where the structure is planned. This provides a direct link between the design process and the regulatory function of local authorities.
Adjacent regions of high economic activity
It is preferable that in contiguous regions of high economic activity the development should be subject to design criteria that are consistent across common municipal borders. It was therefore deemed sensible to assign single design values to those district municipalities or larger regions where economic activity is relatively high and integrated. These large metropolitan regions include Gauteng, southwestern Cape, Port Elizabeth and Durban.
IMPLEMENTATION
The main steps for implementing the representation of vb,0according to the discrete spatial and wind speed format are as follows:
i. Set up a basic map of vk,awsvalues for the zones representing the AWS positions.
ii. Derive the vb,0values from an appropriate set of wind speed intervals.
iii. Extend the basic map to all zones, considering related information, including some degree of simplification.
Basic map of vk,AWS values
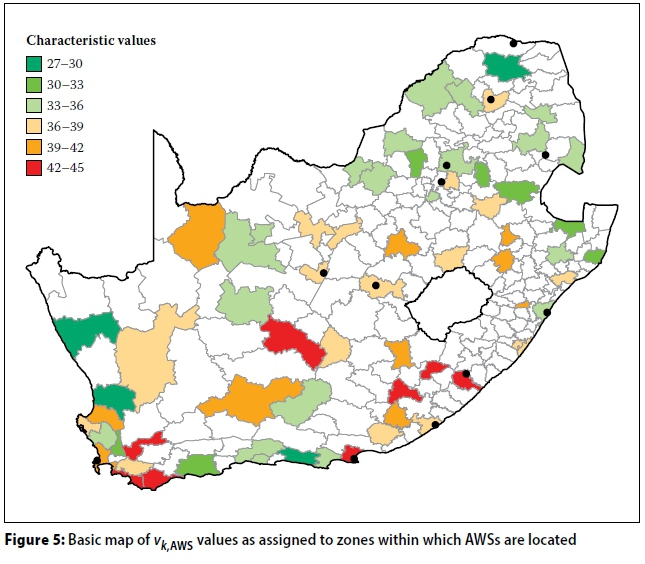
The geographic input information of vk,awsvalues that serve as the basic map for the implementation of the zone-based mapping of vk,awsis shown in Figure 5, as arranged in 3 m/s intervals starting from the maximum value of vk= 45 m/s (white areas reflect municipal regions in which no relevant/ adequate wind speed records are available). The basic map provides information on the features of local districts, serving as discrete zones, sampling of vk,AWSvalues and the extension needed to stipulate vb,0, the distribution of wind speed values.
Striking features of the district-based zones are the irregular shapes and size, ranging from dense networks to large zones, generally from east to west. A surprisingly large number of unpopulated zones, shown in blank, are adjacent to at least one AWS zone. The exception is a substantial region of KwaZulu-Natal and the Eastern Cape where the AWS network does not provide any measured data.
On a countrywide scale there is a clear trend of decreasing wind speed from south to north, with low to high values occurring in the southern third of the country, medium to low values for the central third, and generally low values for the northern third. The complexity of the southwestern part of the country is illustrated by the full range of six intervals of vk,AWS values over a small cluster of adjacent zones. A mild degree of fragmentation can also be observed over the central parts of the country, mostly in the Free State and Northern Cape provinces.
Set of stipulated vb,0 values
The intervals of the isophlets on a map can be considered to be a compromise between the required detail and sufficient spatial information. For the map of design wind gust values, additional factors were considered, mainly:
i. The reassessed values in the Eastern and Western Cape
ii. The assignment of unique values at local municipal level
iii. The objective to assign the same values to larger regions with relatively high and integrated economic activity.
For the hourly map, to be provided as additional information in the revised code, reassessment of the characteristic hourly wind speed is not deemed to be necessary, so that only factors (ii) and (iii) are applicable.
Selection of characteristic values
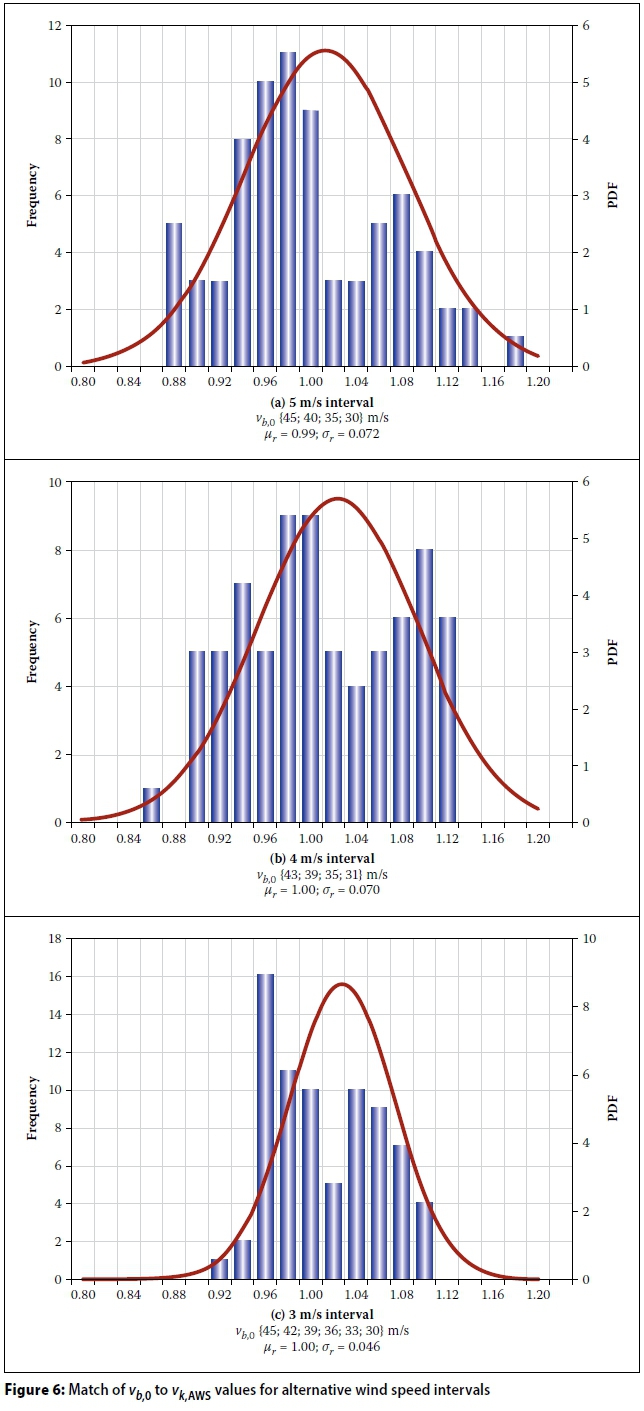
The scale of values for vb,0selected to represent the range of vk,AWS values from 28.7 m/s to 45 m/s can be determined algorithmically by selecting the starting point, the interval and the assigned value within the interval. To be consistent with the reliability-based approach, vb,0is selected as the mid-value of the interval. As motivated above, the interval of 5 m/s used for the isopleth map could be reduced due to the area zoning used for vb,0. Three intervals of 5 m/s, 4 m/s and 3 m/s were considered. Without rounding off, four vb,0values are needed to scale the range for 5 m/s and 4 m/s intervals and six values for 3 m/s interval.
The statistics of the ratio of r= vb,0/ vk,awsper zone was used as a diagnostic tool to assess the consistency of the match between the resulting vb,0,zoneand input vk,AWSvalues. The mean of r (μr) is an indication of any bias, which is intended to be close to 1.0. The standard deviation (σr) indicates dispersion, aimed to be as small as possible. A uniform set of r values indicates an even spread across the interval. Indicative results are displayed in Figure 6.
The above results indicate no effective bias, comparable dispersion for 5 m/s and 4 m/s intervals, and a noticeable reduction in dispersion for the 3 m/s case. The 4 m/s case provides the closest approximation of a uniform distribution. The dispersion and uniformity of r values are relatively sensitive to the selected values of vb,0, which are mostly influenced by small numbers of observations at the low and high extremes. For further analysis the set of values for a 4 m/s interval was adjusted to {44; 40; 36; 32} m/s rounded values, introducing bias from a longer lower tail, with μr= 0.98; σr= 0.075.
Spatial interpolation
The selection of the range of vb,0can be assessed quantitatively and rationally for the set of zones with AWSs, with uncertainties fully accounted for in the reliability assessment. Assignment of values to unpopulated zones is more difficult, requiring a strong element of judgement based on interrelated but indirect information. This process is complicated by the fragmented nature of the basic map of Vk,AWSshown in Figure 5.
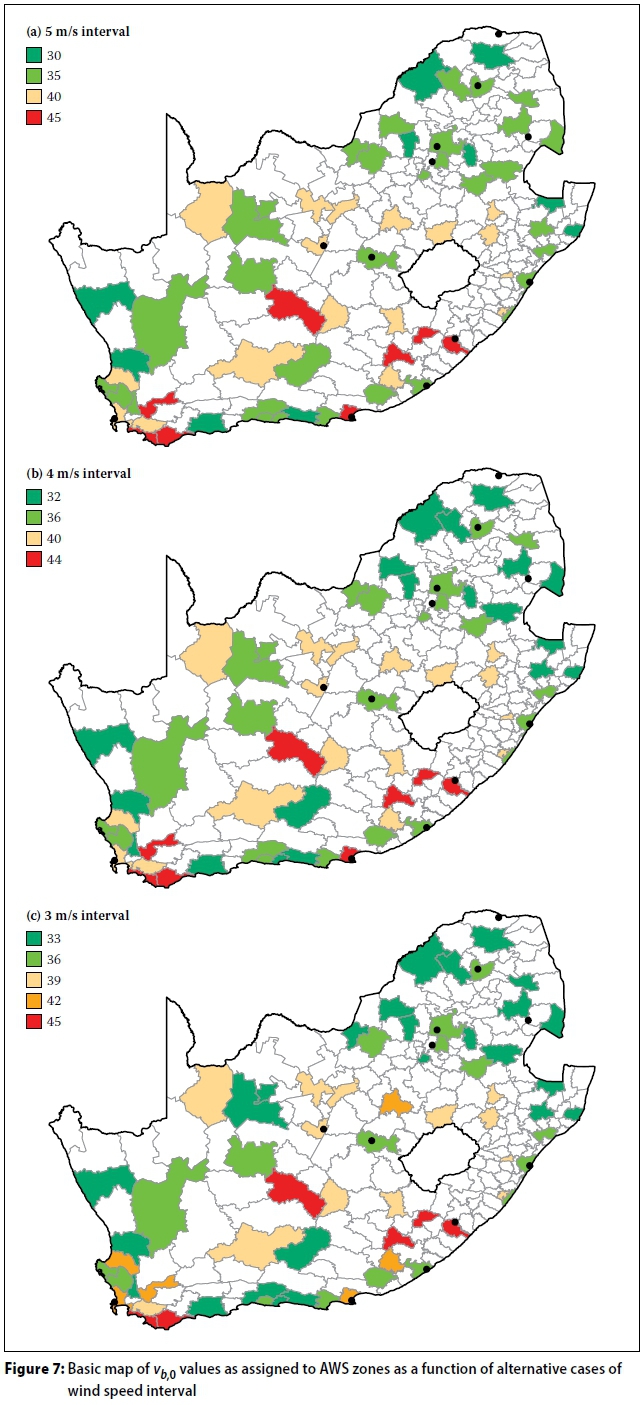
The first step of the process is to apply the Vb,0values corresponding to 5, 4 and 3 m/s intervals to the AWS zones (see Figure 7). Close inspection shows virtually no difference for the two upper vb,0values for the 5 m/s and 4 m/s cases, relevant to the central and southern third regions of the country. The most significant changes are from the second lowest to the lowest interval for three zones in the far south and for six zones across the northern and northeastern regions. In spite of the difficulties of comparing four vb,0 categories for the 4 m/s case, with the six categories for the 3 m/s interval, a similar pattern can be observed, with an increase in the number of zones in the lowest category corresponding to 3 m/s; in this case a few similar isolated changes occur for the midrange categories.
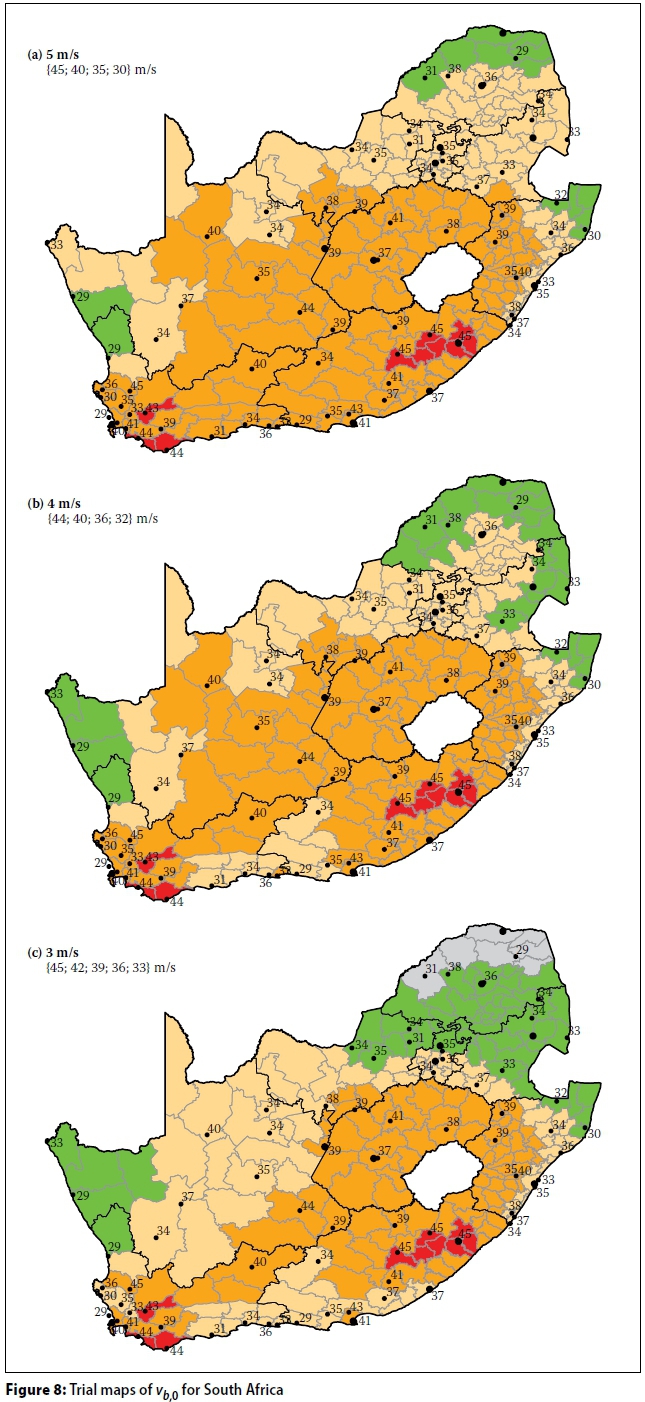
The basic vb,0map shown in Figure 7 was used to derive alternative trial maps for the three interval cases as shown in Figure 8. As a simplification of the 3 m/s map, the lowest two intervals (33 m/s and 36 m/s) were combined to result in the use of 5 intervals, with the lower limit for vb,0set at 33 m/s. This led to diagnostic statistics close to those of the 4 m/s format.
Since the reliability performance of the interpolation stage of the mapping process cannot be quantified, the tendency was adopted to adjudicate on the conservative side whenever the decision-making was not clear cut. Examples of a conservative approach are smoothing of the upper limit of the complex array of regions for the southwestern region, a safe value assigned to large uncharted regions of KwaZulu-Natal, and somewhat conservative treatment of the central regions of the country. A degree of smoothing out of the high value obtained for the AWS at De Aar is an example of some moderation that was applied.
Assessment
The following advantages and disadvantages of the interval selection were considered:
i. 3 m/s: The map has the largest number of wind speed categories (five) and therefore it could better reflect the values at station level. However, a large fraction of the assigned values could not be backed up by the low spatial resolution of the values at station level; this increased the subjectivity in the development process of the map.
ii. 4 m/s: The 4 m/s interval was just as effective to create adjacent regions with similar values as at the 3 m/s level. While the map has a smaller number of categories as with 3 m/s, it was deemed to be as effective to capture the design values at station level. Of the three options, the 4 m/s interval seemed to provide the optimal compromise between the number of categories, spatial amalgamation of same values, and representivity of the values at station level.
iii. 5 m/s: With the 5 m/s it became more difficult to assign values that gave an acceptable reflection of the values at station level, also limiting the possibilities to justify large adjoining regions with the same values.
Proposed map of basic wind speed
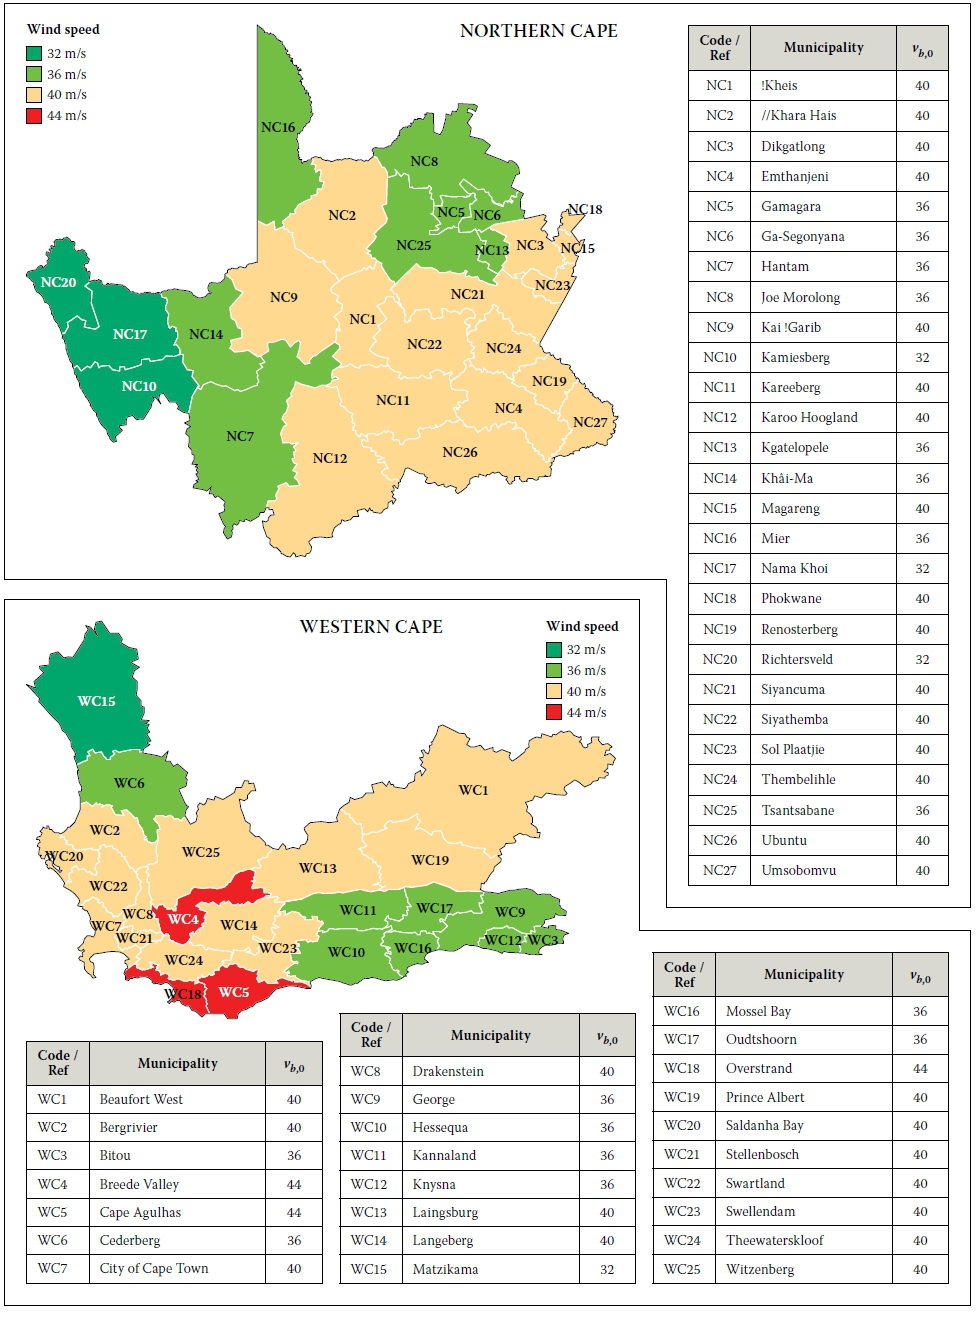
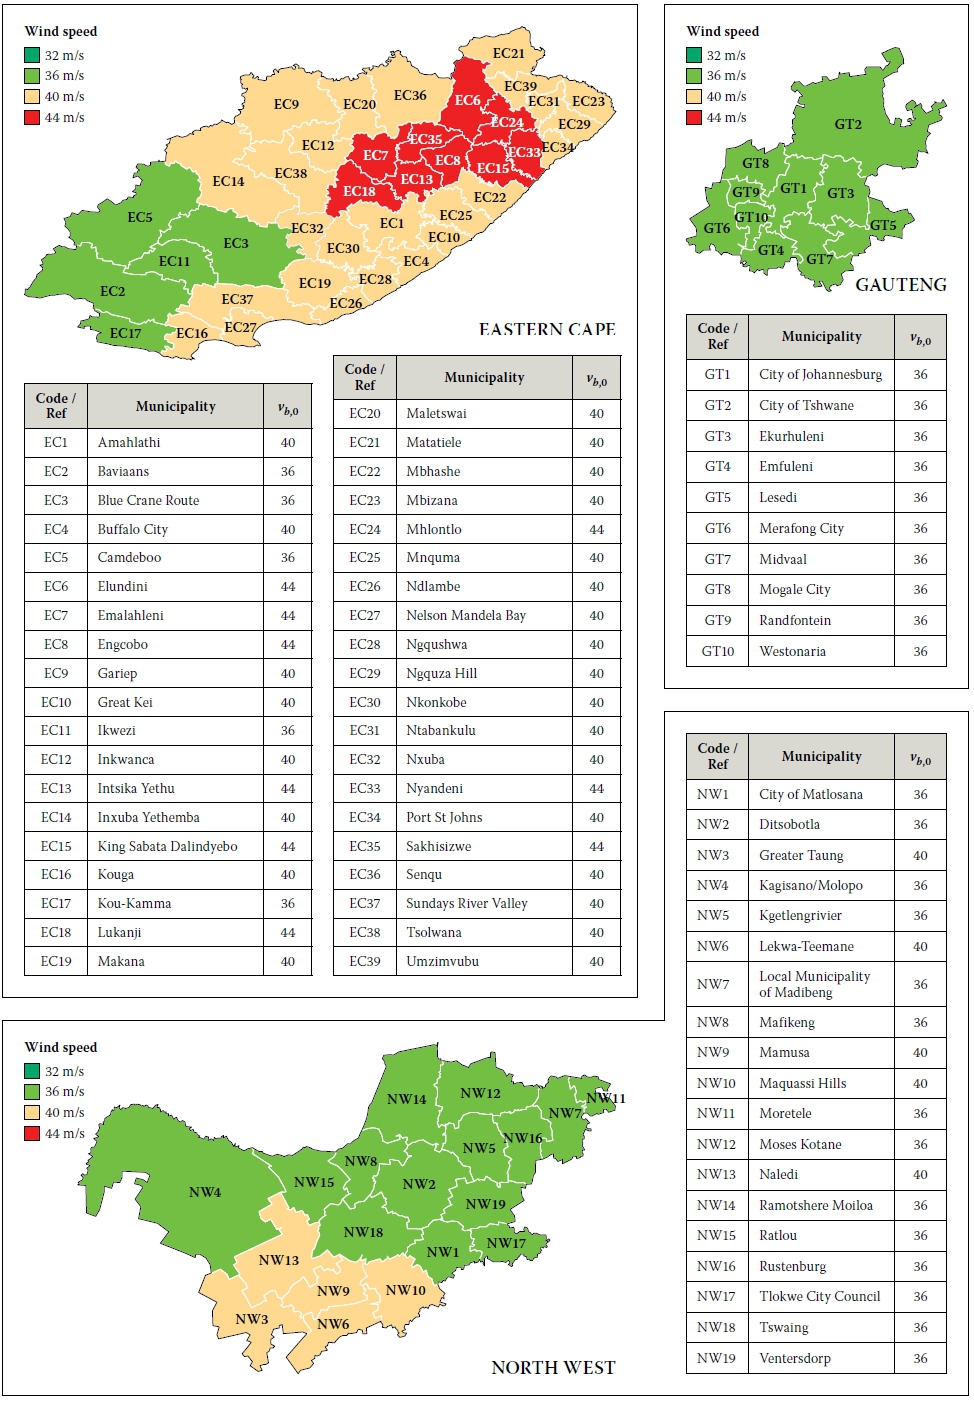
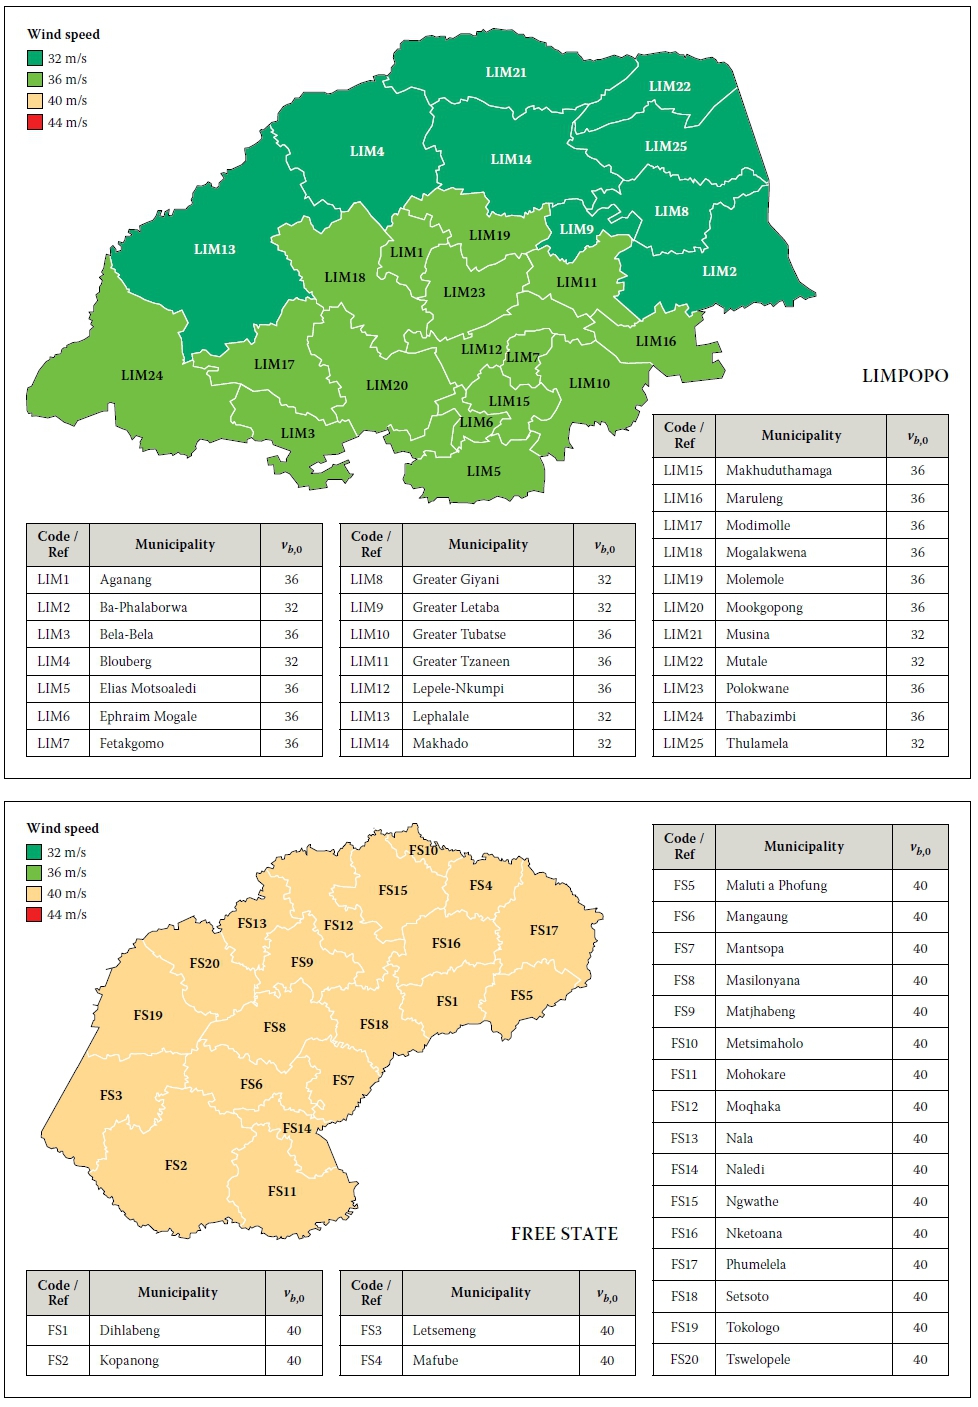
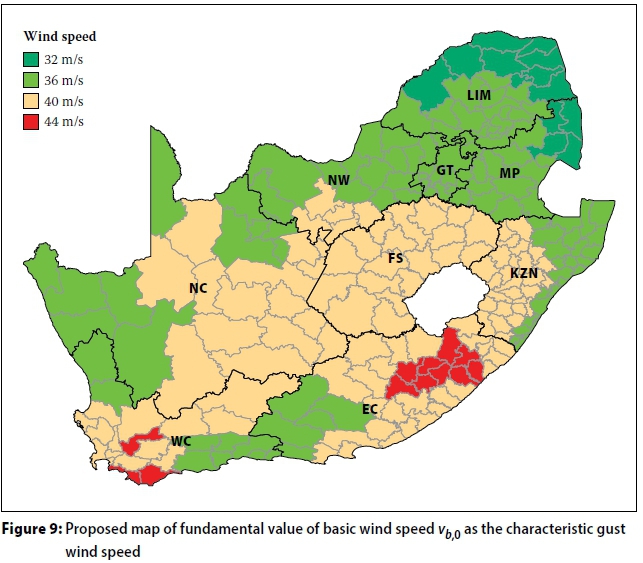
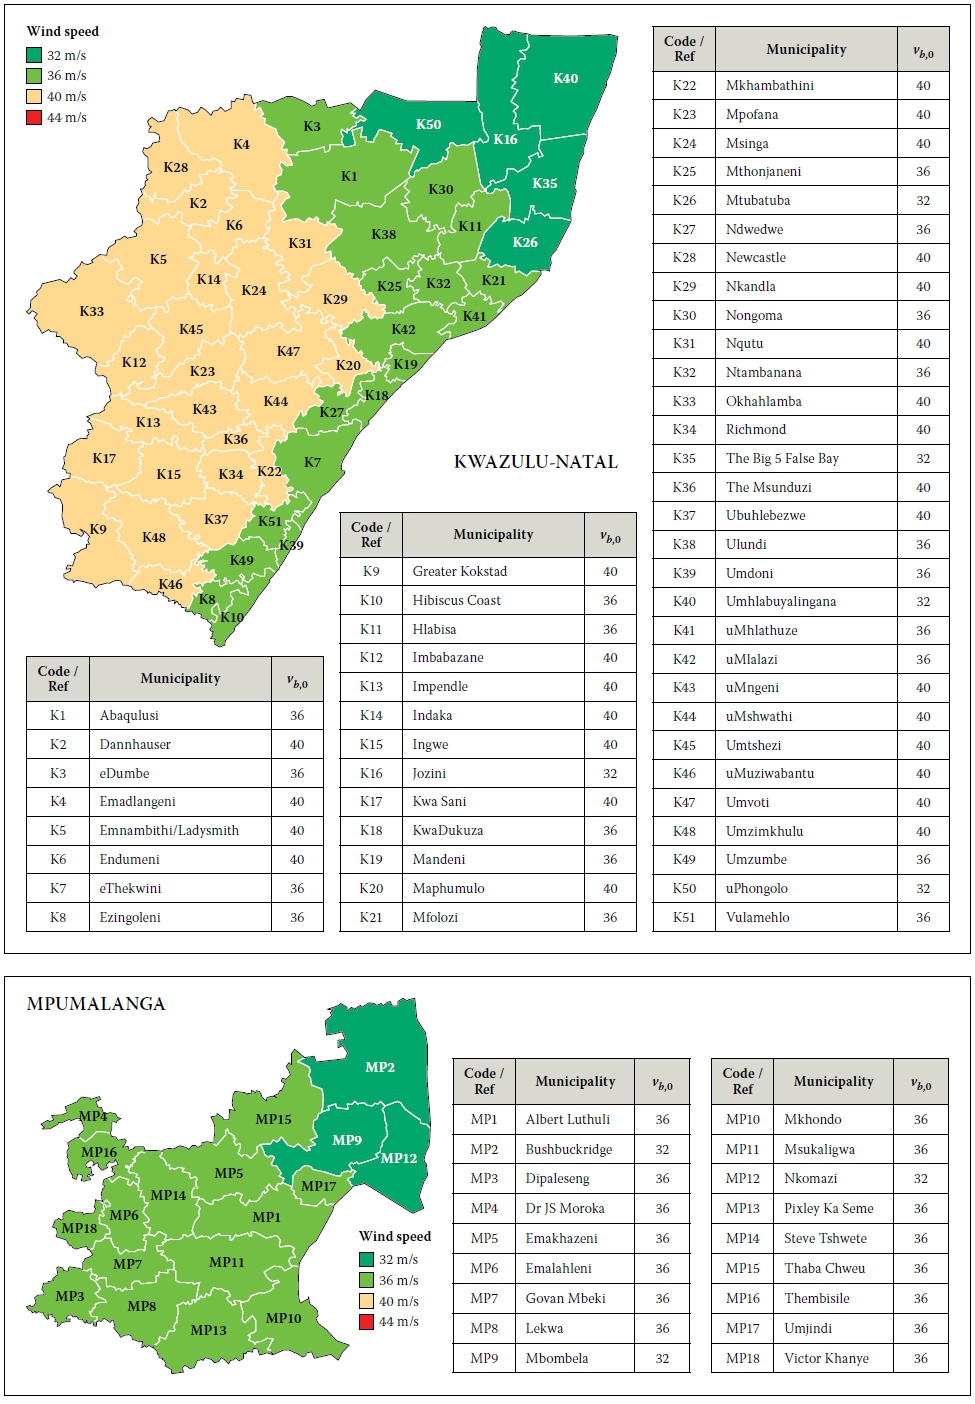
The map based on 4 m/s intervals stipulated at the values for vb,0at {44; 40; 36; 32} m/s, as shown in Figure 9, is proposed to present the best balance between the underlying information and operational use in design. The information can effectively be tabulated per province as shown in Appendix A, and referenced back to the geographical distribution in Figure 9. The geographic map and the tabulated list are related by assigning a common code to each district.
There are two regions where the design gust values assigned are higher than in the map included in the 1989 version of the standard, i.e. in the Breede Valley municipality (Worcester), and an extensive region in the eastern interior of the Eastern Cape Province. In the case of the former, a 1 in 50 year gust value obtained from statistical analysis vkwas 43 m/s, which can be considered to be accurate, bearing in mind the adequacy of the climate station from which the measurements were made, which is at the airport on the outskirts of the town. For the Eastern Cape several stations showed 1 in 50 year values of about 45 m/s, including Umtata. However, the true extent of the area to be assigned needs to be reconsidered when additional or updated information becomes available. Phase 2 of the Wind Atlas of South Africa (WASA) project will include the northern part of the Eastern Cape, and will hopefully provide improved insight into the prevailing strong wind climate to the south and southeast of the escarpment.
Hourly wind speed map
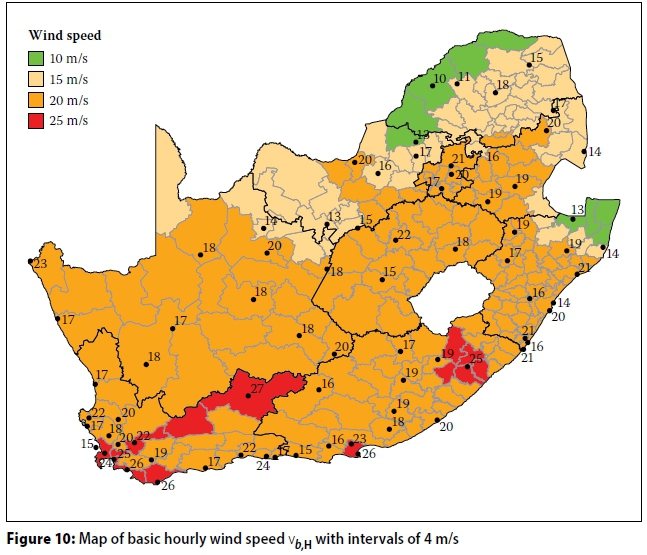
The advanced extreme value assessment of the hourly average annual maximum wind speed and mapping of the 1:50 year characteristic wind speed (Vk,H) reported by Kruger et al (2013a & b) serves as input for the compilation of an operational map on the basis of local district zoning, similar to that for gust wind. A wind speed interval of 4 m/s provides a balance between the underlying information on the spatial and temporal behaviour of vk,H,as well as the operational use of the map. Figure 10 provides a map for the basic hourly wind speed (vb,H), covering the range of wind speed from 10 to 27 m/s by the set of four values {24; 20; 16; 12} m/s. This map shows a substantial improvement in resolution, compared to the map appended in SABS 0160:1989 and the simplification of the updated map given by Kruger et al (2013b). A comparison between the ratios of values allocated for gust and hourly values shows that, in the context of the South African mixed strong wind climate, it is impossible to apply a simple derivation from one time resolution to another. This "disconnect" between different time resolutions, where the ratios between the 1:50 year gust and 1:50 year wind speeds at longer time scales vary spatially, is indicative of the different causes of strong winds at different time scales. In the interior, where thunderstorms are prevalent, the ratio between the gust and hourly wind speed is much larger than along the coast (also see Kruger 2011).
CONCLUSIONS
The main features of the updated and revised map stipulating the basic wind speed vb,0shown in Figure 9, as derived from the 1:50 year or characteristic gust wind speed vk shown in Figure 1, are as follows:
■ The extensive increase in the number of annual extreme wind events across the country substantially increases the information in the form of probability models for the wind speed V, both spatially and temporally, including the resolution of the complex strong wind climate.
■ The observation of a 2 to 3 s gust wind speed makes it possible to express vb,0directly as the gust wind, compared to the 'synthetic' map expressed as an effective 10 minute mean value used in SANS 10160-3:2010. Additional uncertainties resulting from the indirect model for a gust factor is thereby avoided.
■ The spatial representation of vb,0on the basis of 240 local municipal districts provides a convenient grid of zones that is sufficiently compatible with the 74 vk,awsdatasets to cover the country, with limited interpolation needed to establish vb,0values for the balance of zones. Mapping could conveniently be separated into determining appropriate vk,aws intervals for individual AWS positions and the interpolation to obtain the countrywide basic wind speed vb,0map.
■ The relatively even distribution of the AWS districts results not only in a reasonable spatial sampling of vk,aws, but also results in most of the municipal regions with no AWS installations to be adjacent to at least one AWS zone (see Figure 5). Notable exceptions are the sparse distribution of AWS zones in the inland regions of KwaZulu-Natal and the Eastern Cape provinces, and the dense distribution across the complex topography of the southwestern parts of the Western Cape Province. Limited sampling of the large area across the central regions of the country, from the southern parts of the Northern Cape Province to the Free State Province, makes interpolation somewhat tentative.
■ The haphazard shape of individual districts is smoothed out on a countrywide scale. This results in coherent regions for the lowest three vb,0values, with a limited number of small island regions for the 44 m/s zone. In addition to the reasonable shape of the zones, the administrative convenience of stipulating vb,0values adds to the utility of the map format. This is further substantiated by the possibility of providing the information in a tabular format.
■ The significant reduction in vb,0implied by the updated information (Kruger et al 2013b), is confirmed for the northern part of the country by Figure 9. However, for the central parts of the country there is no effective reduction in the value. This outcome results partly from the lower spatial resolution used for Figure 9, compared to Figure 1. To some extent this is due to the arguably somewhat conservative bias of interpolation for the sparse distribution of vk,awsfor this region.
■ A superficial comparison between the map for vb,0, based on the gust wind speed shown in Figure 9 and the vb,hhourly mean wind speed shown in Figure 10, indicates significant differences in the geographic distribution of wind speed intervals. This results from differences in the strong wind climate, ranging geographically to be described as synoptic, convective or mixed. The implied differences in the ratio of 3 s gust to hourly mean wind speeds across the country indicate that the Eurocode practice of applying a uniform procedure for a gust factor is not suitable for South Africa.
■ The probability models on which the map for vb,0is based, serve as input to the reliability assessment of wind loading procedures, as expressed by the partial load factor for wind (γq,w). The spatial and wind speed discretisation of the basic map for the characteristic wind speed should facilitate the future updating based on:
i. additional information that will arise from the extension of the recording period of the AWS network,
ii. extension of the network by additional stations accumulating sufficient data for extreme value analysis, and
iii. the extension of the WASA project regions.
REFERENCES
Goliger, A M, Retief, J V Dunaiski, P E & Kruger, A C 2009. Revised wind-loading design procedures for SANS 10160. Chapter 3-2 in Retief, J V, Dunaiski, P E (Eds.). Background to SANS 10160. Stellenbosch: SUN MeDIA. [ Links ]
Goliger, A M, Retief, J V & Kruger, A C 2017. Review of climatic input data for wind load design in accordance with SANS 10160-3. Journal of the South African Institution of Civil Engineering, 59(4): 2-11. [ Links ]
Holický, M 2009. Reliability analysis for structural design. Stellenbosch: SUN MeDIA. [ Links ]
Holmes, J D & Ginger, J D 2012. The gust wind speed duration in AS/NZS 1170.2. Australian Journal of Structural Engineering (IEAust), 13: 207-217. [ Links ]
Holmes, J D, Allsop, A C & Ginger, J D 2014. Gust durations, gust factors and gust response factors in wind codes and standards. Wind and Structures, 19: 339-352. [ Links ]
Kruger, A C 2011. Wind climatology of South Africa relevant to the design of the built environment. PhD thesis, Stellenbosch University. Available at: http://www.hdl.handle.net/10019.1/6847. [ Links ]
Kruger, A C, Goliger, A M, Retief, J V & Sekele, S 2010. Strong wind climatic zones in South Africa. Wind & Structures, 13(1): 37-55. [ Links ]
Kruger, A C, Goliger, A M & Retief, J V 2011a. Integration and implications of strong wind-producing mechanisms in South Africa. Proceedings, 13th International Conference on Wind Engineering, 9-11 July 2011, Amsterdam. [ Links ]
Kruger, A C, Goliger, A M & Retief, J V 2011b. An updated description of the strong-wind climate of South Africa. Proceedings, 13th International Conference on Wind Engineering, 9-11 July 2011, Amsterdam. [ Links ]
Kruger, A C, Goliger, A M, Retief, J V & Sekele, S 2012. Clustering of extreme winds in the mixed climate of South Africa. Wind & Structures, 15(2): 87-109. [ Links ]
Kruger, A C, Retief, J V & Goliger, A M 2013a. Strong winds in South Africa: Part I - Application of estimation methods. Journal of the South African Institution of Civil Engineering, 55(2): 29-45. [ Links ]
Kruger, A C, Retief, J V& Goliger, A M 2013b. Strong winds in South Africa: Part II - Mapping of updated statistics. Journal of the South African Institution of Civil Engineering, 55(2): 46-58. [ Links ]
Kruger, A C, Goliger, A M & Retief J V 2013c. Representivity of wind measurements for design wind speed estimations. Proceedings, 6th European-African Conference on Wind Engineering, Cambridge, UK, 7-11 July 2013. [ Links ]
Kruger, A C, Goliger, A M, Larsén, X G & Retief, J V 2014. Optimal application of climate data to the development of design wind speeds. Proceedings, 26th Conference on Climate Variability and Change (Annual Meeting of the American Meteorological Society), Atlanta, GA, February 2014. [ Links ]
Larsén, X G & Kruger, A C 2014. Application of the spectral correction method to reanalysis data in South Africa. Journal of Wind Engineering and Industrial Aerodynamics, 133: 110-122. [ Links ]
Larsén, X G, Kruger A C, Badger, J & Jørgensen, H E 2013a. Extreme wind atlases of South Africa from global reanalysis data. Proceedings, 6th European-African Conference on Wind Engineering, Cambridge, UK, July 2013. [ Links ]
Larsén, X G, Kruger, A C, Badger, J & Jørgensen, H E 2013b. Dynamical and statistical downscaling approaches for extreme wind atlas of South Africa. Proceedings, European Meteorological Society Conference, Reading, UK, September 2013. [ Links ]
Larsén, X G, Mann J, Rathmann, O & Jørgensen, H E 2015. Uncertainties of the 50-year wind from short time series using generalized extreme value distribution and generalized Pareto distribution. Wind Energy, 18(1): 59-74. [ Links ]
Milford, R V 1985a. Extreme-value analysis of South African mean hourly wind speed data. Unpublished Internal Report 85/1, Structural and Geotechnical Engineering Division, National Building Research Institute, CSIR, Pretoria. [ Links ]
Milford, R V 1985b. Extreme value analysis of South African gust speed data. Unpublished Internal Report 85/4, Structural and Geotechnical Engineering Division, National Building Research Institute, CSIR, Pretoria [ Links ]
SABS 0160:1989. The General Procedures and Loadings to be Adopted in the Design of Buildings. Pretoria: South African Bureau of Standards. [ Links ]
SANS (South African National Standard) 2010. SANS 10160-3:2010. Basis of Structural Design and Actions for Buildings and Industrial Structures. Part 3: Wind Actions. Pretoria: SABS Standards Division. [ Links ]
WASA Phase 1 2015. Wind Atlas for South Africa. South African National Energy Development Institute. Available at: http://www.wasaproject.info/docs/WASABooklet.pdf [ Links ]
 Correspondence:
A C Kruger
Chief Scientist Department of Geography
Climate Data Analysis & Research Geoinformatics and Meteorology
Department: Climate Service University of Pretoria
South African Weather Service Pretoria 0002
Private Bag X097, Pretoria 0001 South Africa
South Africa
T: +27 12 367 6074
E: andries.kruger@weathersa.co.za
J V Retief
Department of Civil Engineering
Stellenbosch University
Private Bag X1, Matieland, Stellenbosch 7602, South Africa
T: +27 21 808 4442
E: jvr@sun.ac.za
A M Goliger
Council for Scientific and Industrial Research (CSIR)
T: +27 83 660 8205
E: adam.goliger@gmail.com

DR ANDRIES KRUGER obtained his MSc degree from the University of Cape Town in the Geographical and Environmental Sciences, and his PhD from the University of Stellenbosch in Civil Engineering, with the research topic Wind Climatology and Statistics of South Africa relevant to the Design of the Built Environment. Since 1985 he has been involved in the observation, analysis and research of historical climate at the South African Weather Service. This has included climate change and variability research, the authoring of general climate publications, and other climatological studies through consultation. He is the author or co-author of a substantial number of scientific publications.

PROF JOHAN RETIEF, who is a Fellow of the South African Institution of Civil Engineering, is Emeritus Professor in Civil Engineering at Stellenbosch University. His field of interest is the development of risk and reliability as the basis of design for structures, with specific applications to wind loading, structural concrete and geotechnical practice, amongst related topics. He is a member of SABS TC98 Structural and geotechnical design standards, and is the national representative to ISO TC98 Bases of design and actons on structures, and a member of various Working Groups of these TCs (technical committees). He holds degrees from Pretoria University, Imperial College, Stanford University and Stellenbosch University.

DR ADAM GOLIGER obtained his MSc degree from the Warsaw Technical University, and his PhD and DEng degrees from Stellenbosch University, all in Structural Engineering. Until 2016 (for more than 30 years) he was involved in research and consulting work at the CSIR (Council for Scientific and Industrial Research). This included wind-tunnel simulation and modelling techniques, wind damage and environmental studies around buildings. For several years he served as the South African representative on the International Association for Wind Engineering (IAWE), and participated in various local and international committees and research panels. He is the author or co-author of more than 100 scientific publications and numerous technical reports.
Gust design values assigned per local municipality, according to province and alphabetically arranged. District boundaries and the names of local municipalities are based on the demarcation information as at: http://www.demarcation.org.za/index.php/downloads/boundary-data (on 2016 11 01).

