


Services on Demand
Article
 English (pdf)
 Article in xml format
 Article references
Indicators

Related links
-
 Cited by Google
 -
 Similars in Google
Share

 Permalink
Journal of the South African Institution of Civil Engineering
On-line version ISSN 2309-8775
Print version ISSN 1021-2019
J. S. Afr. Inst. Civ. Eng. vol.59 n.4 Midrand Dec. 2017
http://dx.doi.org/10.17159/2309-8775/2017/v59n4a1
TECHNICAL PAPER
Review of climatic input data for wind load design in accordance with SANS 10160-3
A M Goliger; J V Retief; A C Kruger
ABSTRACT
With the publication of Part 3 Wind Actions of the South African Loading Code SANS 10160:2010, several issues concerning adjustments from the reference standard Eurocode EN 1991-1-4:2004 could not be resolved due to lack of sufficient updated background information on South African conditions. The need for updating the map for the free field wind speed is related also to the improved representation of the mixed and complex strong wind climate of the country. Furthermore, strong wind probability models are used for the reliability assessment and calibration of wind design procedures. Updating of the reliability provisions for the revised wind loading process was a further need identified at the time.
This paper provides a review of the historical development of the representation of the free field wind, used as input to design wind loading procedures for South Africa. The review considers: (i) the historical representations of the geographic distribution of free field wind, (ii) the climatic influences considered, and (iii) the probabilistic bases for the stipulated wind speed for the reliability provisions for design wind loads. On this basis, the background and motivation are provided for updating SANS 10160-3:2010.
Keywords: wind loading, wind map, South Africa, probabilistic models
INTRODUCTION
Wind loading plays a key role in the design of all structures, even more so as the leading environmental load under the relatively mild South African climate conditions, since snow, thermal and seismic loading are generally not decisive in the design of the built environment. As a result, upgrading of design provisions for wind loading was an important consideration for the revision of the previous South African Loading Code (SA-LC) SABS 0160:1989 The general procedures and loading to be adopted in the design of buildings (Goliger et al 1998, 2001; Goliger 1999, 2007, 2016). The outcome was a complete revision of SANS 10160:2010 Basis of structural design and actions for buildings and industrial structures Part 3 Wind actions. (SANS 10160 was reissued in 2011 as Edition 1.1 to include errata, but will be referred to here as dated by Edition 1).
The general suitability of Eurocode EN 1991-1-4 General actions - Wind actions, as reference for the new South African standard on wind loading (Goliger et al 2009a), formed an important component of the decision to base SANS 10160:2010 on appropriate Eurocode standards and parts thereof (Retief et al 2009). The main considerations and justifications for the adaptation of EN 1991-1-4 to the South African wind load standard are presented by Goliger et al (2009b).
Even with the major revision of the standardised procedures for wind loading incorporated in SANS 10160-3:2010, significant components of the standard were only nominally adjusted from SABS 0160:1989.
This was mainly due to the lack of resources to resolve the differences in strong wind climate implemented in Eurocode provisions and South African conditions. In addition there was a clear need to update the information on which the strong wind climate was characterised.
The nominal treatment of the wind map of characteristic free field wind speed (vb,0)and apparent insufficient provision for the reliability performance of wind loading, that may result from the anomalously low wind load partial factor (γq,w), was justified on the basis that the Eurocode procedures result in a significant increase in design wind load in comparison to previous stipulations provided by SABS 0160:1989 (Goliger et al 2009a).
Furthermore, no substantial information was available to justify an increase of the partial factor (Retief & Dunaiski 2009).
Extensive investigations were therefore launched to update the knowledge base on the South African strong wind climate, and the statistical models used for reliability assessment and calibration of design parameters. The outcomes of the investigations are directed towards the determination of the geographic representation of characteristic values for the free field wind speed across the country, as well as re-evaluation and determination of an appropriate partial load factor for wind loading. These two sets of information constitute the basic design parameters influencing the reliability performance of structures designed in accordance with SANS 10160-3.
In addition to the need for updating the representation of the South African strong wind climate, there is also the requirement of accounting for the differences between the European and South African climates. Eurocode procedures are broadly based on synoptic type wind storms, whilst meso-scale convective thunderstorms and regions of mixed climate, where both synoptic and convective wind storms occur, are widespread across South Africa (Kruger 2011; Kruger et al 2010, 2012, 2013a). Such differences have a bearing on the representation of gust wind loads on structures.
In the reliability assessment of SANS 10160:2010, the probability models used for SABS 0160:1989 were maintained (Retief & Dunaiski 2009). However, the probability models for wind loading deviated substantially from generic models accepted internationally, including differences for modelling time-invariant wind engineering aspects of wind loading. Lack of background information and resources prevented the resolution of anomalies in the wind load probability models for SANS 10160-3:2010.
This review paper provides the general framework for background investigations to standardised wind loading design for South Africa. It includes a review of critical wind engineering concepts and issues that have a bearing on the design process. The history of the development of mapping the characteristic free field wind speed for South Africa is assessed, which leads up to the latest, extensively updated, maps for the characteristic gust and hourly mean wind speed. Consequently, the need to convert the gust wind map into a suitable format that can be used in the operational design is justified. An outline is also provided of the interrelationship between the fundamental strong wind climate investigations, characteristic wind speed, reliability models for the wind speed and reliability-based design measures. This provides the basis for reassessment of the reliability provisions for SANS 10160-3 based on probability models for strong winds provided by Kruger et al (2013a), as proposed by Retief et al (2013).
BASIC CONCEPTS
Regional wind speed
Wind loading of structures and their elements are generated by a combined effect of the internal and external pressures. However, considered most critically, in terms of Bernoulli's equation (see Equation 1), the magnitude of pressure (p) on the structure is proportional to the square of the wind speed (v).
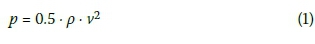
where p is the density of the flow medium (i.e. air).
This underlines the overriding importance of a reliable estimation of the magnitude of wind speed applicable to the specific design situation, which in turn is primarily determined by the basic regional wind speed, relevant to the geographical area of concern. It has been widely accepted that the prediction of regional wind speed forms the single greatest source of error in the design process, and therefore the use of the most appropriate and statistically sound wind statistics is of utmost importance to the design (Holmes 2001).
All national wind loading standards across the world contain information on the respective basic design wind speed. These reflect the macro-scale climate, exposure and topographical variability between regions, and are usually based on statistical analyses of the wind data captured by the respective national weather service authorities. Often differences between neighbouring regions or countries can be observed - an issue that became evident during the process of integrating the national maps of the European Union (EU) member countries into a unified EU wind map (Hansen 2013).
Wind loads, pressures and speed
As mentioned above, wind loading of structures and their elements results from integrated effects of resultant pressures (pr) produced by a combined effect of internal (pi)and external (pe) pressures pr= ∑(pr+ pe) acting over all surfaces. These pressures are generated by the movement of air over and across the structures, as affected by their geometrical shape (including bulk and aspect ratio), presence of dominant openings, and the overall aerodynamic solidity (i.e. amount of porosities).
Estimation errors
Equation 1 is, in principle, applicable to the laminar flow only (under an assumption of no vorticity and acceleration) and strictly speaking is rarely appropriate to built environment conditions. Nevertheless, it indicates the quadratic relationship between the wind speed and pressure and, therefore, the critical importance of a reliable estimation of the magnitude of wind speed applicable to the specific design situation.
This principle is demonstrated schematically in Figure 1, which depicts the implications of errors introduced by under- and overestimation of loading parameters vs errors in wind speed magnitude.
Zero percent reflects the actual, i.e. most appropriate, values. It can be seen that an overestimation of 30% in the magnitude of loading parameters implies a similar increase in the loading effect. However, such an erroneous increase in wind speed magnitude implies about 70% increase in the loading effect! Unfortunately, differences and inconsistencies in the order of 20% to 30% are not uncommon in measurements and estimations of the free field wind speed in full-scale conditions (mainly due to an insufficient geographical coverage of full-scale observation recorders and the lack of representivity of their measurements of the prevailing wind climate due to improper siting).
Peak gust and hourly mean wind speeds
In the design process, as reflected in all international loading manuals and standards, the magnitude of wind speed affecting a specific structure or design situation is determined by several factors, including e.g. topography, terrain roughness and elevation above the ground level, as well as the surrounding environment. However, the primary influence relates to the general wind climate characteristics of the geographical area of concern, which is typically represented by the maps of the basic design wind speed.
Historically, most of the wind loading design procedures followed the static load application approach, with wind maps defined in terms of the 3-sec, 50-year return period gust, derived on the basis of extreme value analyses of the recorded wind data. The SABS 0160:1989 version of the wind loading standard also included a map of hourly mean wind speeds for the application in dynamic design procedures.
Reliability-based limit states design
The use of the partial factor limit states design approach, as a reliability-based semi-probabilistic design approach in SABS 0160:1989 (Kemp et al 1987), was transferred to SANS 10160:2010 (Retief & Dunaiski 2009). Accordingly, the design wind load (Qd)is expressed in terms of the partial factor for wind loads (γq)and the characteristic wind load (Qk) calculated from the characteristic wind speed (vk), as given by Equation 2:
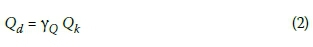
Probability models for annual maximum wind speed are needed for the two design parameters used in Equation 2. The characteristic wind speed (v^) to be implemented in Equation 1 is typically specified as the 2% fractile (1:50 year return period), and Yqis calibrated to obtain a design wind load at a target exceedance probability, conventionally expressed in terms of the target reliability ßT= Φ-1 (PF), where Φ is the cumulative normal distribution function. Appropriate extreme value probability models are used to represent the annual maximum wind speed.
Although the probability modelling of wind load is dominated by the inherent variability of the annual maximum wind speed, it is imperative to also consider the uncertainties of the wind engineering procedures for converting the free field wind speed to loading of the structure. The probability model for wind load therefore consists of a combination of the time-variant extreme value model for the basic wind speed and time-invariant models for the wind speed profile at the site, wind directionality, pressure and force coefficients, as stipulated in some of the basic wind engineering procedures.
WIND CLIMATIC DATA -HISTORICAL PERSPECTIVE
This section highlights the background of wind climate input data, and relevant statistical analyses, which were reflected in the previous versions of South African loading standards.
Early stipulations - SABS 024:1952
The development of the first South African uniform wind loading design stipulations was initiated by the South African Branch of the British Institution of Structural Engineers, and included in the Comprehensive Model Building Regulations, Chapter 3, Loads (SABS 024:1952). This document was developed with the assistance of and published by the British Ministry of Works, and coincided with the publication of the first version of CP3: Chapter V: Part 2 in the UK (BSI 1952). (Of interest to mention here - the very first version of the Wind Loading Code of Practice in the UK was published in 1944 as CP4.)At that time (i.e. after World War II) only a few countries across the world (e.g. Switzerland) introduced uniform wind loading manuals. and therefore the determination of the wind characteristic values were largely left to the ingenuity and expertise of the engineers who undertook specific designs.
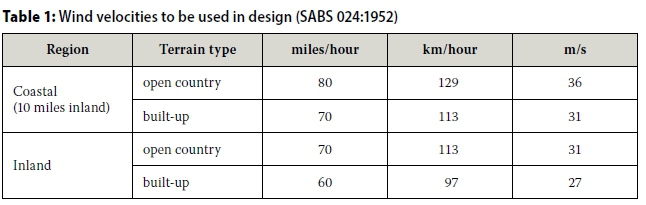
The design wind velocities, which appeared in SABS 024:1952, were stipulated in miles per hour for coastal belt vs inland and furthermore open country vs built-up areas, as reproduced in Table 1. The values are referred as the "highest average velocity for a single hour which includes allowance for wind gusts", which were extracted from a publication of the then South African Weather Bureau (SAWB 1949).
It is interesting to note that the magnitude of wind speeds included in Table 1 is evidently lower than that stipulated in the subsequent versions of the Standard. For example, the wind speed applicable to the design of buildings in Cape Town was 31 m/s only. From a structural reliability point of view, this situation could, however, be considered as broadly acceptable, keeping in mind the character of developments, design and construction practices which prevailed at the time. For example, building structures were typically of lower height (e.g. with fewer floor levels), with minor dynamic sensitivity. Usage of light-weight construction materials and glazing was limited, and no concealed sheeting systems existed. Only positively fixed roof sheeting with a minimum gauge of more than a millimetre was in use. Furthermore, the two-dimensional design calculation paradigm based on hand calculations was hugely conservative, as it ignored the three-dimensional transfer of loads considered in all modern structural engineering software.
Initial statistical analyses
The first statistical analysis of the wind climatic data, which was identified in the process of developing the current paper, was done by May (1972). It included a map of predicted 50-year return period mean hourly wind speed at specific geographic locations, reproduced here in Figure 2. The map was derived from an extreme value analysis of the data captured by seven wind speed recorders located at major population centres. The length of the records varied between 14 and 20 years. A comment was made in the paper that the previous design values used by engineers at that time lacked any statistical background and typically referred to the highest value of wind speed recorded by the closest anemometer.
Values of between 20 m/s and 25 m/s were predicted for the 1:50 year hourly mean wind speed. Obvious anomalies to more recent estimations are that the highest value of 24.7 m/s was estimated for Durban, 22.7 m/s for Bloemfontein and only 20.1 m/s for Cape Town.
In the late 1970s a subsequent statistical analysis of South African wind data was undertaken by Louw and Katsiambirtas (year unknown). For this analysis, data from 16 weather stations, with recording periods of between 15 and 20 years, was utilised. The resultant isophlets of estimated 50-year return period gusts are presented in Figure 3. It can be seen that for most of the country wind speed greater than 45 m/s was estimated, and for the area stretching between Prieska and Beaufort-West the estimation was as much as 55 m/s. The magnitude of wind speeds is considerably higher than provided by previous and subsequent maps. The map nevertheless provides a clear geographic pattern of wind speed varying between 35 m/s and 55 m/s.
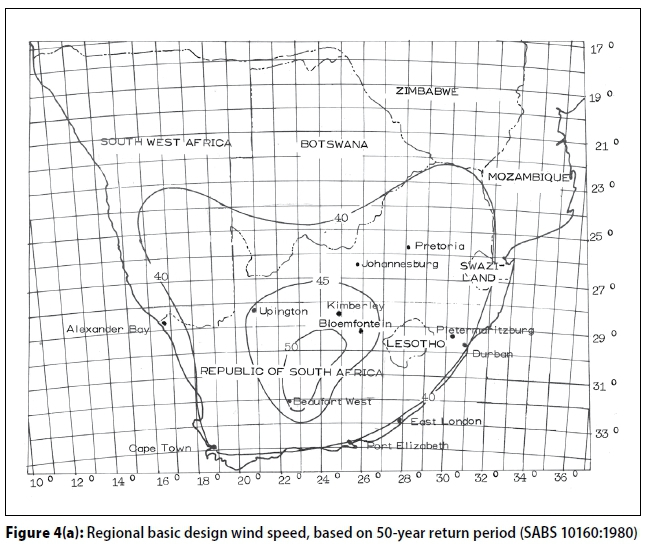
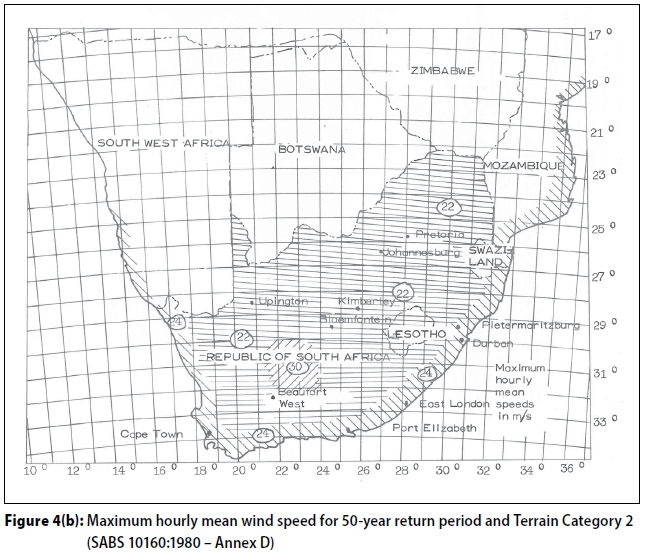
SABS 0160:1980
Between the 1950s and early 1970s the British loading code CP3: Chapter V, Part 2: Wind loads underwent several revisions, but largely retained its content and structure. This standard formed the basis for the development of the SABS 0160:1980 version, which included a map of the basic design wind speed in terms of maximum gust speeds (in m/s), as presented in Figure 4(a). This map was developed on the basis of the statistical analysis of SAWB data. The shape of the isopleths resembles that shown in Figure 3, but with different values. It can be seen that for most of the country a wind speed of 40 m/s was stipulated, and between 45 and 50 m/s for the regions extending between Upington - Bloemfontein - Beaufort-West. The coastal areas are not clearly indicated, but it can be assumed that a wind speed of 40 m/s is applicable.
The code also included a map of the maximum hourly wind speed for a 50-year return period, as presented in Figure 4(b). For most of the country a wind speed of 22 m/s is stipulated, and 24 m/s for the entire coastal region (up to about 80-100 km inland).
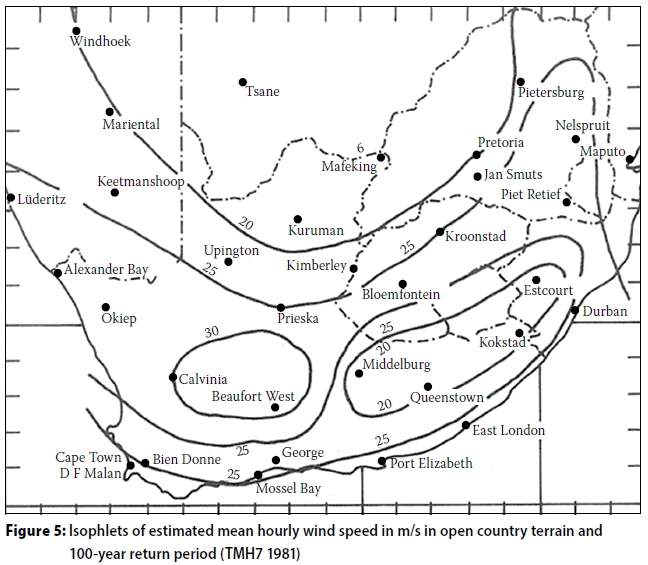
TMH7 - 1981
In 1981 the TMH7 Code of practice for the design of highway bridges and culverts in South Africa was developed by the Council for Scientific and Industrial Research (CSIR) at the request of the Committee for State Road Authorities. This code incorporated a map of isophlets of estimated 1:100 year hourly wind speed, as presented in Figure 5 (the source of this map is unknown).
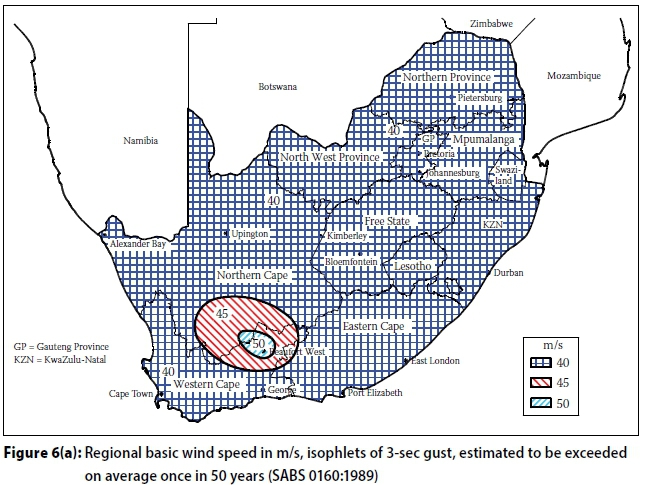
SABS 0160:1989
In the mid-1980s a South African Loading Code Committee was established to update the 1980 version of SABS 0160. A 1989 version was developed, which included maps of:
■ isophlets of the Regional Basic 3 s gust wind speed (at 10 m elevation, terrain category 2, to be exceeded once in 50 years), and
■ the maximum hourly wind speed in m/s for a 50-year return period.
These maps, presented in Figures 6(a) and 6(b) respectively, were developed on the basis of an extensive statistical analysis carried out by Milford (1986a, 1986b, 1987), based on the data of 15 South African Weather Bureau (SAWB) weather stations, with observation length varying between about 15 and 40 years. These maps provide a marked simplification of the basic wind speed, retaining only the prominent high wind speed region in the central Karoo. No differentiation between coastal to inland, winter to summer rainfall, or subtropical to semi-arid conditions are reflected within what can be regarded as an envelope wind speed of 40 m/s.
Spatial coverage
Of particular concern is that all wind design maps presented in Figures 2 to 6 were based on statistical analyses of data captured by a very limited number (less than 20) of SAWB anemometers. By comparison, similar maps were developed for the Netherlands and the UK using the data from more than 50 recording stations (Wieringa & Rijkoort 1983; BRE 1989). A graphic comparison of the areas of three countries and the number of recording stations are given in Figures 7(a) and 7(b). Integration of both distributions indicates a significant disparity between the spatial coverage of these countries.
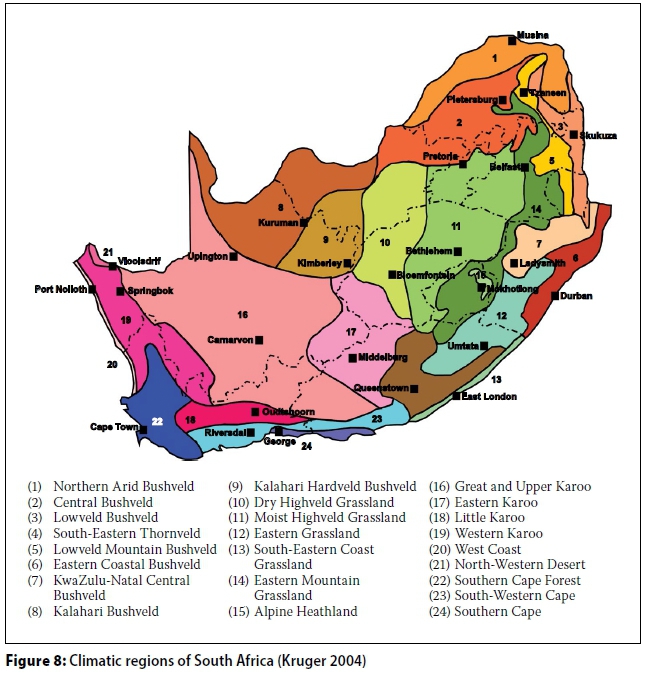
This issue becomes even more relevant when one considers the climatic diversity of South Africa compared to the above countries. The climates of the UK and Netherlands are fairly uniform, and the strong wind events are generated almost exclusively by synoptic-scale frontal systems. The climate in South Africa is much more complex and ranges from subtropical (Kwazulu-Natal) and mediterranean (south-western Cape) zones, to desert (Kalahari in the Northern Cape). The distribution of the diverse climatic zones in South Africa is presented in Figure 8 (Kruger 2004).
SANS 10160-3:2010
Considerations for using Eurocode EN 19911-4:2005 as reference for SANS 10160-3:2010 are reviewed by Goliger et al (2009a; 2009b). The Eurocode developers were facing a difficult task to provide a common framework for integrating a variety of national design standards of member countries, which included a large diversity of stipulations. It became a challenge to strike a balance between uniformity and consistency of the Eurocode and, on the other hand, to accommodate national specifics, expertise and engineering tradition. In order to cope with this situation, some of the principal stipulations were allocated the status of being non-negotiable, while nationally determined parameters were left to be decided at a national level by member countries, and incorporated into the respective national amendments or annexes.
The stipulation regarding the fundamental value of the basic wind speed, in terms of 10-min mean (measured at 10 metres elevation in open country terrain) was assigned a status of a non-negotiable clause. The selection of the averaging period was for the sake of compatibility with the design procedures that account for dynamic structural response in the Eurocode. This approach appears to be a reasonable compromise for the temperate European climate with synoptic wind storms caused by prevailing westerly wind systems, within which each country could provide for specific conditions.
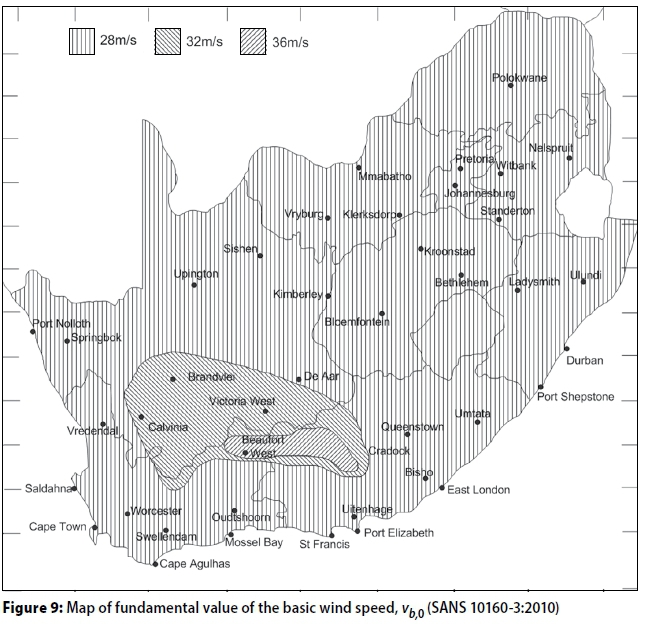
The South African code committee decided to adopt the 10-min mean principle for alignment purposes, although the proposed SANS 10160-3 did not include any dynamic procedures. An adherence to this stipulation created a substantial challenge in view of the diversity of the South African wind climate. A reanalysis of the full-scale data was not a feasible option, due to the inherent difficulty of adequate representation of wind speeds generated by localised short-duration thunderstorms. The revised map of the fundamental value of the basic wind speed expressed as the 10-min mean is presented in Figure 9.
This map was developed on the basis of the map included in the SABS 0160:1989 version of the code, and intuitively modified in consultation with the South African Weather Service (SAWS), by taking into account the topographical characteristics of the southern and southwestern Karoo, the directional prevalence of winter storms and the distribution of the climatic regions in South Africa (Kruger 2004). The South African climate (i.e. also the wind climate) is complex, in particular with regard to the dominance of frontal winds in coastal areas and intense thunderstorms in the interior. These two types of strong wind events cannot be fairly represented by a single value of mean wind speed in terms of 10-min averaging time. In order to overcome this problem an actual magnitude of wind speed of 28 m/s was obtained for coastal areas, based on a conversion factor between hourly and 10-min mean wind speeds (Goliger et al 2009b). Such a conversion is not applicable to inland regions of the country dominated by convective activities and, therefore, an effective speed of 28 m/s was adopted. A conversion factor of 1.4 was then introduced in the design procedure to bring the magnitude of the wind gust speed close to 40 m/s.
Updated map based on strong wind climate
With the introduction of automatic weather station technology to the SAWS observation network in the 1990s, the number of continuously recording wind measurement stations increased dramatically. As an appreciable number of the resultant data sets became sufficiently long for meaningful climatological analyses, it became imperative that updated design wind statistics be developed. The development process (which included updated data analysis methods, the consideration of the mixed strong wind climate of South Africa, and attention to the measurement environments), as well as its results, are discussed by Kruger et al (2013a & b).
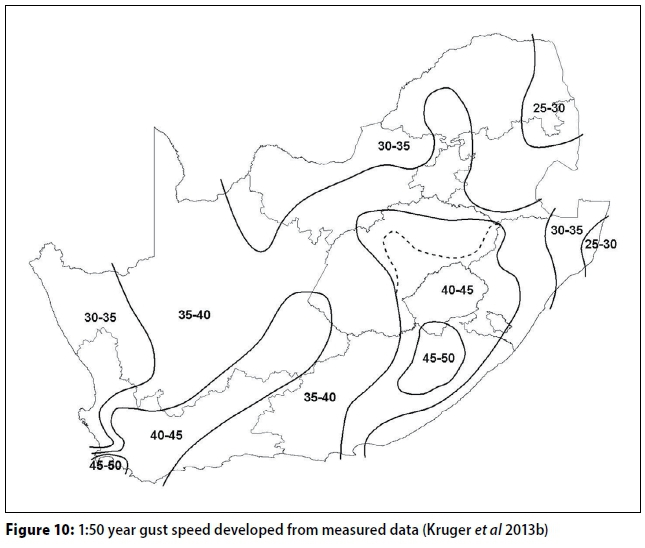
Figure 10 presents the 1:50 year gust map which resulted from this process. The number of weather stations which could be analysed increased about five-fold, reflected by the increased complexity of the map compared to earlier versions of gust maps presented in Figures 2, 3, 4(a) and 6(a). Whereas previously the major part of the country was assigned a single design gust speed of 40 m/s, Figure 10 indicates that the design speed varies in a spatially complex manner from about 25 m/s to above 45 m/s. Prominent features of this map range from the complex nature of the pattern around the southwestern extreme, two regions for wind speed above 40 m/s extending along a southwest to northeast axis in both cases, and relatively lower wind speeds for the northern parts of the country.
Trends in mapping the strong wind climate
From the early stages of the development of wind speed maps for wind load design, the main attributes to be accounted for were identified as: the use of observations to obtain annual extreme values; the statistical analysis of the data to derive 1:50 year values; geographic differentiation; design procedures based on gust wind speed, whilst accounting for typically hourly mean wind speed; wind speed statistics accounting for both the 1:50 year or characteristic values; and the reliability-based partial wind load factor. The main advances represented by the procedures and maps reviewed above are as follows: as early as 1952 wind load design provided for wind speed based on observation of hourly mean wind, converted to gust speed; differentiating furthermore between inland regions and a 16 km wide coastal strip.
The statistical analysis employed by May (1972) to derive 1:50 year for the major centres of the country was followed by an elaboration of the geographic distribution of wind speed by Louw and Katsiambirtas (year unknown). A similar but simplified map was used for the 1980 design standard, with a separate map for the hourly mean wind speed. Extensive wind speed probability modelling was used by Milford (1987) for the dual assessment of the regional basic wind speed and wind load partial factor (Kemp et al 1987). Refined mapping of the 1:50 year gust wind speed and associated probability models for wind speed across the country was reported by Kruger et al (2013a & b). Separate mapping of the 1:50 year hourly mean wind speed was maintained since its inclusion in SABS 0160:1980.
Assessment of design implications
The implementation of the latest results in characteristic gust wind speed as basic free field wind speed map (vb,0), and the associated extreme value probability models used for the mapping, need to be assessed against the context of referencing SANS 10160-3 to Eurocode EN 1991-1-4 (Goliger et al 2009a & b; Retief & Dunaiski 2009).
The direct expression of vb,0as gust wind speed fully accounts for the mixed South African strong wind climate consisting of both synoptic and convective wind storms. The adjusted Eurocode procedure based on a 10-min mean wind speed and a gust factor can then be replaced by the direct calculation using the mapped gust wind speed. This procedure will be consistent with the scope of static equivalent wind loading provided for in SANS 10160-3.
For various reasons the map of vb,0shown in Figure 10 is not appropriate to be implemented directly in the design procedures - as the map incorporates a degree of interpretation and smoothing of the underlying information on which it is based, it should be considered to be indicative at best. Furthermore, the geographical representation of vb,0should be presented in an unambiguous format for operational design. The conversion of the information provided by Figure 10 into standardised values of vb,0 is provided by Kruger et al (2017).
RELIABILITY BASIS FOR WIND LOAD
The representation of characteristic wind speed as the fundamental value of the basic wind speed vb,0for structural design should be seen in the context of the reliability basis for wind load, as derived from the probability model for the annual maximum wind speed (V). The characteristic wind speed (vk)provides the input to determine the characteristic wind load Qw,k.
The selection of appropriate extreme value probability functions for V is extensively discussed by Kruger et al (2013a). However, the Gumbel distribution provides a convenient approximation to represent the annual maximum wind speed V, as given by Equation 3 in terms of y = (v - ßV)/αVwhere αVis the dispersion parameter and ßVthe mode of the distribution (Holický 2009):
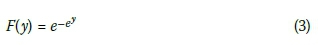
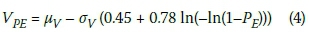
Furthermore, the distribution parameters can be obtained from the mean (μV)and standard deviation (σV) of V as α= 0.78 σVand ßy = μV- 0.577 α. The inverse expression gives the wind speed VPEas a function of the exceedance probability PEas:
Characteristic wind speed
The characteristic wind speed (vk) is stipulated as the 2% fractile (or 1:50 year value), which can be interpreted as the expected maximum (mean) wind speed over a 50-year reference period, where the reference period may be related to the design service life for 'normal' structures. Accordingly, the characteristic wind speed can be derived from Equation 4 as:
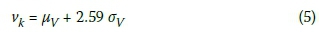
The characteristic wind speed is therefore significantly higher than the mean annual extreme wind and quite sensitive to the standard deviation, as determined from extreme wind statistics.
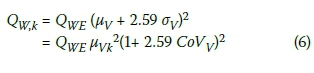
The wind load QWcan be expressed as the product of v2 and the conversion factor Qwethat provides for the wind engineering procedures, such as the wind speed profile and pressure coefficients. The characteristic wind load is then given by Equation 4, where CoV is the coefficient of variation (σV/μV):
Design wind load
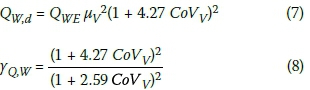
The design wind load can be obtained by determining the wind speed according to Equation 4 for an exceedance probability (PF)that corresponds with the appropriate target reliability (ßT), with the equivalence given by the relationship PF= Φ(-ß), where Φ is the cumulative normal distribution function. The target reliability for a 50-year reference period is selected as ßT= 3.0 for SANS 10160 (Retief & Dunaiski 2009). Since the probability model for wind speed is given by Equation 3 for an annual reference period, either the wind load model should be adjusted to a 50-year reference period, or the target reliability should be adjusted to an annual reference period. The former process was followed by Retief et al (2013) to obtain suitable wind load models.
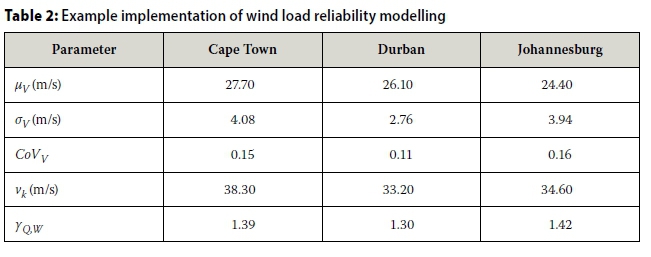
Based on the relationship between annual and 50-year exceedance probabilities, it can be shown that ßT.1= 4.0 for a one-year reference period is equivalent to ßT.50 = 3.0 for 50 years. Furthermore, using the sensitivity factor αe= 0.7 to obtain the target reliability for actions as ßT.1.E= 0. x 4.0 = 2.8, the exceedance probability for the design wind load can be obtained as 2.4 x 10⁻³. The expression for the design wind load is then given by Equation 7. From Equations 6 and 7, Equation 8 provides an expression for partial wind load factor (γq,w) simply as the ratio QW,d/QW,k(see Equation 2).
An example of the implementation of Equation 8 is provided in Table 2 for the three major metropolitan centres of the country, based on data obtained from Kruger et al (2013a). The example demonstrates how the two reliability-based design parameters {vk; γq,w} are related to the probability model for the annual extreme wind speed (V).
The reliability modelling does not include the uncertainties of the time-invariant wind engineering modelling regarding the conversion of the free field wind pressure and the load, as distributed across the structure. Both the uncertainties and the bias of the design procedures have a significant influence on the calibration of γq,w(Retief & Dunaiski 2009). Recent investigations include the reliability assessment of extreme value models for y and determining uncertainties of time in variant wind engineering models for converting the free field wind into loads, integral reliability modelling and assessment of wind loading (Botha et al 2014, 2015, 2016; Botha 2016).
CONCLUSIONS
Steady progress in accounting for the strong wind climate, based on observations and probability modelling to derive pre-specified characteristic wind speed values as input to wind load design procedures, is recorded in this review. With the introduction of reliability-based design for SABS 0160:1989, probability models for wind speed are also incorporated in the calibration of the partial wind load factor (Kemp et al 1987; Milford 1987).
Insufficient updated information on probability models for wind speed was, however, available for incorporation into the latest standard for wind loading SANS 10160-3:2010.
Whilst the new standard introduced an extensive advancement of wind loading design procedures, only nominal adjustment of the basic wind speed and reliability provisions limited the degree to which provision could be made to South African conditions (Goliger et al 2009a & b; Retief & Dunaiski 2009).
Subsequent investigations of the South African strong wind climate, as represented by Figure 10 (Kruger et al 2013b), provide a sound basis for updating the provisions for the geographic distribution of the basic free field wind speed. Recent information on reliability modelling of wind loading, based on the updated probability models for extreme wind and the design procedures used by SANS 10160-3:2010, provides an opportunity to reassess the design provisions (Botha 2016). The concurrent implementation of a revised map of vb,0 and partial wind load factor γq,win SANS 10160-3 is presently in progress.
REFERENCES
Botha, J, Retief, J V, Holický, M & Barnardo-Viljoen, C 2014. Development of probabilistic wind load model for South Africa. Proceedings, Conference of the Italian Association for Wind Engineering IN-VENTO 2014 XIII, 22-25 June, Genoa, Italy. [ Links ]
Botha, J, Retief, J V & Viljoen, C 2015.Variability of time independent wind load components. Proceedings, 12th Internationa l Conference on Applications of Statistics and Probability in Civil Engineering, ICASP12, Vancouver, Canada, July 2015. [ Links ]
Botha, J, Retief, J V & Viljoen, C 2016. Application of the Monte Carlo method for the reliability treatment of wind load variables using Bayesian hierarchical models. Proceedings, 6th International Conference on Structural Engineering, Mechanics and Computation, SEMC 2016, 5-7 September, Cape Town. [ Links ]
Botha, J 2016. Probabilistic models of design wind loads in South Africa. PhD Thesis. Stellenbosch University. [ Links ]
BSI (British Standards Institution) 1952. CP3: Chapter V, Part 2: Code of Basic Data for the Design of Buildings. London: BSI. [ Links ]
BRE (Building Research Establishment) 1989. The assessment of wind loads. Part 3: Wind climate in the United Kingdom. BRE Digest 346, London: BRE. [ Links ]
EN (European Standard) 1991. 1991-1-4:2005. Eurocode 1: Actions on Structures. Part 1-4: General Actions - Wind Actions. Brussels: European Committee for Standardization (CEN). [ Links ]
Goliger, A M 1999. Wind loading specifications in the SA loading code. Civil Engineering, 7(4): 19-21. [ Links ]
Goliger, A M 2007. South African wind loading specifications: The Euro-way? Journal of Wind Engineering and Industrial Aerodynamics, 95: 9-11. [ Links ]
Goliger, A M 2016. Wind engineering science and its role in optimizing the design of the built environment. DEng Thesis. Stellenbosch University. Available at: http://www.scholar.sun.ac.za/handle/10019.1/98799. [ Links ]
Goliger, A M, Milford, R V & Mahachi, J 2001. Proposed wind loading specifications of the SABS 0160. Proceedings, International Conference on Structural Engineering, Mechanics and Computation, Cape Town, 2-4 April, Vol. 2, 1305-1312. [ Links ]
Goliger, A M, Niemann, H-J & Milford, R V 1998. Assessment of wind-load specifications of the SABS 0160:1989. Proceedings, SAICE Loading Conference, 9-10 September, Johannesburg. [ Links ]
Goliger, A M, Retief, J V & Dunaiski, P E 2009a. Review of codification of wind-loading for structural design. Chapter 3-1 in Retief J V & Dunaiski P E (Eds.) 2009. Background to SANS 10160. Stellenbosch: SUN MeDIA. [ Links ]
Goliger, A M, Retief, J V Dunaiski, P E & Kruger, A C 2009b. Revised wind-loading design procedures for SANS 10160. Chapter 3-2 in Retief, J V, Dunaiski, P E (Eds.). Background to SANS 10160. Stellenbosch: SUN MeDIA. [ Links ]
Hansen, S O 2013. Wind loading design codes. Proceedings, 6th European-African Conference on Wind Engineering, Cambridge, UK, 7-11 July 2013. [ Links ]
Holický, M 2009. Reliability Analysis for Structural Design. Stellenbosch: SUN MeDIA. [ Links ]
Holmes, J D 2001. Wind Loading of Structures. London: Spon Press. [ Links ]
Kemp, A R, Milford, R V & Laurie, J A P 1987. Proposals for a comprehensive limit states formulation for South African structural codes. The Civil Engineer in South Africa, 29 (9): 351-360. [ Links ]
Kruger, A C 2004. Climate of South Africa. Climate Regions. Report WS45. Pretoria: South African Weather Service. [ Links ]
Kruger, A C 2011. Wind climatology of South Africa relevant to the design of the built environment. PhD Thesis, Stellenbosch University. Available at: http://www.hdl.handle.net/10019.1/6847. [ Links ]
Kruger, A C, Goliger, A M, Retief, J V & Sekele, S 2010. Strong wind climatic zones in South Africa. Wind and Structures, 13(1): 37-55. [ Links ]
Kruger, A C, Goliger, A M, Retief, J V & Sekele, SS 2012. Clustering of extreme winds in the mixed climate of South Africa. Wind & Structures, 15(2): 87-109. [ Links ]
Kruger, A C, Retief J V & Goliger A M 2013a. Strong winds in South Africa: Part I: Application of estimation methods. Journal of the South African Institution of Civil Engineering, 55(2): 29-45. [ Links ]
Kruger, A C, Retief, J V & Goliger, A M 2013b. Strong winds in South Africa. Part II: Mapping of updated statistics. Journal of the South African Institution of Civil Engineering, 55(2): 46-58. [ Links ]
Kruger, A C, Retief, J V & Goliger, A M 2017. Development of an updated fundamental basic wind speed map for SANS 10160-3. Journal of the South African Institution of Civil Engineering, 59(4): 12-25. [ Links ]
Louw, W J & Kastiambirtas, E No date. The estimation of extreme wind gusts from inadequate data. Obtained from the Meteorology Institute of München University (UDC 551.553.6(68)). [ Links ]
May, H I 1972. Some wind speed data for estimating loads on structures in South Africa. The Civil Engineer in South Africa, 14(5): 175-180. [ Links ]
Milford, R V 1986a. Extreme-value analysis of South African mean hourly wind speed data. Unpublished Internal Report 85/1, Structural and Geotechnical Engineering Division, National Building Research Institute, CSIR, Pretoria. [ Links ]
Milford, R V 1986b. Extreme value analysis of South African gust speed data. Unpublished Internal Report 85/4, Structural and Geotechnical Engineering Division, National Building Research Institute, CSIR, Pretoria. [ Links ]
Milford, RV 1987. Annual maximum wind speeds for South Africa. The Civil Engineer in South Africa, 29(8): 5-15. [ Links ]
Retief, J V & Dunaiski, P E 2009. The limit states basis of structural design for SANS 10160-1. Chapter 1-2 in Retief, J V & Dunaiski, P E (Eds.). Background to SANS 10160. Stellenbosch: SUN MeDIA. [ Links ]
Retief, J V, Barnardo-Viljoen, C & Holický, M 2013. Probabilistic models for the design of structures against wind loads, Proceedings, 5th International Conference on Structural Engineering, Mechanics and Computation, SEMC 2013, 2-4 September 2013, Cape Town. [ Links ]
Retief, J V, Dunaiski, P E & Day, P W 2009. An overview of the revision of the South African Loading Code SANS 10160. In Retief, J V & Dunaiski, P E (Eds.). Background to SANS 10160. Stellenbosch: SUN MeDIA, 1-24. [ Links ]
SABS 024:1952. Comprehensive Model Building Regulations. Chapter 3: Loads. A Guide to Building By-Laws for Local Authorities. Pretoria: South African Bureau of Standards. [ Links ]
SABS 0160:1980. The General Procedures and Loadings to be Adopted for the Design of Buildings. Pretoria: South African Bureau of Standards. [ Links ]
SABS 0160:1989. The General Procedures and Loadings to be Adopted in the Design of Buildings. Pretoria: South African Bureau of Standards. [ Links ]
SANS (South African National Standard) 2010. SANS 10160-3:2010. Basis of Structural Design and Actions for Buildings and Industrial Structures. Part 3: Wind Actions. Pretoria: SABS Standards Division. [ Links ]
SAWB (South African Weather Bureau) 1949. Oppervlakwinde in Suid-Afrika. Surface winds of South Africa. Report WB8. Pretoria: South African Weather Bureau. [ Links ]
TMH7 1981. Code of Practice for the Design of Highway Bridges and Culverts in South Africa. Parts 1 & 2. (Revised 1988). Pretoria: Committee of State Road Authorities, Department of Transport. [ Links ]
Wieringa, J & Rijkoort, P J 1983. Windklimaat van Nederland. Den Haag: Staatsjuitgeverij. [ Links ]
 Correspondence:
A M Goliger
Council for Scientific and Industrial Research (CSIR)
T: +27 83 660 8205
E: adam.goliger@gmail.com
J V Retief
Department of Civil Engineering
Stellenbosch University
Private Bag X1, Matieland, Stellenbosch 7602, South Africa
T: +27 21 808 4442
E: jvr@sun.ac.za
A C Kruger
Chief Scientist Department of Geography
Climate Data Analysis & Research Geoinformatics and Meteorology
Department: Climate Service University of Pretoria
South African Weather Service Pretoria 0002
Private Bag X097, Pretoria 0001 South Africa
South Africa
T: +27 12 367 6074
E: andries.kruger@weathersa.co.za

DR ADAM GOLIGER obtained his MSc degree from the Warsaw Technical University, and his PhD and DEng degrees from Stellenbosch University, all in Structural Engineering. Until 2016 (for more than 30 years) he was involved in research and consulting work at the CSIR (Council for Scientific and Industrial Research). This included wind-tunnel simulation and modelling techniques, wind damage and environmental studies around buildings. For several years he served as the South African representative on the International Association for Wind Engineering (IAWE), and participated in various local and international committees and research panels. He is the author or co-author of more than 100 scientific publications and numerous technical reports.

PROF JOHAN RETIEF, who is a Fellow of the South African Institution of Civil Engineering, is Emeritus Professor in Civil Engineering at Stellenbosch University. His field of interest is the development of risk and reliability as the basis of design for structures, with specific applications to wind loading, structural concrete and geotechnical practice, amongst related topics. He is a member of SABS TC98 Structural and geotechnical design standards, and is the national representative to ISO TC98 Bases of design and actions on structures, and a member of various Working Groups of these TCs (technical committees). He holds degrees from Pretoria University, Imperial College, Stanford University and Stellenbosch University.

DR ANDRIES KRUGER obtained his MSc degree from the University of Cape Town in the Geographical and Environmental Sciences, and his PhD from the University of Stellenbosch in Civil Engineering, with the research topic Wind Climatology and Statistics of South Africa relevant to the Design of the Built Environment. Since 1985 he has been involved in the observation, analysis and research of historical climate at the South African Weather Service. This has included climate change and variability research, the authoring of general climate publications, and other climatological studies through consultation. He is the author or co-author of a substantial number of scientific publications.

