


Serviços Personalizados
Artigo
 Inglês (pdf)
 Artigo em XML
 Referências do artigo
Indicadores

Links relacionados
-
 Citado por Google
 -
 Similares em Google
Compartilhar

 Permalink
Journal of the South African Institution of Civil Engineering
versão On-line ISSN 2309-8775
versão impressa ISSN 1021-2019
J. S. Afr. Inst. Civ. Eng. vol.59 no.3 Midrand Set. 2017
http://dx.doi.org/10.17159/2309-8775/2017/v59n3a7
TECHNICAL PAPER
Soft water attack on concrete tunnel linings in the Ingula pumped storage hydro-power scheme: Assessment of concrete resistance and protection
M Otieno; M Alexander; J du Plessis
ABSTRACT
The resistance of the concrete tunnel linings at the Ingula Pumped Storage Scheme (IPSS) to soft water attack was investigated. Concrete disc specimens obtained from cores taken from selected locations of the tunnel lining were exposed to a simulated soft water attack testing regime in a site laboratory using the actual (soft) water to which the tunnel linings will be exposed when in service. The assessment was carried out for around four months. The aggressivity of the soft water was quantified using Basson Indices. The results showed that the water is readily aggressive and will lead to corrosion of the concrete tunnel lining. The experimental work showed the average surface rate loss of the linings to be approximately 1.1 mm/a, which, if sustained in the concrete linings, would amount to an average loss of about 10 mm in a 10-year period. This will result in increased surface roughness and hence higher head losses due to increased friction coefficients. It was recommended that a protective epoxy coating be applied on the tunnel lining to limit the reduction in power generation efficiencies.
Keywords: soft water attack, Ingula, hydro-electricity, durability, service life
INTRODUCTION
In the recent past, the South African government has invested heavily in a number of power generation projects to augment existing ones. This huge economic investment is mainly driven by the increasing electricity demand from both the growing South African population and the projected economic growth, which will demand a steady and sustainable supply of electricity if the country is to meet its millennium development goals. Currently, South Africa relies mainly on coal-fired (> 90%) electricity generating plants as the source of its industrial and domestic electricity. Other electricity sources include gas-turbine, hydro, wind, nuclear and solar, among others (www.energy.gov.za). Substantial progress has been made in recent years in the roll-out of major wind and solar power generating facilities, and there are plans to expand the nuclear power generation capacity in the future. A number of new coal and hydro-powered electricity generation plants are also currently under construction, with some partly completed. This paper focuses on the new Ingula Hydroelectric Pumped Storage Scheme (IPSS).
A critical aspect of new (and existing) concrete structures is their durability, which is fundamentally affected by the interaction between the concrete structure (quality) and its exposure environment (aggressivity). Ultimately, lack of durability results not only in a reduction in the service life of the concrete structure, but also in increased expenditure of resources (both human and monetary) to restore the structure to the desired serviceability (or functional) and structural health states. The risk of durability failure is quite high for major infrastructural developments, such as electrical power plants. Therefore engineers and asset owners should be cognisant of this, and put measures in place to avoid its occurrence. These measures should be considered at the design and construction stages, and also during the service life of the structure through planned maintenance. In the case of the IPSS, this paper focuses on the durability (or resistance) of the concrete tunnel linings with respect to soft water attack to which it will be exposed when in service.
Soft waters occur naturally in springs emanating from igneous or acid rock formations in mountainous areas, or in lowland streams or rivers which have not passed through calcareous strata, and are aggressive to concrete primarily because of their 'ion hungry' nature. They are characterised by their low dissolved ion content. When Portland cement-based concrete is in contact with soft water, the Ca(OH)2in the hardened cement paste is leached out as the water tries to establish an ion balance. The rate of Ca(OH)2 removal is determined by the difference in concentrations of calcium compounds between the concrete and water phases. The aggressiveness of soft water, measured as the rate at which Ca(OH)2 is leached from the cement paste, is considerably increased if the water contains dissolved carbonic acid due to the presence of aggressive CO2, i.e. the dissolved CO2 beyond that required for bicarbonate equilibrium. Other deleterious ions in water with respect to concrete deterioration include magnesium ions, ammonium ions and sulphate ions (Ballim et al 2009).
Specific to the IPSS, in addition to the deterioration of the concrete lining due to soft water attack affecting the service life of the structure, it would also have negative effects on the efficiency of electricity power generation by increasing the surface roughness of the concrete tunnel lining, and hence causing higher friction losses. Ultimately, the results of the investigations would inform a decision on whether to provide a protective coating on the concrete tunnel lining or not.
A condensed version of this paper was originally published in the proceedings of the 2016 Hydropower and Dams Conference (Otieno et al 2016). This paper presents additional information by way of comprehensive results and analyses of the results.
BACKGROUND ON INGULA PUMPED STORAGE SCHEME (IPSS)1
General description
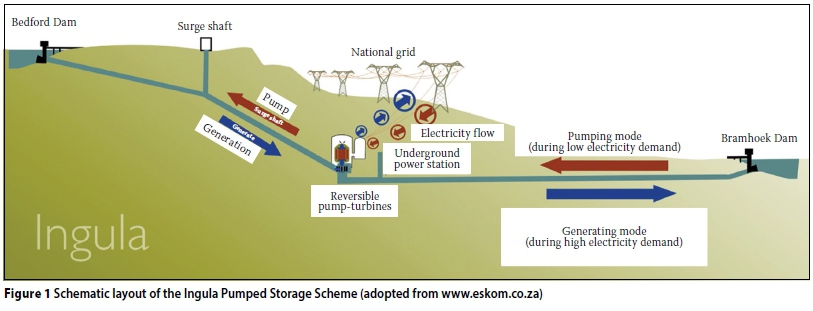
The IPSS is a hydropower station comprising a concrete-faced upper rockfill dam (Bedford Dam) and a roller-compacted concrete lower dam (Bramhoek Dam), separated in elevation by 480 m; an underground power house complex located 350 m underground in two excavated underground caverns housing 4 × 333 MW reversible Francis-type pump-turbine and motor-generator units that generate electricity at a rated head of 441 m; and an underground labyrinth of inter-connecting tunnels/waterways that extend 16.5 km, and together with a number of shafts, allow water to be released from the upper reservoir and delivered to the turbines producing power, before being captured in the lower reservoir. During off-peak power periods, the turbine rotational directions are reversed, pumping water back to be ready for the next peak power event. Figure 1 shows a schematic layout of the IPSS. Construction of the IPSS was essentially complete by the end of 2016, with all four units synchronised to the national power grid and handed over for commercial operation.
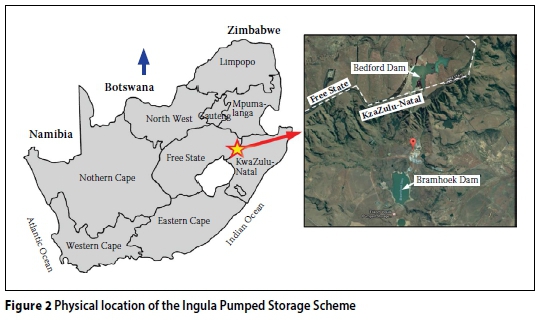
Physical location
The IPSS is located about 23 km northeast of Van Reenen within the Little Drakensberg mountain range of South Africa (S28° 16' 54", E29° 35' 08"). The upper reservoir site is located in the Free State Province and the lower reservoir in KwaZulu-Natal Province. The escarpment forms the border between these provinces (see Figure 2).
Power generation capacity
The rated electricity generating capacity is 1 332 MW and the energy storage capacity is 21 000 MWh (15.8 generating hours). In addition to the normal generating capacity, a minimum emergency full-load generating reserve of four hours is maintained in the upper reservoir throughout the normal weekly operating cycle.
Concrete tunnel lining
The concrete-lined sections of the headrace tunnels are each approximately 1.0 km in length with 6.6 m internal diameters, while the tailrace tunnel is approximately 2.5 km long with a 9.4 m internal diameter. The concrete mix used for the tunnel lining comprised CEM II/A-M (V-L) 42.5N (345 kg/m3), fly ash (60 kg/m3), 19 mm dolerite stone (880 kg/m3), 4.75 mm dolerite sand (155 kg/m3), 2.36 mm dolerite sand (905 kg/m3) and water (180 kg/m3). Superplasticiser (0.9% by mass of total binder) was used. Slumps of 200 mm were typically measured on the concrete. The concrete was predominantly placed on the outside of full-round collapsible steel shutters erected inside shotcrete/rockbolt supported tunnels. Plate and poker vibrators were used to consolidate concrete and, importantly, a controlled permeability formwork liner was applied to the shutter below the tunnel spring line to alleviate concrete blowhole formation. From a construction programming point of view, it was important to achieve high early-age compressive strengths to allow collapsing of the shutter, in preparation for the next section's concrete placement as soon as possible. Concrete compressive strengths of around 1.0 MPa were achieved eight hours after placement, and the consequential effect of this was that it was not uncommon to achieve 28-day compressive strengths of > 60 MPa.
ASSESSMENT OF SOFT WATER ATTACK OF CONCRETE TUNNEL LINING
The experimental programme was carried out in two stages. In the first stage, the aggressiveness of the soft waters to which the concrete tunnel lining will be exposed when in service was assessed. In the second stage, the resistance of the concrete tunnel lining to deterioration by the soft waters was assessed.
Quantification of the aggressiveness of the (natural and laboratory) soft waters
Water samples were collected from selected sources on site and assessed for aggressivity with respect to soft water attack. The water used in the laboratory during the testing was collected from the natural water sources. It was therefore important to ascertain that the water used in the laboratory closely simulated the natural waters. The aggressivity of the waters was quantified using corrosion indices, popularly known as Basson Indices, proposed by Basson (Basson & Ballim 1994), typically the leaching corrosion sub-index (LCSI) which was corrected for 'turbulence' and 'temperature' to give an overall Aggressivity Index (AI). The interpretation of the AI is given in Table 1. Typical values of selected salient properties of the aggressive waters over a number of years are presented in Table 2.
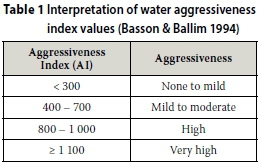
Based on the results in Table 2, it was clear that the concrete tunnel lining will be exposed to waters with high (800-1 000) to very high (> 1 100) aggressiveness. Closer examination of the results shows that the aggressiveness of the waters in the initial measurements in 2005-2006 indicates much more aggressive conditions than the 2014 values. The reasons for this relate to the sampling sources of waters taken for analysis: in 2005-2006 these were the natural streams, while in 2014 they were the Devil's Culvert Stream, and the Bedford and Bramhoek dams. Note that if the in-situ-measured temperature of 12.5°C for the natural waters was used to correct all the LCSI values, the 2014 results for composite (various sources), Devil's Culvert, and lab test bath mean, all show sensibly the same overall Aggressiveness Index of approximately 800-900. However, in this case, the Lab Test Bath mean was corrected using a higher mean laboratory-measured temperature of 17°C, hence the higher LCSI value of 1 130 (up from 831 if 12.5°C is used). This illustrates the influence temperature has on the aggressivity of the water, and hence on the rate of corrosion of the concrete, especially in warmer seasons. In general, the aggressivity of the test bath water (i.e. AI = 1 130) lies in the range of aggressivity of the natural waters (i.e. ~ 800 > AI > ~1 400). The general conclusion from Table 2 and the analyses of water aggressivity is that the test bath waters are appropriately aggressive and mimic the site waters adequately.
Based on the AI values presented in Table 2, it was concluded that the water used in the laboratory - which was stirred by the circulation provided by a small water pump (see next section) as opposed to the flowing natural waters - mimicked the aggressiveness of the natural waters adequately. The (laboratory) water in the baths was replenished from time to time, i.e. approximately every 24 hours using water from Devil's Culvert Stream (up to day 27) and Bramhoek Dam (up to end of testing), to ensure its aggressivity was maintained. Various water quality properties were measured frequently to quantify the aggressivity of the water and hence give guidance as to when to replenish the water.
Testing approach to assess concrete resistance to soft water attack
The results in Table 2 showed that these waters had different aggressiveness indices ranging from 818 (high) to 1 381 (very high) for Devil's Culvert Stream and Bramhoek Dam respectively. It is not clear why the change in the source of aggressive water was made, but the implication of this will be assessed in the results presented later in the paper.
To assess the resistance of the concrete tunnel lining to deterioration by the aggressive water, 68 ± 2 mm diameter cores were taken from the lining at various locations and exposed to the aggressive water in the site laboratory. The cores were drilled when the lining was already several months old, and hence the concrete was already well hydrated and mature. The specimens (50 in total) were categorised into three groups based on the location of cores in the tunnel sections - (i) invert (20 specimens), (ii) side of tunnel (21 specimens) and (iii) tunnel crown (9 specimens). The objective of this was to determine whether location of concrete in the tunnel had any influence on the durability of the concrete, taking into account the different placement, compaction and finishing techniques used in the locations.
Prior to exposing the cored concrete samples to the aggressive water in the laboratory, water sorptivity testing was carried out on them. During testing, the porosity and density of the samples were also determined. Density was determined using the displacement method. The water sorptivity tests were carried out with slight modifications to the testing procedure given in the 2010 Durability Index Testing Manual (DI-Manual 2010). The modifications included the following: a. Tap water was used instead of saturated Ca(OH)2 solution to ensure that the pH of the aggressive water was not significantly altered when the specimens were submerged in the aggressive water after the sorptivity testing. The pH of the aggressive water was an important parameter - the lower the pH, the higher the aggressivity.
b. The frequency of mass gain measurements was increased (especially at the beginning of the testing) from the recommended 0, 3, 5, 7, 9, 12, 16, 20 and 25 minutes to 0, 1, 2, 3, 5, 7, 9, 12, 16, 20, 25, 60, 180 and 240 minutes to assess the quality of the thin surface layer on the specimens which would be exposed to the aggressive water immediately on exposure when in service. The increased frequency also enabled estimation of the thickness of the laitance layer in the specimens. Two types of specimens were used in the tests - partially epoxy-coated and fully epoxy-coated specimens as described below:
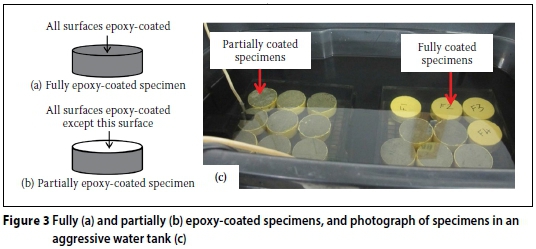
■ Partially coated specimens: After sorptivity testing, the insulation tape used to seal the circumferential surfaces of the specimens was removed and the specimens oven-dried at 50 ± 5°C for 24 hours before being partially coated with epoxy as shown in Figure 3(b). The coating was done on all surfaces except on one circular cross-section (originally exposed tunnel surface). The non-coated surface was exposed to the aggressive water. Before exposure to the aggressive water in the laboratory, the epoxy-coated specimens were pre-saturated in tap water for 24 hours. Additional partially coated specimens were later added to the sample without undergoing the water sorptivity index testing.
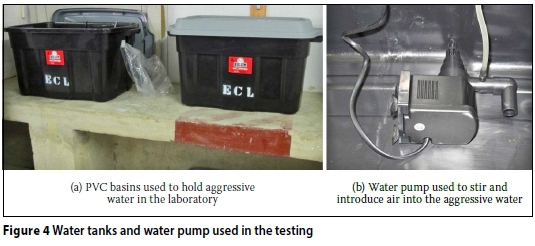
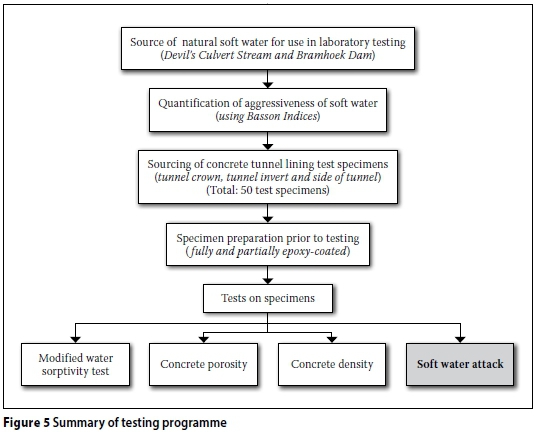
■ Fully coated specimens: These specimens were also obtained from various locations of the tunnel, but were not subjected to water sorptivity and porosity testing before being epoxy-coated. All the surfaces were epoxy-coated (see Figure 3(a)). Before coating, some of these specimens were oven-dried at 100 ± 5°C for 24 hours while some were air-dried for seven days before coating with epoxy. These deviations in specimen preparation between the two types of specimens (partially and fully coated) were later noted to have a detrimental effect on the mass gain measurements, and will be discussed later in this paper. The fully coated specimens were used to monitor any absorption of water by the epoxy, thereby allowing corrections to the mass measurements of the partially coated samples. If not corrected, this would lead to incorrect inferences of mass gain/loss in the partially coated specimens. Both the partially and fully coated specimens (Figure 3(c)) were placed in small PVC 80-litre tanks (Figure 4(a)) such that approximately 0.28 litres of the aggressive water were provided per disc specimen. The specimens were submerged in the aggressive water stacked in meshed plastic racks placed in the tanks. It was ensured that the exposed surfaces of the partially coated specimens were easily in contact with the aggressive water. A small water pump (Figure 4(b)) was submerged in the aggressive water in the PVC tanks to ensure that the aggressive water was continuously stirred and did not remain stagnant. In the process, the water pump also introduced air into the water, hence aiding in maintaining its pH. Figure 5 presents a summary of the testing programme used.
Monitoring the aggressiveness of the water and mass loss/gain in the specimens
The pH, conductivity and temperature of the aggressive water in the tanks were monitored daily to ensure that the water remained sufficiently aggressive. Initially, it was intended that the pH and conductivity of the aggressive water be controlled within ± 0.1 and 10% respectively. However, this proved unfeasible, based on the initial results of this monitoring, and the aggressive water was thereafter replenished daily. The tanks in which the specimens were submerged were placed in a controlled temperature environment of between 16 and 18°C in the laboratory.
Saturated surface dry mass loss/gain measurements for both the partially and fully coated specimens were taken concurrently. The measurements were taken on a daily basis, but the frequency was adjusted from time to time to suit availability of laboratory personnel. Prior to taking mass measurements in the partially coated specimens, the exposed surfaces were hand-brushed with a soft nylon bristle brush to remove loose corrosion products. Each specimen was subjected to ten up-and-down strokes of brushing carried out under flowing tap water. During this process, care was taken not to unnecessarily dislodge small aggregate particles.
RESULTS AND DISCUSSION
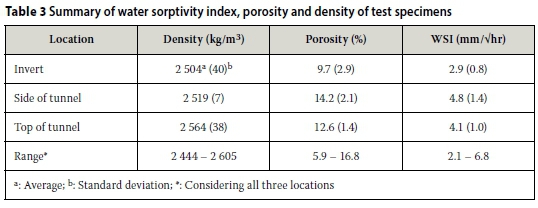
A summary of the water sorptivity index, porosity and density results for specimens from the various tunnel locations is presented in Table 3. These results are discussed in the following sections.
Water sorptivity index (WSI) vs porosity
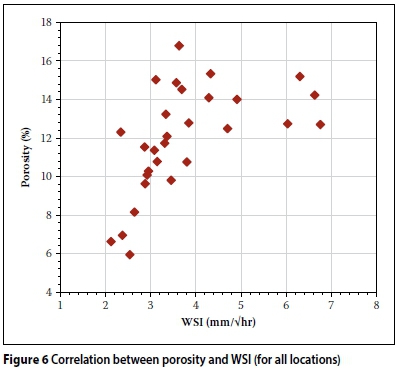
The WSI values ranged between 2.1 and 6.8 mm/Vhr, which are low values, indicating that the concrete is of good quality, if a little variable, with respect to water absorption. Initially, the low WSI values were suspected to correspond to the occasionally high porosity values (ranging between 5.9 and 16.8%) of the concretes. However, this was not the general case - see Figure 6 where the results showed only a slight correlation between porosity and WSI - with WSI increasing as porosity increases, for porosity and WSI values between, respectively, ~ 5 and ~ 15%, and ~ 2 and ~ 4 mm/Vhr. This trend was difficult to explain and required further assessment (e.g. microscopic inspection) of the concretes to be carried out. However, this was outside the scope of this investigation. Nevertheless, these results show that it is important to try and interpret, or at least report, WSI test results together with the corresponding porosity results.
Density vs porosity
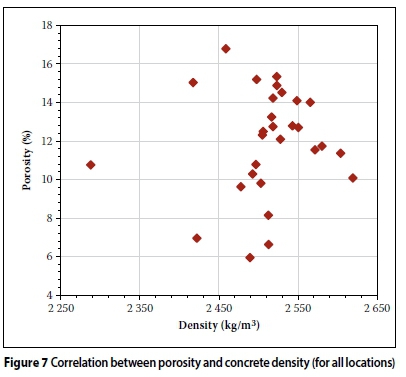
The concrete density ranges between 2 444 and 2 605 kg/m3. Such high density values were somewhat unexpected considering the high porosity values (up to 16.8% for individual specimens). However, no general trend was observed between concrete density and porosity (see Figure 7). The high concrete density values are related to the dolerite aggregates used to make the concrete; dolerites from the KwaZulu-Natal region typically have relative densities of ~ 2.90.
Variation of WSI and porosity with specimen location in the tunnel
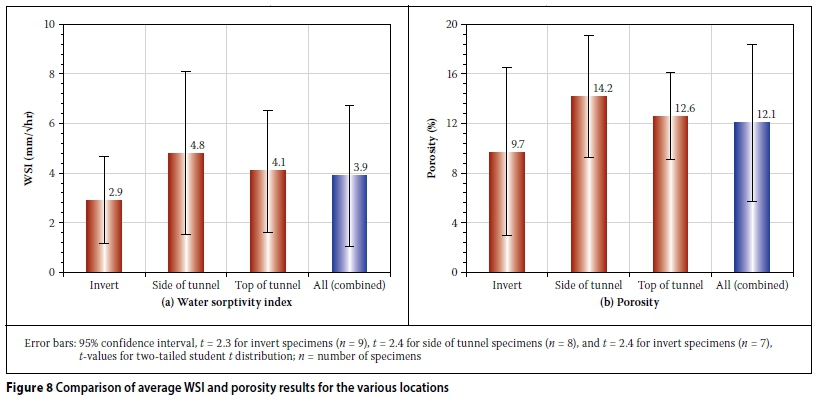
A comparison of the average WSI and porosity results for the various locations (invert, crown and side of tunnel) is presented in Figures 8(a) and (b), which also includes the combined average WSI and porosity values for the three locations. These results show that the specimens obtained from the invert are of a relatively better quality compared to those from the side and top of the tunnel. Concretes from the side and top of the tunnel show similar quality with respect to the WSI and porosity results.
It is important to note that even though WSI, porosity and density results show relatively good quality concrete, a direct correlation cannot be made between these results and the resistance of the concrete to deterioration by the aggressive water. This is better assessed using mass loss test results that are presented in the following section.
However, it was important to measure these properties as quality benchmarks, and also so that any subsequent work can be related to the present work.
Concrete deterioration (mass loss/gain) results
Figure 9 shows the average cumulative mass gain/loss in the fully coated specimens. The confidence bands in the figures presented in this section are based on a 95% confidence interval. Due to a lack of corresponding data between fully coated and partially coated specimens, the net mass loss/gain could be calculated neither for individual specimens nor for specimen location in the tunnel lining. Figure 10 shows a typical plot of the average cumulative mass gain/loss in the partially coated invert specimens; results for specimens from other tunnel locations (side and top of tunnel) followed similar trends. From Figure 10 it is clear that for some period, some of the partially coated and fully coated specimens absorbed the aggressive water during the testing, implying that the specimens were absorbing water into the epoxy coating, and/or through the epoxy coating into the substrate concrete.
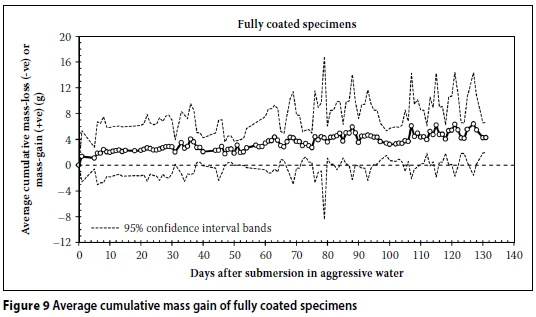
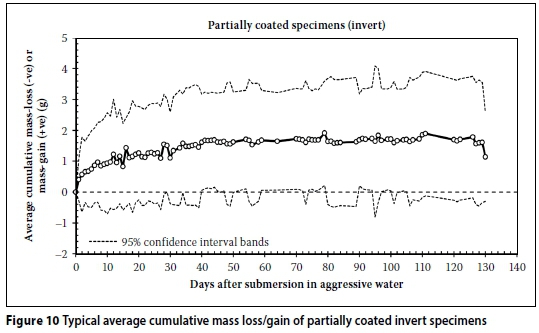
For the partially coated specimens, there would also be mass loss from the surfaces exposed to the aggressive water, which were regularly brushed (under flowing tap water) to remove loose debris. The absorption of the aggressive water in the partially coated specimens was corrected using the mass gain recorded in the fully coated specimens. The mass gain in the fully coated specimens can be attributed to (a) absorption of water by the epoxy coating, or (b) absorption of water by the substrate concrete (in the presence of pores in the surface epoxy coating), or both (a) and (b).
The net mass gain/loss was estimated taking into account the difference in surface areas of epoxy coating in the partially and fully coated specimens - 10 040 cm2 and 13 672 cm2 respectively for a 68 × 30 mm disc specimen. Effectively, the mass gain data from the fully coated specimens was used to determine the mass gain per unit surface area (g/cm2) of epoxy coating, which was then used to obtain the actual mass gain by the epoxy in the partially coated specimens. Figures 11 to 13 show the average net cumulative mass loss/gain in the specimens from the various tunnel locations. The results showed that there is no significant difference in mass loss in the (partially coated) invert, side of tunnel and top of tunnel specimens (Figure 14). Therefore, the results for all the partially coated specimens were averaged and presented as shown in Figure 15.

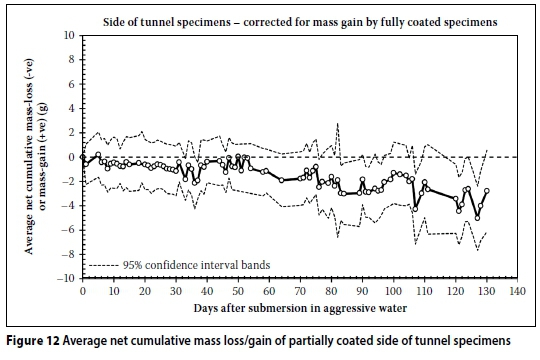
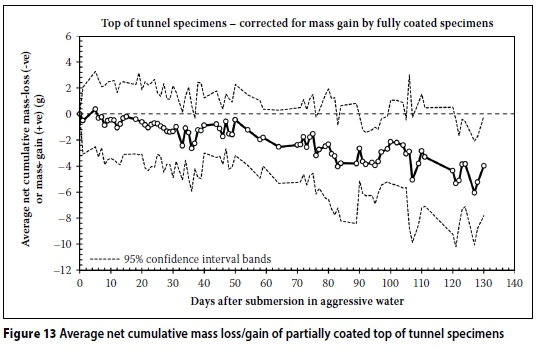
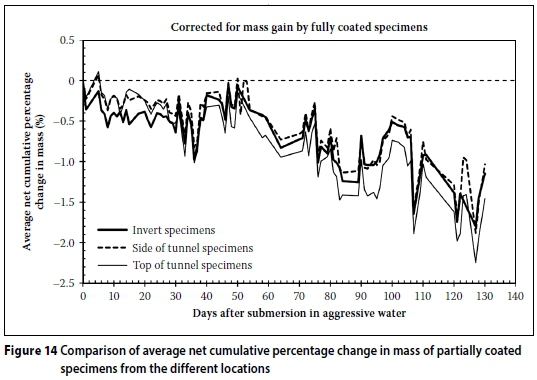
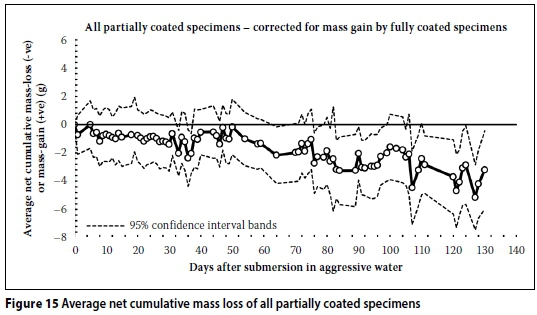
The confidence bands in the figures presented here clearly indicate that using average values results in an inherent high variability. However, from a practical point of view, this may be expected on site, and using average values to draw conclusions can therefore be justified.
There was no notable difference in mass loss as a result of change in source of the aggressive water used in the testing, i.e. from Devil's Culvert Stream, and thereafter from Bramhoek Dam. However, between days 29 and 35 kinks were observed in the trends, possibly signifying a change in aggressivity of the water; the water from Devil's Culvert Stream was less aggressive than that from Bramhoek Dam (see Table 2).
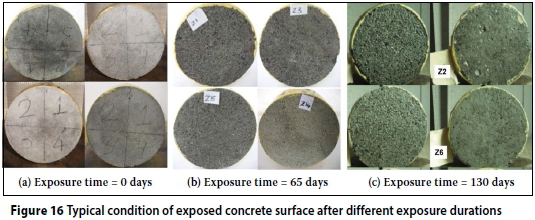
Visual assessment of the corroded specimens
Visible deterioration was observed on the exposed surfaces of the partially coated specimens at the end of the testing period -an indication of corrosion of the concrete by the aggressive (soft) water. Photographs of some of the partially coated specimens after exposure to the aggressive water for different durations are shown in Figures 16(a), (b) and (c). In general, there was visible corrosion of the concrete to the extent of starting to expose the coarse aggregate, and some specimens showed pronounced surface voids or pores which were not visible at the beginning of the aggressivity testing. This surface porosity is likely the result of preferential dissolution of the cement paste phase, creating 'craters' in the surface and leaving behind the insoluble aggregates, both fine and coarse, still embedded in the hardened cement paste.
EFFECT OF CONCRETE DETERIORATION ON THE SERVICE LIFE OF CONCRETE TUNNEL LININGS AND SYSTEM PERFORMANCE
Effect of concrete deterioration on service life of concrete tunnel linings
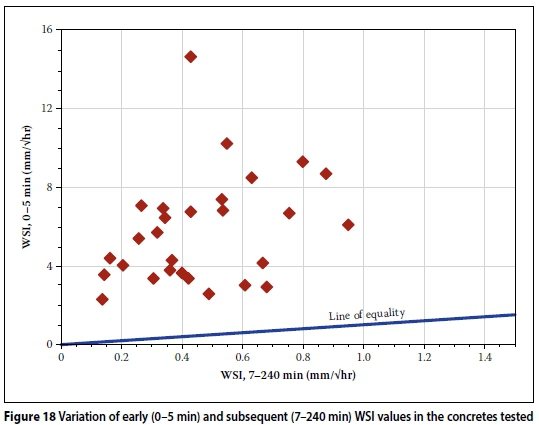
Figure 17(a) presents the trend for the average rate of mass loss in all the specimens during the experimental period. The average rates of mass loss (between days 20 and 130) for specimens from specific locations are presented in Figure 17(b), which also underscore the high variability in the results presented earlier. The results show that there were no significant differences between the mass loss rates in the specimens from the three tunnel locations, i.e. invert, side of tunnel and top of tunnel. The rate of mass loss was calculated assuming an exposed surface of a 68 mm diameter specimen (3 632 mm2) and concrete density of 2 500 kg/m3. The results showed that the rate of mass loss decreased with time, but was levelling off. This may be attributed to the presence of a poorer quality, paste-rich (laitance) layer (Neville 2011) initially on the concrete surface relative to the underlying concrete. This phenomenon may explain the substantially higher rate of mass loss measured in the specimens after just one day of exposure in the aggressive water (see Figure 17(a)). This is also evident from Figure 18 where the 0-5 minutes WSI values are much higher than the 7-240 minutes values; this confirms the somewhat poorer quality of the near-surface concrete (from the 0-5 min WSI values, the thickness of the laitance layer was estimated to range between 0.7 and 4.2 mm, with an average of 1.6 mm (standard deviation = 0.8 mm)).
A comparison of the average rate of mass loss between days 20 and 130 for specimens from the different locations is shown in Figure 17(b) where it is clear that, statistically (at a 95% confidence interval), there is no significant difference in the rate of deterioration (corrosion) of the concrete in the three locations, i.e. invert, side of tunnel and top of tunnel. In assigning the calculated mass loss rate to the real structure, it was borne in mind that this mass loss rate is only realistic if (i) the concrete surface in the structure is exposed continuously to a similar level of aggressivity of water as was the case in the experiments carried out, and (ii) the corrosion products are continuously removed by the high water velocity in a way that was assumed to be similar to the effect of the soft brushing of the lab specimens. Consequently, in the real structure, the mass loss rate will depend on the frequency at which the aggressive water is in contact with the concrete lining, and to some extent, the washing away of the loose deteriorated material and/ or reaction products as the water moves up and down the tunnel at high velocities.
The results showed that the rate of loss of surface of the specimens is of the order of 1.1 mm/yr. This rate levels off after approximately four months of testing. Even though it was difficult to predict the plateau value, it appeared to approach about 10 mm of surface loss for every 10 years of service. Also, as already mentioned, whether this rate applies to the actual rate of in-situ deterioration of the tunnel linings depends on operational and environmental factors. The rate might also be affected subsequently by exposure of more of the coarse aggregate particles.
Furthermore, taking the variability of the results into account, a loss of approximately 10 mm of surface could take place over a period varying from less than one year to 22 years, i.e. there is significant variability in the results, and it can be expected that different areas of the tunnel lining, even within fairly limited areas, might show significantly different rates of deterioration. This can be related to the variable nature of the concrete lining quality, particularly the quality of the near-surface concrete. With time, and as increasing surface loss occurs, giving rise to coarse aggregate particles becoming more visible, this variability will be less evident. Nevertheless, the average value of surface loss is still very significant, since it is the average loss of surface that will affect the operational characteristics of the tunnel.
Taking these factors into consideration, it was apparent that the service life estimation justified the provision of a protective coating to protect the concrete tunnel lining from deterioration by the aggressive (soft) water.
Potential effect of concrete deterioration on the efficiency of power generation
Based on the results and assessments, it was clear that degradation of the concrete lining by soft water attack will take place if the concrete is not protected. Concrete degradation will result in higher friction coefficients and greater friction losses through the system, as tunnel flow at the IPSS will be either in the turbulent or the transitional flow zones.
Friction losses will result in a smaller net head available to generate electricity, and hence lower power generating efficiencies. This was therefore a salient factor to consider in deciding on the need for a protective concrete coating. Sliming and sediment deposition are also expected to influence roughness coefficients, but because flow velocities will be as high as 5.0 m/s in generation mode and 3.5 m/s in pump mode, these were considered relatively insignificant for the purposes of assessing the effect of concrete deterioration on the efficiency of power generation.
Overall unit efficiency due to concrete deterioration
Overall unit power generating efficiencies are influenced by the tunnel lining friction losses, as already discussed, as well as the turbine, generator and transformer efficiencies.
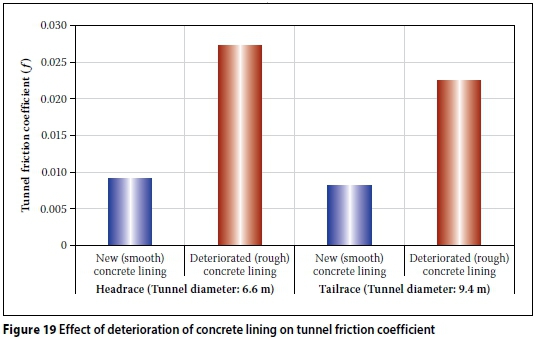
Roughness factors (ε) were estimated based on data from a number of almost similar existing deteriorated/aged concrete tunnels (Basson et al 2003); Roughness factors (ε) of 0.060 and 0.750 were adopted for, respectively, smooth (new) and rough (deteriorated) concrete tunnel lining. Tunnel friction coefficients (f) for smooth and rough concrete surfaces in the headrace and tailrace tunnel sections were estimated using the Zigrang-Sylvester Equation (see Figure 19). These tunnel friction coefficients were used to calculate the available net head at the turbines, for different flow rates through the turbines for deteriorated (rough) and new (smooth) tunnel linings.
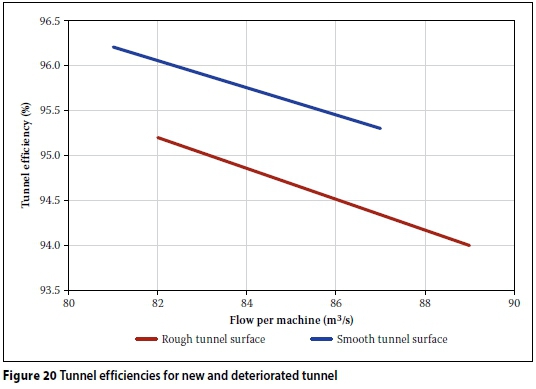
The tunnel efficiencies were then expressed as a quotient of the static (hstatic) and net (hnet) heads to determine tunnel efficiences, i.e. ηtunnel= hnet/hstatic. By taking these efficiencies and estimated/typical turbine, generator and transformer efficiencies into account, an overall power-generating efficiency was determined for new as well as deteriorated tunnels. The results of these calculations (i.e. tunnel efficiencies, ηtunnel)are presented in Figure 20 for different flow rates through the turbines. Save for the calculations being presented in this paper, the drop in tunnel efficiency due to deterioration of the concrete lining by soft water attack is expected to result in a drop in the overall power-generating efficiency by 0.93% if a concrete protective coating is not applied on the tunnel lining to curb deterioration.
CONCLUSIONS
The investigations carried out in this study were aimed at assessing the resistance of the concrete tunnel linings at the Ingula Pumped Storage Scheme (IPSS) to deterioration by soft water attack, and hence to inform a decision on whether a concrete protective surface coating was needed or not. The investigations showed that:
■ When in service, the concrete tunnel lining will be exposed to aggressive soft waters with aggressiveness indices (Basson Indices) ranging from ~ 800 (high) to ~ 1 400 (very high), and hence posing a high risk of corrosion of the concrete.
■ Even though the concrete used to make the tunnel lining is of good quality (low sorptivity, i.e. 2.1 - 6.8 mm/Vhr), it shows high variability and is still prone to deterioration by the soft waters. This was evident from the mass loss (and visual assessment) results.
■ The high variability in the deterioration of the concrete tunnel lining by the soft waters must be taken into account in service life predictions. However, the concretes obtained from the different tunnel locations (invert, side and top of tunnel) showed similar trends of deterioration.
■ Service life predictions based on the deterioration results, taking into account the high variability, show that a loss of approximately 10 mm depth of concrete could take place over a period varying from less than 1 year to 22 years.
■ The deterioration of the concrete tunnel lining by soft water attack will lead to an increase in its surface roughness and an overall decrease in power-generating efficiency by 0.93%.
It was therefore recommended that a concrete protective coating (epoxy paint) be applied on the tunnel lining to curb its deterioration and the potential effect this could have on the power-generation efficiency of the system. Ideally, a life cycle cost analysis of the consequence of this, taking other factors (e.g. maintenance) into consideration, is required, but it can be expected that the initial cost of application of the epoxy coating will easily be set off against the loss in revenue that could result from reduced power-generation efficiencies caused by concrete degradation and higher friction losses.
ACKNOWLEDGEMENTS
The authors would like to acknowledge the input and support of Eskom and the Braamhoek Consultants Joint Venture, including Mr Colin Logan, Mr Alain Truyts and Mr Gordon Nefdt and their dedicated site-based laboratory team, in carrying out the laboratory experiments.
END NOTE
1. Part of the information provided here has been adopted from the article "Ingula Pumped Storage Scheme", published in Civil Engineering, November 2016 [24(10): 12-15].
REFERENCES
Ballim, Y, Alexander, M & Beushausen, H 2009. Durability of concrete, Chapter 9. In: Owens, G (Ed.). Fulton's Concrete Technology, 9th ed. Midrand: Cement & Concrete Institute, 155-188. [ Links ]
Basson, G R, Visagie, M & Malan, J G 2003. Dealing with tunnel ageing. Report to the Water Research Commission, WRC Report No. 1088/1/03. Ninham Shand (Pty) Ltd in Association with the University of Stellenbosch and the University of Pretoria. [ Links ]
Basson, J J & Ballim, Y 1994. Durability of concrete, Chapter 10. In: Addis, B J (Ed.). Fulton's Concrete Technology, 7th ed. Midrand: Portland Cement Institute, 160-164. [ Links ]
DI-Manual 2010. Durability index testing procedure manual, Version 2.0. Department of Civil Engineering, University of Cape Town. Available at: http://www.alturl.com/dq7s6 [ Links ]
Neville, A M 2011. Properties of Concrete, 5th ed. Harlow, UK: Pearson Education. [ Links ]
Otieno, M, Alexander, M & Du Plessis, J 2016. Ingula Pumped Storage Scheme: Assessment of deterioration of concrete tunnel linings. Proceedings, Hydropower and Dams Conference (Hydro 2016), 10-12 October 2016, Montreux, Switzerland. [ Links ]
 Correspondence:
M Otieno
School of Civil and Environmental Engineering
University of the Witwatersrand
Private Bag 3
Wits 2050
South Africa
T: +27 11 717 7117
E: mike.otieno@wits.ac.za
M Otieno
Department of Civil Engineering
University of Cape Town
Private Bag X3
Rondebosch 7701
Cape Town
South Africa
T: +27 21 650 4012
E: mark.alexander@uct.ac.za
J du Plessis
GIBB Engineering & Architecture
P O Box 2700
Rivonia 2128
South Africa
T: +27 11 519 4654
E: jduplessis@gibb.co.za

DR MIKE OTIENO, who is an Associate Member of SAICE, is a Senior Lecturer in the School of Civil and Environmental Engineering at the University of the Witwatersrand, Johannesburg. He received his PhD and MSc (Eng) degrees from the University of Cape Town, South Africa, and his BSc (Civil Eng) degree from the University of Nairobi, Kenya. His research interests include concrete durability, service life prediction, steel corrosion in reinforced concrete structures, and repair and rehabilitation of concrete structures.

PROF MARK ALEXANDER Pr Eng, who is a Fellow of SAICE, is Emeritus Professor of Civil Engineering at the University of Cape Town. He holds BSc (Eng), MSc (Eng) and PhD degrees from the University of the Witwatersrand, Johannesburg. His research interests are in cement and concrete materials, with experience in fundamental and applied research relating to design and construction.

JACQUES DU PLESSIS Pr Eng holds a BEnc degree from the University of Pretoria. He has twenty-three years' civil consulting engineering experience, specialising in the water field, with particular focus on dams and hydropower, and has been the Approved Professional Person for a number of Category II dam designs. He joined the Ingula team in 2005 as senior dam design engineer, after which he supervised construction of the upper dam from April 2008, followed by supervision of the headrace tunnels during 2011. From May 2012 he led the construction supervision team for the main underground civil contract of the project. Currently he is Senior Dams Engineer at GIBB Engineering & Architecture.

