


Servicios Personalizados
Articulo
 Inglés (pdf)
 Articulo en XML
 Referencias del artículo
Indicadores

Links relacionados
-
 Citado por Google
 -
 Similares en Google
Compartir

 Permalink
Journal of the South African Institution of Civil Engineering
versión On-line ISSN 2309-8775
versión impresa ISSN 1021-2019
J. S. Afr. Inst. Civ. Eng. vol.59 no.3 Midrand sep. 2017
http://dx.doi.org/10.17159/2309-8775/2017/v59n3a5
TECHNICAL PAPER
Alternative wall-to-slab connection systems in reinforced concrete structures
J D Gerber; G P A G van Zijl
ABSTRACT
In many reinforced concrete structures the walls precede the construction of the connecting floors. A system is, therefore, required to connect the floors to the already cast walls. There are many different floor-to-wall connection systems available in South Africa, but their behaviour and capacity are not always fully understood, especially when the moment capacity of the joint is to be utilised. This study focuses on four systems: continuous starter-bars, pre-bent site-installed starter-bars, pre-assembled starter-bars and cast-in anchors with mechanical couplers. The design procedure for the continuous starter-bar system is well understood and documented in design codes, but not enough information is available on the design procedure for the other systems. Certain practical aspects of the installation process are also not fully understood. Cold-bending and straightening of the starter-bars are inevitable in both bend-out systems. Previous research shows that this cold-working of the reinforcement can reduce the yield stress and E-modulus of the steel. In order to investigate these findings, a series of tensile tests are conducted. The results indicate that a significant reduction can be expected in both the yield stress and modulus of elasticity of the steel. Low-cycle fatigue tests further suggest that cold-bent steel also has a reduced ductility. The tensile tests are followed by the construction and testing of the systems in full-scale wall-to-slab connections. The effect of the cold-bending on the starter-bars is clearly visible, as both the responses of the bend-out systems are less satisfying than the results from the continuous starter-bar system. The experimental phase is followed by numerical analysis of the connection systems. The finite element analyses show that the structural performance is significantly more sensitive to a reduction in the yield stress of the starter-bars, than to the use of a lower concrete grade. It is concluded that all the alternative connection systems can be implemented successfully in a moment-fixed wall-to-slab connection, but that the site-installed bend-out system is the preferred method. However, in order to ensure that the system performs on the same level as conventional systems, it is recommended that the design should be conducted with a set of modified steel properties to allow for the negative effect of the cold-working on the starter-bars.
Keywords: wall-to-slab, floor-to-wall, connection system, reinforced concrete, moment capacity, joint, starter-bar
INTRODUCTION AND BACKGROUND
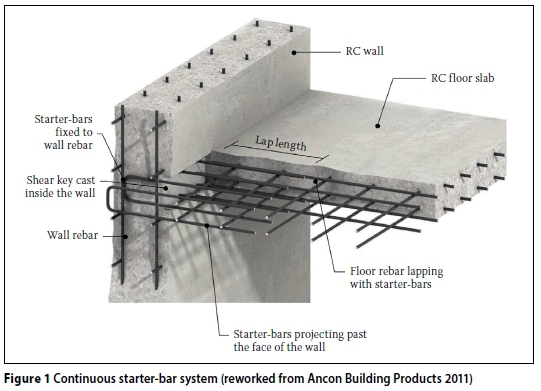
In the construction of multi-storey buildings, the reinforced concrete (RC) core or shear walls normally precede the construction of the RC floors, the former being cast using slip or jump formwork. These systems are designed to increase the construction speed and efficiency, while minimising the cost of labour and material (Rupasinghe & Nolan 2007). The sliding nature of these systems requires that no elements may be protruding from the wall while under construction. This requirement prohibits the use of the conventional system where starterbars are cast directly into the wall and fixed through the formwork, as seen in Figure 1. The result of this limitation is that alternative methods are used to ensure rebar continuity between the floor and wall, without compromising the operation of the sliding formwork. Alternative systems are also used in cantilever balconies or walkways, or any structure where the wall is cast ahead of the connecting floor.
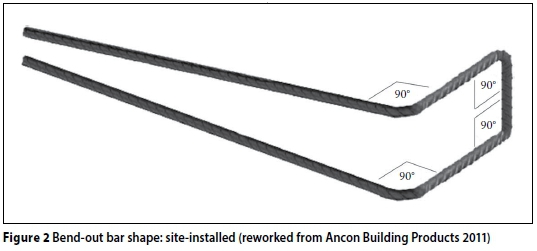
Currently, the most commonly used method in South Africa to ensure this continuity is a rebar bend-out system. Rebar is pre-bent and fixed to the wall reinforcement, and only straightened after the formwork is removed. The shape of the pre-bent bars is shown in Figure 2. This system is relatively simple to install and can be assembled on site using regular rebar ordered from a bending yard. Although this system does not require highly skilled workers, the installation process can still be tedious and time-consuming. Each starter-bar has to be securely placed at the correct position in the wall in order to line up with the connecting floor, while individual holes need to be drilled in the formwork at the position of each starter-bar leg.
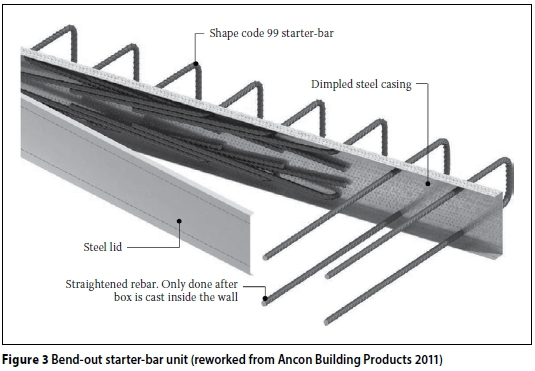
In order to make the installation process of the bent-out bars easier and faster, a modified approach is adopted in which the pre-bent rebar is placed inside a steel casing, as illustrated in Figure 3. This modification improves the ease and speed of installation, but in turn makes the system more expensive. Another drawback is that only a few companies locally manufacture this system, and it is therefore not readily available throughout South Africa.
In the case of the bend-out systems, plastic deformation of the steel is unavoidable during the cold-bending and straightening of the rebar. Furthermore, the mechanical properties of rebar are more prone to changes during cold-bending. This change in mechanical properties has been observed to cause a reduction in the tensile yield strength, modulus of elasticity and even the ultimate strength of the steel (Chun & Ha 2014). Currently there is not enough information available for engineers to accurately take this effect into account when designing a connection.
Considering the modified bend-out system with the rebar encased in a steel box, further uncertainty arises as to what effect the steel casing has on the bond strength of the concrete connection, as it is permanently cast inside the structure.
The only reference in South African codes to bend-out bars is found in SABS 10144, where it is recommended that the size of the bend-out bars is limited to Y10 or R16, and that mechanical splices should be used if greater strength is required (SANS 2012). Rebar couplers connected to a cast-in steel anchor is one example of such a mechanical splice, as shown in Figure 4.

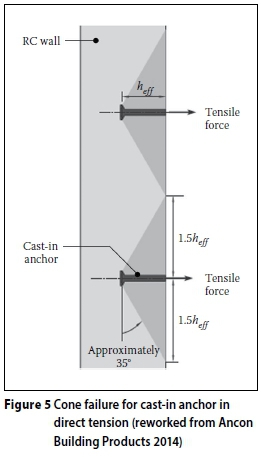
The failure mode for direct tensile anchors is based on a model with a breakout prism with an angle of approximately 35° as shown in Figure 5. This can roughly be translated to a cone shape with a base equal to three times the effective anchor embedment depth, i.e. 3 × heff(Cairns 2010). This pull-out model is referred to as a cone failure mechanism. The design procedures for anchors in direct tension are well established and documented in several design codes, such as the New Zealand design codes (NZS 2006) and American Concrete Institute codes (ACI 2008).
These existing procedures, however, do not cover anchors within moment-resisting connections, such as wall-to-slab applications. A recent research investigation at Heriot Watt University tested moment connections using cast-in anchors to determine the degree of enhancement in concrete pull-out capacity, and to establish a design method based on the results (Cairns 2010).
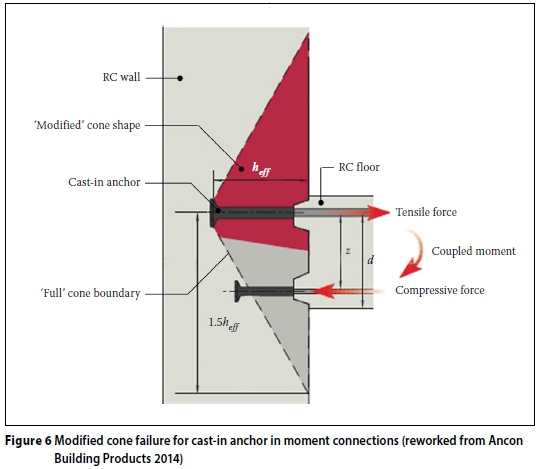
In moment connections, such as wall-to-slab joints, the bottom portion of the slab will create a compression block in close proximity to the bearing surface of the anchor. The transmission of the force between the bearing face and the compression force, forming part of the moment couple in the slab, will tend to be taken by a direct compression strut rather than by shear or tension. This will decrease the break-out plane resisted by tension and will therefore create a modified cone shape, as illustrated in Figure 6. As concrete is stronger in compression than tension, the cone pull-out resistance will be increased. The tests also indicated that the enhancement is greatly impacted by the ratio of the depth of anchor head embedment (heff) to the effective depth of the anchor in the slab (d), the specific ratio being heffld (Cairns 2010).
Epoxy-based adhesive dowels are also widely used in South Africa to anchor rebar in already cast concrete elements. However, due to the relatively high price of this system, its use is usually limited to projects where structural alterations or extensions necessitate the anchoring of rebar in existing concrete.
In the case of epoxy-based adhesive dowels, the performance and installation procedures are well researched and documented in the reference material provided by the manufacturers. The structural engineer has enough information to properly design a connection and prescribe the necessary installation procedures to ultimately have enough confidence that the connection will perform adequately. With most of the other advanced methods this information is not available.
From the above it is evident that there are a number of different systems available in reinforced concrete wall-to-slab connections. The challenge for the design engineer remains to choose the most suitable system for the specific application at hand. In order to make an informed decision, more information is needed to understand how these systems perform structurally and what the aspects to consider are when designing them.
The focus of this research is to investigate how different types of connection systems compare to the conventional system. The research investigation includes the comparison between four different wall-to-slab connection systems, namely:
■ Continuous starter-bar (Model A)
■ Site-installed bend-out bar (Model B)
■ Pre-assembled bend-out bar (Model C)
■ Cast-in anchor (Model D)
The investigation includes a study of each individual system in order to gain an understanding of the critical aspects and parameters that will affect their structural performance. Preliminary tests are conducted to quantify these aspects, followed by full-scale testing and finite element modelling (FEM) to confirm any local phenomena observed with the preliminary tests.
A comparison is drawn between the practical aspects of the systems, including ease and time of installation, cost, quality control and availability of products.
The main objective of this study is to provide the engineer with recommendations on how to choose the most appropriate system for a wall-to-slab moment connection and conduct the design to be as cost-effective as possible, without compromising the margin of safety as defined in typical design codes.
Secondly, construction guidelines are to be provided for safe application of these systems on site, in order to comply with the designed connection.
EXPERIMENTAL DESIGN
Full-scale tests
In order to compare the different connection systems within the time constraint of this research, a best practice approach was adopted in the physical experimental phase. Four full-scale models of the different connection systems were built in the Stellenbosch University Structural Laboratory. The models represent a wall-to-slab moment connection found in a typical high rise office block.
The models were all identical, with a 250 mm thick cantilever floor connected to a 300 mm thick wall. The systems were all designed to have the same moment and shear capacity, based on the actions associated with a typical office environment.
When designing RC structures, the ultimate limit state (ULS) design usually governs (Robberts & Marshall 2010). Therefore the design procedure for the conditions at ULS, and the principles as set out in SANS 10100-1:2000 (SANS 2000), were followed to design the connection between the wall and the slab in the full-scale models. Detailed design calculations were performed for a typical office building to ensure relevance of the chosen specimen geometry and loading position. The loading position caused a realistic combination of internal shear and bending moment at the wall-to-slab connection. For the ULS the load was 49.5 kN and for the SLS serviceability limit state (SLS) it was 40.5 kN.
These values are based on a variable action of 3 kPa and additional permanent actions equal to 3.5 kPa to account for the weight of screed, ceiling, lighting and air-conditioning equipment. For the ULS, the partial factor for the variable actions was taken as 1.6, while 1.2 was used for the permanent actions, including the self-weight of the slab. The partial factors used for the SLS, were 1.1 for the permanent actions and 1.0 for the variable actions. The procedure can be summarised through the following steps:
■ Step 1: Determine forces acting on the structure.
■ Step 2: Calculate possible load combinations.
■ Step 3: Analyse structure to determine design forces and moments at ULS.
■ Step 4: Design section for flexure.
■ Step 5: Design section for shear.
■ Step 6: Choose rebar configuration (size and spacing).
■ Step 7: Check anchorage and lap lengths.
■ Step 8: Detail connection reinforcement. All the calculations for the models that contained the bend-out systems were based on the assumption that the rebar had already been straightened, and therefore reflected the conventional system. The only difference was in the detailing of the starter-bars. The design procedure for the cast-in anchor system followed the approach as set out in the CEB Design Guide and making use of the modified cone behaviour (CEB 1997).
The reinforcement configuration that satisfied the connection design for Models A, B and C comprised six Y12 starter-bars spaced at 150 mm centre-to-centre (c/c), with 25 mm cover. The cast-in anchor system installed in Model D had a similar arrangement, with six anchors also spaced at 150 c/c. The anchors were supplied by Ancon Building Products. The continuation bars were also 12 mm in diameter, each with a threaded end, the thread being a size larger than the nominal bar diameter to ensure that the effective area is not compromised. The anchor length was 115 mm, with a 40 mm diameter head and an embedment depth of 142 mm.
In order to simulate practice as closely as possible and to ensure continuity, a typical reinforcement configuration for all the wall sections was used. The vertical reinforcement was Y12 bars spaced at 150 mm (c/c) on both sides of the wall. Similarly, the horizontal reinforcement was Y12 bars spaced at 200 mm c/c. This configuration complies with the detailing requirements of SANS 10100-1:2000 (SANS 2000) to minimise cracking in the walls.
The concrete was ordered from a local pre-mix batching plant and was specified as 40 MPa (CEM II 51.5 A-L) concrete. A combination of 19 mm and 13 mm Hornfells stone was used as aggregate, and the sand component consisted of both dune sand and crusher dust. The concrete was delivered to the laboratory in two separate batches - the first batch was used to cast the walls for all four models, and seven days later the second batch was used for the cantilever floors.
The concrete compressive strength was determined by casting and curing 100 mm cubes from the concrete batches for the walls and the slabs. The cubes were stripped after one day and cured under the same conditions in the laboratory. On the day of the wall-to-slab connection tests, the cubes were tested in a Contest 1 MN materials testing machine. Extra cubes were prepared, and tested at the age of seven days to monitor the strength development, to ensure a high likelihood that the required 40 MPa strength would be attained at the time of the actual wall-to-slab tests. A set of three cubes representing the walls and the slabs respectively were tested on the day of the actual wall-to-slab tests, with an average compressive strength of 40.5 MPa and coefficient of variation of 0.011 for the walls, and 40.8 MPa (CoV 0.009) for the slabs.
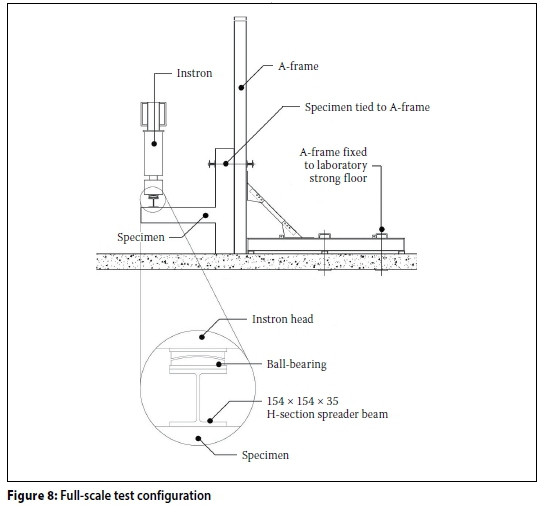
After 28 days the models were individually tested in a special steel frame designed to ensure that the desired boundary conditions are met. An illustration of the applied loads, boundary conditions and a full-scale specimen, is presented in Figure 7, with the test configuration in Figure 8.

During the experimental testing a load cell was used to capture the applied load, while seven HBM linear variable differential transformers (LVDTs) were used to measure the structural response of the specimens. The LVDTs were located at specific points along the specimens in order to calculate the relative wall-to-slab displacement. An additional LVDT was located at the back of the specimens to record the horizontal movement of the A-frame at a height of 525 mm.
A standard concrete crack width ruler was used to measure the width of all visible cracks at three different stages during the tests. An Aramis camera was also installed to continuously track the crack development in the vicinity of the wall-to-slab joint (GOM 2003).
The results were presented through load displacement curves and crack patterns observed at applied loads associated with the SLS, ULS and the load at failure.
Due to the size and complexity, one specimen of each wall slab connection type was tested. To address the inherent variability in reinforced concrete behaviour, best practice was followed in the manufacturing of specimens. Significant care was taken to avoid geometrical imperfection in the specimen dimensions and in the positioning of the steel reinforcing bars and the connection systems. The fresh concrete showed no segregation, nor leakage from the form-work. The low variability in concrete cube strengths reported above indicated good control. The actual stress-strain behaviour of the steel bars was carefully measured, as reported in subsequent sections of this paper. The authors postulate that, given the care in controlling the material and geometry of the specimens, a reasonable reflection of the various connection systems is given by the results of the tests on a single specimen of each type. Variability in the supplied connection systems is not reflected in the results, and will be tested in a next phase.
Steel bars tensile tests
In order to understand the effect of cold-bending and straightening on the material properties of reinforcement, a series of tensile tests were also conducted. The specimens included a set of Y10 and Y12 deformed bars. These are typical diameters used in wall-to-slab connections, as larger diameters are not suitable for cold-bending on site. Half of each set was tested as straight bars, while the remaining bars were cold-bent and straightened after two weeks before being tested.
All the tensile tests were performed with a Zwick Universal Testing Machine and complied with the specifications of SANS 6892-1:2010 (SANS 2010).
Both sets of Y12 and Y10 rebar were ordered from a local bending yard. The reinforcement was locally manufactured at Arcelor Mittal, under the registered trade name NOSTRAR, to comply with the specifications of SANS 920:2011 (SANS 2011) for 450 MPa deformed reinforcement bars.
All the bars in a set were cut from the same batch of steel. Half of the bars in each set were bent to a 90° angle. The bars were bent with a standard bending table, and the bending radius complied with the values as prescribed in SANS 920:2011 (SANS 2011). The bent bars were all straightened after 14 days, simulating the usual time lapse between the bending of the rebar and the straightening on site. The bars were placed in a table vice clamp and straightened using a pipe as lever arm. A constant force was applied in a single motion until the bar was reasonably straight. In some cases the bars were further clamped and straightened, within a tolerance of 3°, to ensure they are straight enough to fit between the cross heads of the testing machine.
It should be noted that, in order to apply the principle of best practice, the bars were not hammered or tampered with during the straightening process. It is acknowledged that, in practice, some hammering may occur on site, but this was not simulated in this experimental investigation. The results are, therefore, a comparison between the material properties under best practice conditions.
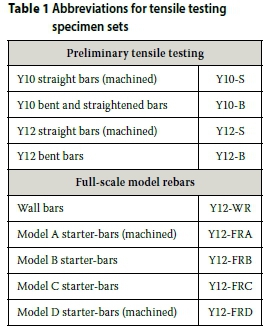
A summary of the specimen sets are presented in Table 1, with the abbreviations that will be used hereafter.
During the tensile testing the applied tensile force was measured with the load cell of the testing machine, while the extension over the gauge length of the specimens was recorded by three LVDTs, as shown in Figure 9. By taking the average reading between the three LVDTs any eccentricity in the alignment of the specimen was taken care of. The recording frequency was 10 Hz.

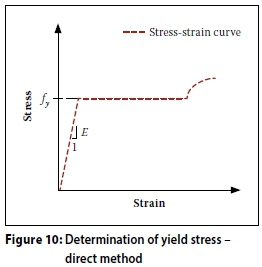
The methods as set out in SANS 68921:2010 (SANS 2010) were used to determine the material properties of each specimen. The E-modulus (E) was determined by first plotting a trend line for the data in the linear portion of the stress-strain graph, and then using the gradient of that line as the value for E (SANS 2010). The yield stress (fy) was determined by one of two possible methods, based on the shape of the stress-strain curve. When the curve had a definite linear portion up to a certain point and then flattened, as seen in Figure 10, the yield stress (fy) was taken as the stress value corresponding to that point on the graph. If, however, the stress-strain curve had no definite point at which it flattened and the gradient for the linear portion just gradually reduced to create a curved graph, then the offset method was used as seen in Figure 11.

The ultimate stress (fu) was recorded as the highest applied load during the test divided by the original cross-sectional area of the rebar.
EXPERIMENTAL RESULTS
Full-scale test results
Figure 12 presents the crack patterns at Stage 1 of the tests (SLS). Photos captured by the Aramis camera are superimposed with rendered images indicating the strains measured on the specimens. From these rendered images the crack patterns are clearly visible. The location of the major cracks in all four systems corresponds to the position and shape of the construction joint of the particular system used. All the specimens recorded one major crack of between 0.1 mm and 0.4 mm, with Model A recording the widest crack of 0.4 mm. This crack was observed on the rear side of the wall and is therefore not visible in Figure 12. Apart from this crack, all the other cracks fell within the general limit of 0.3 mm for structures exposed to a serviceability load (SANS 2000).

Once the tests went past Stage 2 (ultimate limit state) the crack development in the first three systems was similar, both in size and pattern, and was clearly indicative of a connection where the rebar was starting to yield. In contrast to this, the pattern that was observed in Model D strongly suggested a cone pull-out failure. Looking at the photos in Figure 13, taken at the final stage of the tests, the cone-shaped crack pattern in Model D is clearly visible. Although the initial yielding cracks are also present, the failure mechanism clearly shifted to a cone-shaped pull-out failure after Stage 2.
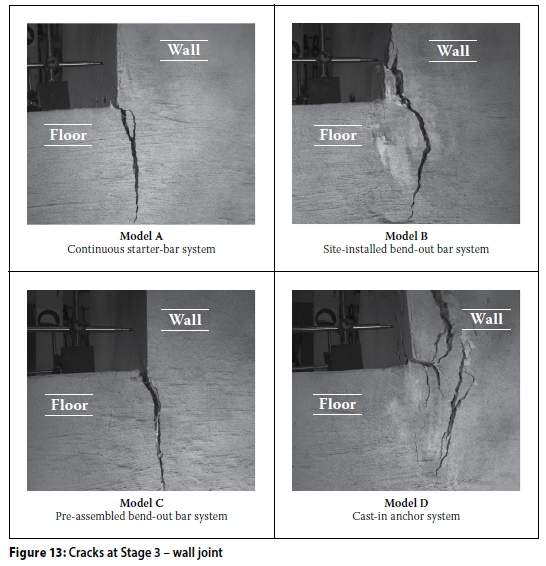
Figure 14 presents a series of load displacement curves for the four models. The displacement is measured at the tip of the cantilever floor for a specific applied load.
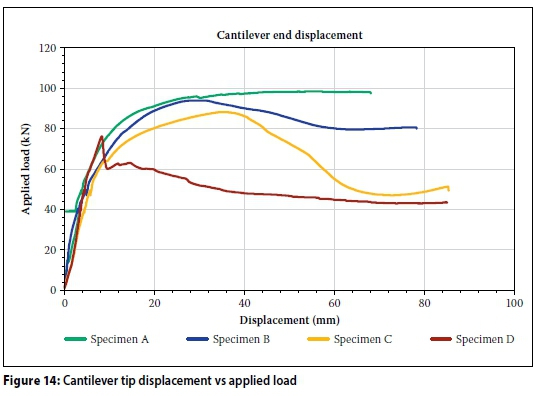
Up to a serviceability load of 40.5 kN the shapes of all the curves are similar. From this point onwards the curves for Models B and C are flatter compared to that of Model A. The shape of the graph for Model A suggests a system that is ductile. Although the behaviour of Models B and C could also be classified as "ductile", the structural performance was not as desirable as in Model A -the point of ultimate resistance was lower, with deflection-softening occurring beyond this point. The graph for Model D climbs gradually to the maximum load of 75.86 kN, after which there is a sudden drop in the load. This drop in resistance is followed by a gradual softening response. Consequently it has a significantly lower ultimate resistance and the earliest onset of deflection softening of the four models. This behaviour is associated with a pull-out cone failure mechanism.
Table 2 presents a summary of the displacements and rotations recorded at the first two stages of the tests.
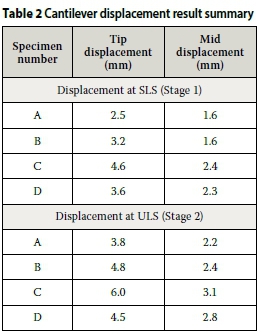
The tip displacement for Model A, at Stage 1, was on average 33% lower than that of the other Models and 24% lower at Stage 2. Similarly, the displacement of the floor at the middle was 21% lower at Stage 1 and 20% at Stage 2.
Table 3 presents the ultimate capacities recorded for the models. The ultimate capacity of Model A was 5% larger than that of Model B, 12% larger than Model C and 29% larger than Model D.

Steel bar tensile test results
A stress-strain curve was developed for each specimen tested. The specimens were divided into two main sets - the straight bars (S-series) and bars that were bent and straightened afterwards (B-series). The stress-strain curves of the two sets of specimens were noticeably different. To illustrate this, Figure 15 presents a typical stress-strain curve associated with a Y12 bar from the S-series and a Y12 bar from the B-series.

The stress-strain curve for the S-series demonstrates a linear-elastic behaviour up to a stress value of about 540 MPa, before flattening out. After the yield plateau, the start of strain hardening is observed at around 0.022 mm/mm strain. In contrast to this, the stress-strain curves for the Y12-B specimen present no clear yield plateau, and the start of strain hardening is not as clearly defined.
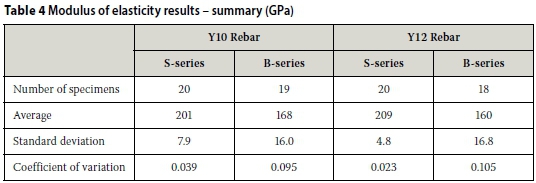
Furthermore, the gradient of the linear portion on the curve for the B-series is notably lower than that of the S-series. This demonstrates a decrease in the modulus of elasticity. The average E-modulus for the Y10-B series was 16.5% lower than that of the Y10-S series. For the Y12 equivalent, the reduction was even larger at 23.5%. A summary of the data is contained in Table 4.
Although this study was unable to quantify the amount of reduction in the ductility of cold-bent bars, the phenomenon was observed during the low-cycle fatigue tests, where some bars fractured after being cold-bent and straightened more than twice. Previous research showed that a reduction of up to 50% can be expected (Chun & Ha 2014). This could lead to bars failing the ductility requirements as set out in SANS 920:2011 (SANS 2011). The full-scale specimens did, however, behave in a ductile manner, and no fracture of any reinforcement was observed. It is subsequently concluded that further research is required to better understand and quantify the reduction in ductility of cold-bent rebar and the effect it has on the structural performance of slab-to-wall connection systems.
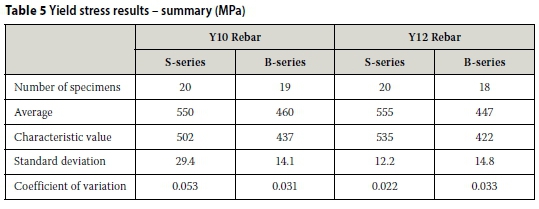
The average yield strength (fy) for the Y10-S bars was 550 MPa, which is well above the characteristic value of 450 MPa used in design codes. However, according to the Joint Committee on Structural Safety (JCSS 2001), the average strength of rebar is expected to be around 2 standard deviations above the characteristic value, i.e. for high-strength rebar the average tested strength should be in the range of 450 + 2 × 30 = 510 MPa. The average strength for the Y10-B bars dropped by more than 16% to 460 MPa and five specimens recorded a value lower than 450 MPa. Furthermore, according to SANS 920:2011 (SANS 2011), the characteristic yield strength of reinforcement, determined through tensile testing, is the 5th percentile of the data, i.e. the value below which not more than 5% of the results in the series fall. Subsequently, the characteristic yield strength for the Y10-B bars was only 437 MPa. A similar observation for the Y12 set of bars showed a drop in the average yield stress of 19.5%, to 447 MPa, already lower than the 450 MPa characteristic value. A summary of the results is presented in Table 5.
The average value for the ultimate stress (fu), between the S- and B-series, showed only a small reduction of 2% for the Y10 bars and 4% for the Y12 bars.
NUMERICAL ANALYSIS
Numerical simulation of experimental results, combined with the correct material models, is a powerful tool to extend the range of variables used in the limited experimental phase.
Finite element modelling (FEM) and numerical analysis were therefore conducted to better understand the isolated effect and sensitivity of the structural performance to a range of reinforcement properties. The different reinforcement material models used in the FEM were all based on actual data captured in the preliminary tensile testing phase. The data used for simulating a connection system containing straight bars was taken from the Y12-S series of specimens, while the data from the Y12-B series was used in the material models for the numerical analysis of the bend-out bar systems.
Model development
Research done by Deaton (2013) on nonlinear finite element analysis (FEA) provided essential information in the development of the FE models used in this investigation. The Diana software package (Diana 2014) was used, and a summary of the model details is presented in Table 6.
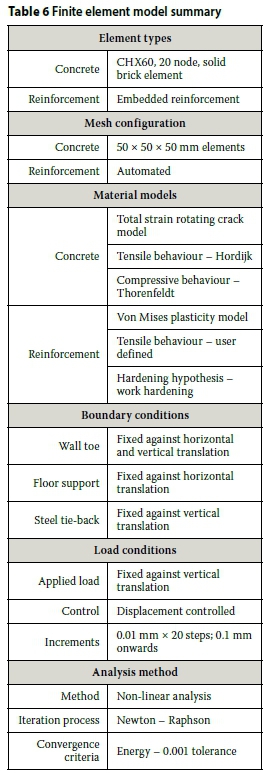
The material models for the concrete interface, simulating the construction joint, were defined in a similar manner as the rest of the concrete, with the only adjustment in the tensile strength. This value was reduced significantly to 1.00 × 10⁻⁵ MPa in all the models. This configuration enabled the concrete elements to still retain their full compressive strength, without any significant contribution to the tensile resistance of the elements in the interface zone.
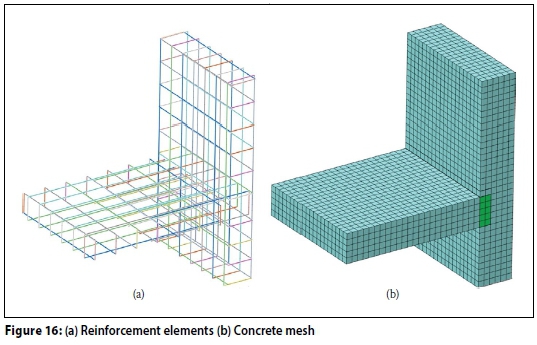
All the reinforcing bars were modelled at the same location as in the physical specimen, and are shown in Figure 16(a). The concrete elements, Figure 16(b), were specified as the mother elements for the embedded reinforcement. No specific mesh configuration was applied to the reinforcement, as the Diana package automatically runs the pre-processing of reinforcement locations (Diana 2014).
The experimental results for Model A were compared to the FEA by means of a load displacement curve and the formation of cracks at SLS and ULS. The measured cracks in the physical model were compared to the principal crack widths (ωcr), determined through the FEA and calculated by multiplying the principle crack strain (εcr) with the crack bandwidth (h), as shown in Equations 1 and 2.

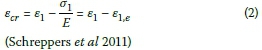
Where
ε1= Total principle strain
ε1,e= Elastic principle strain
σ1 = Principle stress
E = Young's modulus
Results
Figure 17 presents a comparison of the data captured during the experimental phase and the data from the numerical analysis.

The data from the FEA shows reasonable agreement with the experimental load displacement response. The physical model was able to withstand a maximum applied load of 98.12 kN, while the numerical equivalent came within 11% of this value with an ultimate load of 87.24 kN. No attempt was made to improve the agreement between the computed and measured response, although this would be possible. The agreement is considered to be reasonable, justified by subsequent sensitivity studies. The displacement of the physical model at Stage 1 of the test (SLS) was 2.5 mm, while the FEA recorded a tip displacement of 2.02 mm. At Stage 2 (ULS) of the tests the displacements were 3.8 mm and 2.72 mm respectively.
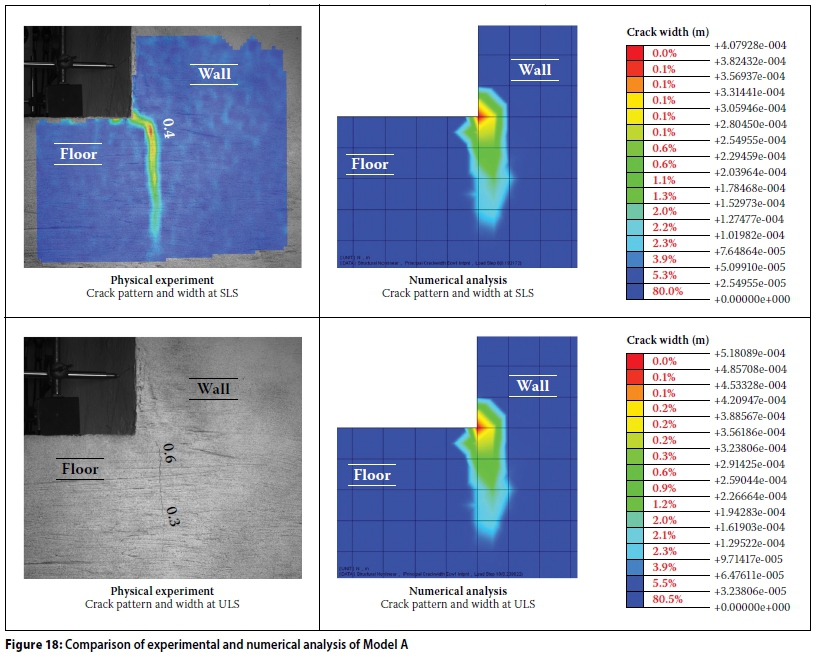
Figure 18 contains images comparing the crack development at the two stages of testing. The images on the right show the crack patterns and associated crack widths in the FE model, while the images on the left are the photos taken during the experimental test.
The general pattern of the experimental photos and the numerically rendered images are similar in both appearance and crack widths. At Stage 1, the largest crack measured on Model A was 0.4 mm, while the maximum crack width in the numerical equivalent was also 0.4 mm. At the second stage of the tests the cracks on the physical model were 0.6 mm in width, compared to the 0.52 mm in the FE model.
This overall good correlation between the numerical and physical responses serves as a validation of the FE model. It shows that the structural response of a wall-to-slab connection can be simulated with the Diana package with reasonable accuracy.
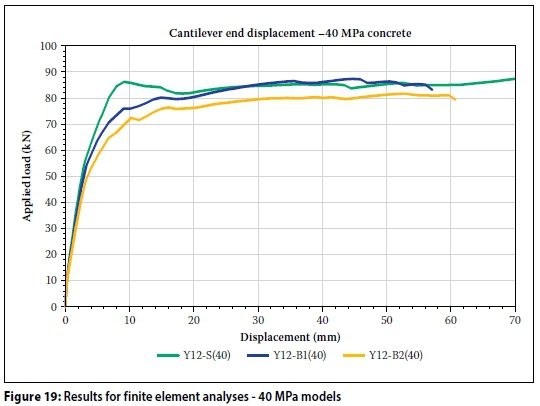
The sensitivity study was conducted for two parameters. The first is the sensitivity of the structural response to variation in the starter-bar steel properties, while keeping the concrete properties constant. Figure 19 shows the responses of the first three models, i.e. the response of the relevant steel bars are given the measured stress-strain properties of the virgin (unbent) Y12 bars, that of the B1 series, and thirdly, that of the B2 series. In this set the concrete grade was kept at 40 MPa, while the material properties for the starter-bars were changed.
The second parameter study is the concrete class. In this case the sensitivity of the structural response to the use of different concrete classes was studied, while the steel properties were kept constant. Figure 20 displays the structural response of three models with the same steel properties, but with different grades of concrete.

From Figures 19 and 20 it is clear that the structural performance is significantly more sensitive to a change in the properties of the starter-bars, than a change in the concrete grade. It is important to note that only the properties of the starter-bars were varied and not the rest of the general reinforcement in the wall or the slab. This reflects the situation in reality where normally only the starter-bars are subjected to cold working.
CONSTRUCTABILITY
The installation procedure for the continuous starter-bar system is a tedious and time-consuming process. This system is also not compatible with jump or slip formwork, as the protruding bars will hinder the sliding nature of the system. Furthermore, the exposed bars are impractical on site and a safety hazard for workers moving in the vicinity.
The constructability of the site-installed bend-out system is also far from ideal - the pre-bent bars need to be fixed individually and great care should be taken to ensure that they are properly tied to prevent any shifting
during concreting. The use of power tools to chip the concrete away and reveal the bent bars is not only labour-intensive, but there is a great risk of damaging the reinforcement during the process. Once the bars are revealed a standard pipe can be used to straighten them.
Although the site-installed bend-out system has many drawbacks, it can produce a proper floor-to-wall joint under the correct supervision without the hassle of drilling holes in the formwork or exposing anyone to the hazards of protruding rebar on site. The bend-out bars can also be ordered from any bending yard, bringing the material cost of the system in line with the continuous starter-bar alternative, as seen in Table 7.

The pre-assembled bend-out system addresses two of the major shortcomings of the site-installed version - the pre-assembled starter-bars speed up the fixing process and, once the wall is cast, the steel lid is simply removed to reveal the bent reinforcement. Due to the speed with which the system can be installed, it is the preferred system to use with any form of jump or slip formwork construction. The only drawback is the price, as the material cost is nearly double that of the first two systems.
Another, even more elegant solution, is the use of cast-in anchors with couplers. This is particularly useful in walls where the concentration of reinforcement is already high, as the anchors take up little space. The installation process is simple, fast and effective. This product is not currently available in South Africa, and a realistic cost comparison is therefore not possible. However, in a market where all the systems are locally manufactured the material cost for this system is three times that of the pre-assembled bend-out system, as presented in Table 7.
Table 7 presents a summary of the material costs for the respective systems, determined in August 2016. Both the local rates and the rates in the United Kingdom are included. The rates are all based on a connection between a 300 mm wall and a 250 mm floor, with Y12 rebar spaced at 150 mm c/c and 25 mm cover.
CONCLUSIONS
The structural response of all the systems can be categorised as ductile, although the performance of the continuous starterbar system was the most desirable. This is expected, as the starter-bars in this system are not subjected to cold-bending and straightening.
Between the two bend-out bar systems, the site-installed version (Model B) performs slightly better in both displacement and crack widths at an SLS and ULS. This enhancement could be the result of better aggregate interlock, as the concrete surface is roughened with the jack hammer when exposing the rebar. This is compared to the pre-assembled alternative (Model C), where the steel box is cast into the wall and prevents any concrete contact across the joint. The structural performance of both systems is, however, inferior to that of the continuous starter-bar system (Model A), and larger displacements and crack widths can be expected when using a bend-out system.
The performance of the cast-in anchor system (Model D) is very similar to the siteinstalled bend-out system at the SLS and ULS, but also does not perform on the same level as the continuous starter-bar system. Although the system did perform satisfactorily at the SLS and ULS, larger displacements and cracks should also be expected when using this system.
The following conclusions are drawn:
■ If the use of jump or slip formwork is not a requirement, any of the alternative systems can be used. Although the structural performance of the site-installed system is slightly superior and the material costs 47% less, practical considerations and project-specific aspects might be of greater influence when choosing the most desirable system. It is therefore recommended that the suitability of a specific alternative system should be evaluated against all the aspects for any given project.
■ If one of the bend-out systems is chosen, the design should be conducted with a modified yield stress and E-modulus for the flexural reinforcement in the joint. The recommended value for the yield stress is 0.8* fyand 150 GPa for the E-modulus. The design engineer should also strive to keep the elongation of the reinforcement in the connection to a minimum.
■ The size of the reinforcement to be used in any bend-out system should be limited to a diameter of 12 mm.
■ When using site-installed bend-out systems, good site supervision and quality control are necessary to ensure that the starter-bars are fixed securely and at the correct level. It is recommended that the future floor level is clearly indicated on the horizontal wall reinforcement to help identify starter-bars that are fixed out of place.
■ Care should be taken when chipping away the concrete surrounding the pre-bent rebar in the site-installed bend-out system. The pre-bent rebar should first be fully exposed, with at least 30 mm clear spacing behind the bend, before any form of straightening is considered. A steel pipe should be used to straighten the bars. The pipe should be placed over the reinforcement and continuously pushed inwards as far as possible, while straightening the rebar in one smooth motion. If the bar is not entirely straight after the first attempt, not more than one further adjustment should be considered.
■ Once the starter-bars are straightened, the concrete at the joint should be properly scabbled to ensure aggregate interlock. All starter-bars should be checked to verify that they have not been damaged in any way during the straightening process.
■ Any reinforcement that has been cold-bent past 45° should be considered to have a reduced capacity and ductility, and the design of the specific element should be checked, using the modified yield stress and E-modulus as recommended above.
■ The use of cast-in anchors could be a feasible option in highly congested walls or when larger moment capacities are required. The enhancing effect of the modified cone behaviour can be adopted to produce more economical designs, but once again larger deflections and cracks should be expected and accounted for.
■ The manufacturer's specifications and installation procedures should also be strictly followed when using the cast-in anchor system. A proper tightness check of all the continuation rebar should be conducted, before the fixing of the reinforcement for the floor commences. The tightness can be checked by using a standard hand wrench.
■ The thread at the end of the continuation reinforcement, supplied by the manufacturer, should be a size larger than the nominal diameter of the bar. Couplers with tapered threads should be avoided as they only obtain their tensile capacity when they are fully screwed in. The constant diameter couplers, as used in this study, gradually build up their capacity with each turn of the continuation bar.
REFERENCES
ACI (American Concrete Institute) 2008. ACI 318-08: Building Code Requirements for Structural Concrete and Commentary, Appendix D. Michigan, MI: ACI. [ Links ]
Ancon Building Products 2011. Reinforcement continuity systems for the construction industry -Eazistrip. Available at: http://www.ancon.co.uk (accessed in June 2016). [ Links ]
Ancon Building Products 2014. Reinforcement continuity systems for the construction industry - KSN Anchors. Available at: http://www.ancon.co.uk (accessed in June 2016). [ Links ]
Cairns, J 2010. Design analysis for moment connections with KS Threaded Anchors. Technical Report (unpublished). Edinburgh: Heriot Watt University. [ Links ]
CEB 1997. Design of Fastenings in Concrete. London: Thomas Telford. [ Links ]
Chun, S & Ha, T 2014. Cyclic behavior of wall-slab joints with lap splices of cold- straightened rebars and mechanical splices. Journal of Structural Engineering [Online], 141(2). [ Links ]
Deaton, J B 2013. Nonlinear finite element analysis of reinforced concrete exterior beam-column joints with nonseismic detailing. PhD thesis. Atlanta, GA: Georgia Institute of Technology. [ Links ]
Diana 2014. Diana User's Manual. Delft: TNO Diana. [ Links ]
GOM 2003. GOM Aramis User Manual. 3.11 Software, Vol. 49. Braunschweig, Germany: GOM. [ Links ]
JCSS (Joint Committee on Structural Safety) 2001. Probabilistic Model Codefor New and Existing Structures, Part 3.2 Limit State Function. Available at: http://www.jcss.byg.dtu.dk/-/media/Subsites/./img/revistas/jsaice/v59n3/probabilistic_model_code (accessed in June 2016). [ Links ]
NZS (New Zealand Design Codes) 2006. NZS 3101. Concrete Structures Standard. Part 1: 2006. The Design of Concrete Structures. Wellington, NZ: Standards New Zealand. [ Links ]
Robberts, J M & Marshall, V 2010. Analysis and design of concrete structures. Johannesburg: Nuclear Structural Engineering. [ Links ]
Rupasinghe, R & Nolan, É 2007. Formwork for Modern, Efficient Concrete Construction. Garston-Watford, UK: IHS BRE Press. [ Links ]
SANS (South African National Standard) 2000. SANS 10100-1:2000. The Structural Use of Concrete, Part 1: Design. Pretoria: SABS Standards Division. [ Links ]
SANS (South African National Standard) 2010. SANS 68921-1:2010. Metallic materials - Tensile Testing. Part 1: Method of Test at Room Temperature. Pretoria: SABS Standards Division [ Links ]
SANS (South African National Standard) 2011. SANS 920:2011. Steel Bars for Concrete Reinforcement. Pretoria: SABS Standards Division [ Links ]
SANS (South African National Standard) 2012. SABS 0144:1995. Detailing of Steel Reinforcement for Concrete, 2nd ed. Pretoria: SABS Standards Division. [ Links ]
Schreppers, G & Frissen, C & Kang, H 2011. Prediction of crack-width and crack-pattern. Delft: TNO Diana BV. [ Links ]
 Correspondence:
J D Gerber
Aurecon
POBox 494
Cape Town 8000
South Africa
T: +27 21 526 9513
E: johann.gerber@aurecongroup.com
G P A G van Zijl
Department of Civil Engineering
Stellenbosch University
Private Bag X1
Matieland 7602
South Africa
T: +27 21 808 4436
E: gvanzijl@sun.ac.za

JOHANN GERBER (MEng) received his Master's degree in Structural Engineering from Stellenbosch University in December 2016. He is currently employed at Aurecon and works in the Buildings Unit, Cape Town, as a structural engineer, specialising in the design and detailing of structural components in buildings.

PROF GIDEON VAN ZIJL (DEng, PrEng) is professor of Structural Engineering at Stellenbosch University. His research interests are structural and computational mechanics, structural durability and advanced cement-based construction materials. Concurrently, structural design guidelines for cement-based construction materials are developed in his research group, the Centre for Development of Sustainable Infrastructure (CDSI).

