


Services on Demand
Article
 English (pdf)
 Article in xml format
 Article references
Indicators

Related links
-
 Cited by Google
 -
 Similars in Google
Share

 Permalink
Journal of the South African Institution of Civil Engineering
On-line version ISSN 2309-8775
Print version ISSN 1021-2019
J. S. Afr. Inst. Civ. Eng. vol.59 n.3 Midrand Sep. 2017
http://dx.doi.org/10.17159/2309-8775/2017/v59n3a4
TECHNICAL PAPER
Exploring the relationship between vertical and lateral forces, speed and superelevation in railway curves
A F Powell; P J Gräbe
ABSTRACT
The research described in this paper is based on an experiment which involved running a test train through a curve at various speeds, changing the cant of the curve by tamping and repeating the train runs. The cant was changed due to high wheel wear rates. The curve already had a cant deficiency, and this cant deficiency was subsequently increased by reducing the curve's cant. Assessing the before and after tamping test data validated the existence of the expected relationships between the vertical and lateral rail forces, the speed and the cant. The change in cant had a minimal effect on the magnitude of the vertical forces, although a transfer of loading between the high and low legs did occur. The theory indicates that the 14% reduction in cant in this curve, given all of the other curve characteristics, should have resulted in an increase in the lateral forces. There was, however, a roughly 50% reduction in the maximum lateral forces, after the cant had been reduced, which can be explained from a train dynamics point of view. In addition, there was an increase in safety, due to a reduced derailment ratio at this curve's normal operating speed of 85 km/h. It is not unreasonable to presume that a 50% reduction in the maximum lateral forces could lead to a halving of the wear rate of the rail and wheels in this curve, with similar results to be expected in other curves on the rail network.
Keywords: vertical forces, lateral forces, superelevation (or cant), speed
INTRODUCTION
Track geometry is a critical facet of any railway system, directly affecting the performance of the railway track itself and the behaviour of the railway vehicles using the system. Superelevation (also known as cant) is the term used to denote the raising of the outer rail on curved track to allow higher speeds than if the two rails were level. In curves, cant is one of the most important track geometry parameters, which can change the wheel/rail contact relationship and then influence the dynamic interaction (Wang et al 2013), including the vertical and lateral forces experienced by both the track and the railway vehicles.
This paper presents an investigation into the relationship between vertical and lateral forces, speed and cant in railway curves that was undertaken on the Gautrain Rapid Rail Link.
BACKGROUND
The Gautrain Rapid Rail Link is a rail transit system that links the two cities of Johannesburg and Pretoria in the province of Gauteng, South Africa. The system also provides an airport service between Johannesburg and the OR Tambo International Airport. Travelling at speeds of up to 160 km/h, the Gautrain system is the first of its kind in South Africa, and in fact in Africa. The Gautrain airport service has been operational since June 2010 and the commuter service has been operational since August 2011. The relative newness and uniqueness of this state-of-the-art railway engineering project in the South African context therefore provided an excellent opportunity for carrying out this research.
After the opening of the Gautrain system the initial wear rates of the Gautrain wheels were higher than expected. Specifically the wheel flange wear resulted in more frequent wheel re-profiling needing to be done than originally planned as part of the maintenance schedules. Assuming that the track gauge of a railway system is within an acceptable tolerance range (which is the case for the Gautran system), then it is known that wheel flange wear predominantly takes place in curves.
An experimental curve was selected and this curve was found to be experiencing high leg contact to the gauge side of the rail, while the low leg contact was to the field side of the rail. In order to move the high leg contact band away from the gauge side of the rail, the cant needs to be reduced (as was done in this research) or alternatively the operational speed of the train needs to be increased. The curve already had a cant deficiency, and this cant deficiency was subsequently increased by reducing the curve's cant.
CANT
Descriptions, figures and the derivations of the various formulae used in this discussion of cant are taken from Lindahl (2001) and Esveld (2001), unless stated otherwise.
Cant is the difference in elevation between a point on one rail and elevation of a point on the other rail measured along a line perpendicular to the track centre line as indicated in Figure 1. Also shown in Figure 1 is twist, which is the difference in elevation of two points, one on either rail, a fixed distance apart along the length of the track, as indicated. The distance between the two points is referred to as the twist base.
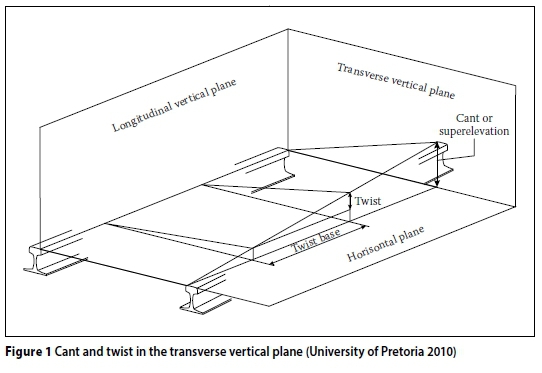
Cant compensates for the centrifugal force arising from a train traversing a curve. If a track was canted to the level required for the maximum speed of the fastest train, the level of tilt would be too high for a slower train. A compromise degree of cant is therefore used, known as 'cant deficiency'.
From a curving point of view, a stationary train in a curve with cant, will be experiencing overbalance in the form of an excess of cant, at which point the train will be experiencing negative lateral accelerations, and given a situation with sufficient cant excess, the stationary train may roll over to the inside of the curve.
As the train's speed increases from stationary, this overbalance situation (cant excess) will reduce up until the speed where a balance is achieved, at which point the train will be experiencing zero lateral accelerations.
Train speeds beyond the balance speed will result in the train experiencing underbalance in the form of a deficiency of cant, at which point the train will be experiencing positive lateral accelerations, and, given a situation with sufficient cant deficiency, the train may derail due to rail roll over, the car rolling over or simply derailing to the outside of the curve.
The balance speed is the speed at which the compensation due to cant balances the acceleration due to curving. Relative to the track plane, the perceived lateral acceleration is then zero. The cant which gives lateral accelerations equal to zero at a given radius (R) and given vehicle speed (v) is called the equilibrium cant (heq) and is calculated by Equation 1.
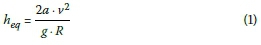
where 2a = effective gauge (for the Gautrain standard rail gauge of 1.435 m, 2a ≈ 1.500 m).
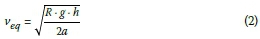
The equilibrium speed, or balance speed (veq), is the vehicle speed at which lateral accelerations are equal to zero for a given radius (R) and a given cant (h), and is given by Equation 2.
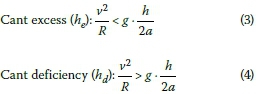
At speeds under the balance speed, cant excess exists, meaning the track has excessive cant for the present speed. With cant excess, perceived accelerations are to the inside of the curve. At speeds over the balance speed, cant deficiency exists, meaning the track has insufficient cant for the present speed. With cant deficiency, perceived accelerations are to the outside of the curve.
Cant excess and cant deficiency can be mathematically represented by means of Equations 3 and 4.
EXPERIMENTAL WORK
The basis of the investigation was to determine how to minimise wheel and rail wear by optimising the interaction between the wheel and rail, with the focus of the investigation being the relationship between cant and speed. The experimental work involved running a test train through a curve at various speeds, changing the cant of the curve by tamping and repeating the train runs.
Characteristics of the experimental curve
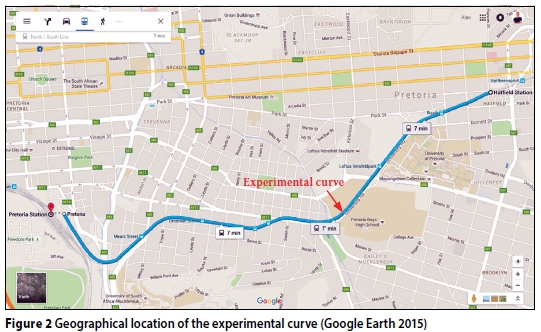
Two test sites, 40 m apart in the same curve, were instrumented with strain gauges to measure the vertical and lateral forces being exerted on the rail by the wheels of a train at different track cants as the train ran through the curve at different speeds. The selected curve was on the Gautrain line between Pretoria and Hatfield stations. Pretoria Station has an operational chainage of km 0.000, while Hatfield Station has an operational chainage of km 5.425. Site 1 (S1) was located at km 3.215 and Site 2 (S2) was located at km 3.175. Figure 2 indicates the geographical location of the selected experimental curve on the Pretoria to Hatfield Gautrain line.
The selected curve had a design horizontal radius of 405 m, a design cant of 120 mm, a design operational speed of 85 km/h, and a circular curve length of 318 m, with 100 m transition curves on either side of the circular curve.
Strain gauge measurements
The base chevron strain gauge configuration method (as can be seen in Figure 3) was used for the measuring of vertical and lateral forces. The base chevron method is an alternative to the more widely used web bending strain gauge configuration method (as can be seen in Figure 4).
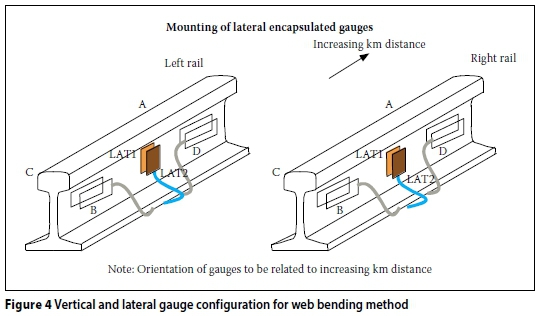
The base chevron method and the web bending method both measure the vertical forces in the same way by means of attaching the vertical gauges to the web of the rail. With regard to the measurement of lateral forces, however, the two methods differ in that, when using the base chevron method, the lateral gauges are attached to the foot of the rail, while the web bending method measures lateral forces by means of attaching the lateral gauges in a vertical orientation on the web of the rail.
It is believed that the web-bending technique of strain gauging the rail to measure the lateral rail force is subject to cross talk from the vertical rail force. The initial results of tests conducted by Transnet Freight Rail (Reitmann 2013) indicate that the base chevron method measures lateral forces more accurately.
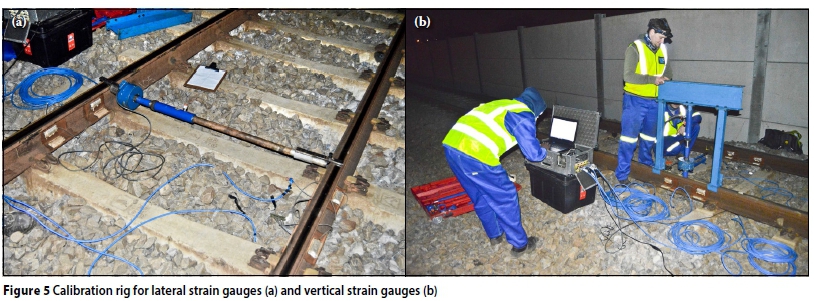
Calibrations for the vertical strain gauges and lateral strain gauges were undertaken using a loadtech 10 t load cell, model LT200, and a 10 t hydraulic jack. The lateral calibration rig can be seen in Figure 5(a), while the vertical calibration rig can be seen in Figure 5(b). The amplification instrument used with the strain gauges was a Quantum X, MX840A 8-channel universal amplifier, and the collection of data throughout the experimental process was done at a sampling rate of 1 200 Hz.
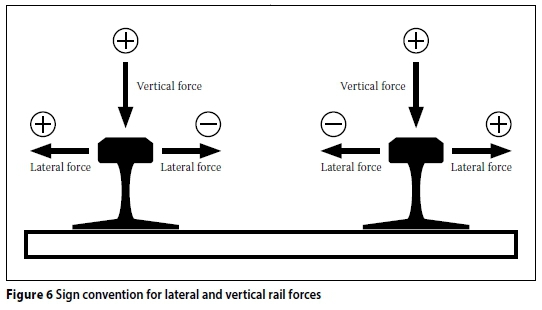
In terms of sign convention for the lateral forces, any force pulling the outer or inner rail of the curve towards the middle of the track was considered to be a negative force, while any lateral force to the outside of the track was considered to be positive. For the vertical forces, any force pushing down onto the rail was considered to be positive. From a practical point of view, rails should never experience a negative vertical force, with the smallest force that they should be exposed to being 0 in the case of a wheel totally lifting (unloading) off the track, for example during a derailment. Figure 6 illustrates a simple longitudinal view of the described sign convention for the lateral and vertical forces.
Cant of the experimental curve
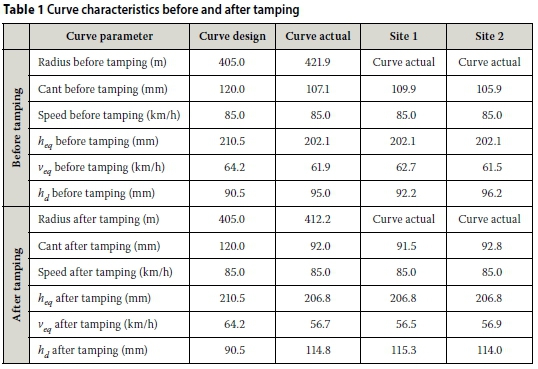
Cant measurements before and after tamping for the experimental curve were collected by means of a laser-based Track Geometry Measuring System (TGMS). Spot cant measurements for comparison purposes were also taken using a handheld track gauge, and these spot measurements were in agreement with the TGMS measurements. Table 1 shows the various curve characteristics of interest (both measured and calculated) before and after tamping.
The decision to reduce the cant, thereby further increasing the cant deficiency in the curve, was made based on on-board train observations that, at the normal operating speed of the test curve, the wheels were generating flanging noise emanating from the low leg. Top-of-rail noise is significantly different in nature to flanging noise, and the side of the train from which the noise was emanating indicated low leg flanging. This same observation had already been detected by the Gautrain track maintenance teams (also through on-board train observations), which is why the curve cant before tamping was already set to a lower value than the design value of 120 mm.
Characteristics of the test trains
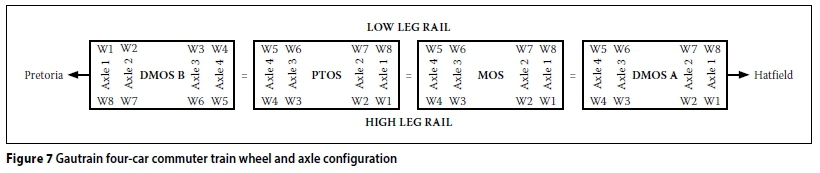
A typical Gautrain Bombardier Electrostar four-car commuter train set was used for the test runs through the instrumented experimental curve. The standard Gautrain four-car commuter train configuration is as follows (descriptions of the car names are given in Table 2):
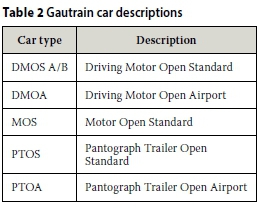
DMOS A + MOS + PTOS + DMOS B
Figure 7 shows the configuration of the wheels (W) and axles on the four-car commuter train.
Test train runs
For the before-tamping tests a test train was run through the experimental curve at speeds varying from 10 km/h to 110 km/h in 10 km/h increments. For the after-tamping tests the speeds varied from 10 km/h to 105 km/h in 10 km/h increments, with the final sets of test runs being done at 100 km/h and 105 km/h. A speed of 105 km/h was set as the limit for the after-tamping test runs, due to the decreased cant and the extraordinarily high risks associated with taking a train at too high a speed through a curve. The on-site conditions needed to be taken into account, with the possibility of track irregularities, such as proud or dipped welded rail joints and track geometry defects. Travelling from Hatfield towards Pretoria, the curve that immediately follows the experimental curve (see Figure 2) has a design radius of 264.5 m and is curved in the opposite direction to the experimental curve, and therefore the test trains running in this direction needed to slow down sufficiently to safely negotiate this adjacent curve. Travelling in the opposite direction the trains also needed a sufficient length of track once exiting this adjacent curve in order to get up to the target speed before reaching the experimental curve. These various on-site conditions therefore governed the maximum test speeds of 110 km/h and 105 km/h before and after tamping respectively. In order to have some data redundancy, at least two test runs were done in each direction as close to each target speed as possible, and the required data was successfully collected for all the test runs. For the purpose of detailed data analysis, one run in each direction at each speed for test runs before and after tamping was selected based on which of the test runs was closest to the target speed.
The test train drivers attempted to accurately achieve the target speed for each test run, but given the nature of train handling, achieving the exact target speed was not practically possible. Therefore, in order to accurately determine the speed of each test run, the distance between Axle 1 of DMOS A and Axle 1 of DMOS B (75.843 m), as well as the time taken from the recording of the greatest vertical and lateral forces on the high and low legs at each of these two axles, was taken. This then allowed an accurate assessment of the relationship between the vertical and lateral forces, speed and superelevation in the experimental curve.
For testing purposes, directions were also assigned to the various test train runs. Trains running through the experimental curve from Hatfield towards Pretoria were considered as being in the "Down" direction, while trains running through the experimental curve from Pretoria towards Hatfield were considered as being in the "Up" direction.
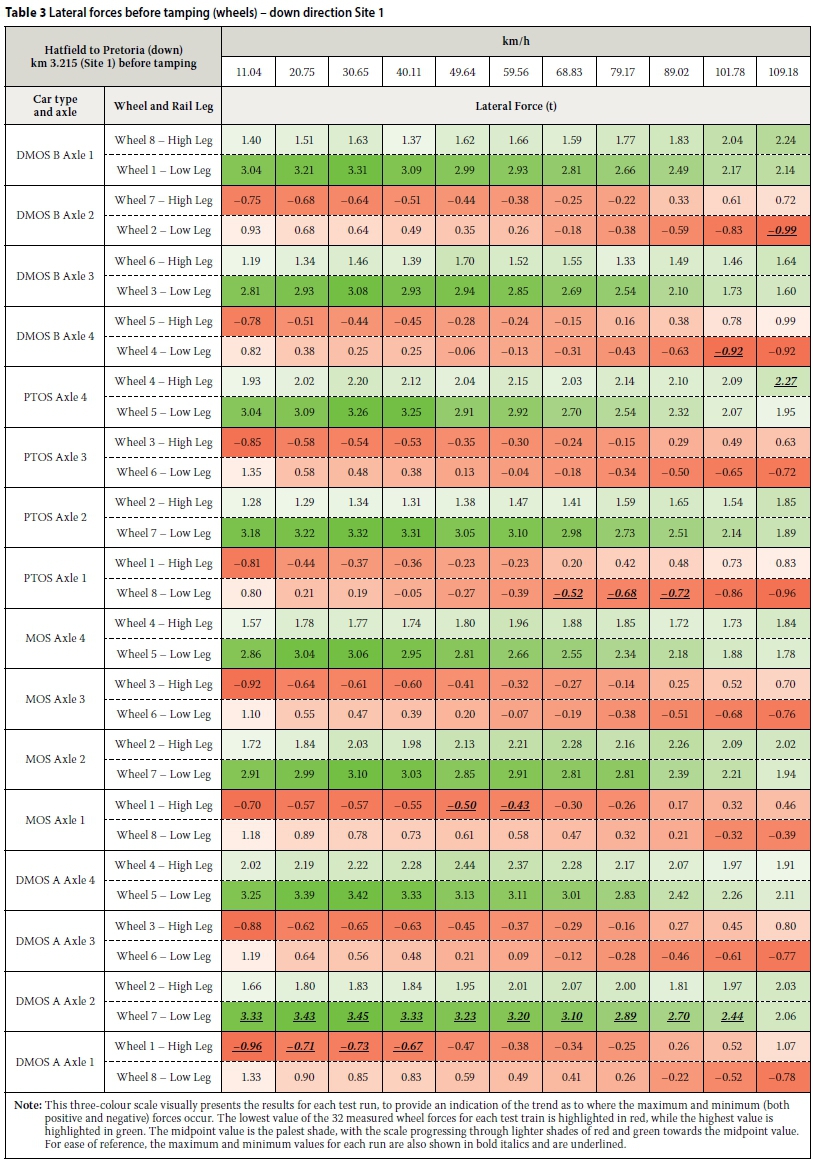
DATA COLLECTION
The data collected from each test run was assessed to determine the maximum and minimum (both positive and negative) forces that occurred at each wheel on the test train at each test run speed. A tabular representation of the assessed before-tamping lateral force data for a test train travelling from Hatfield to Pretoria at Site 1 is shown in Table 3 (on page 30). A three-colour scale was used to visually present the results for each test run, in order to provide an indication of the trend as to where the maximum and minimum (both positive and negative) forces occur. The lowest value of the 32 measured wheel forces for each test train is highlighted in red, while the highest value is highlighted in green. The palest shade shows the midpoint value, with the scale progressing through lighter shades of red and green towards the midpoint value. For ease of reference, the maximum and minimum values for each run are also shown in bold italics and are underlined.
All in all a total of 16 such tables were generated from the collected data, covering both vertical and lateral forces, before and after tamping, in the up and down train travelling directions at Sites 1 and 2.
In order to interpret the measured data, a selection process had to be undertaken in order to assess which wheels, on which axle, on which bogie and on which car were contributing to the greatest loadings (both positive and negative) on each rail leg.
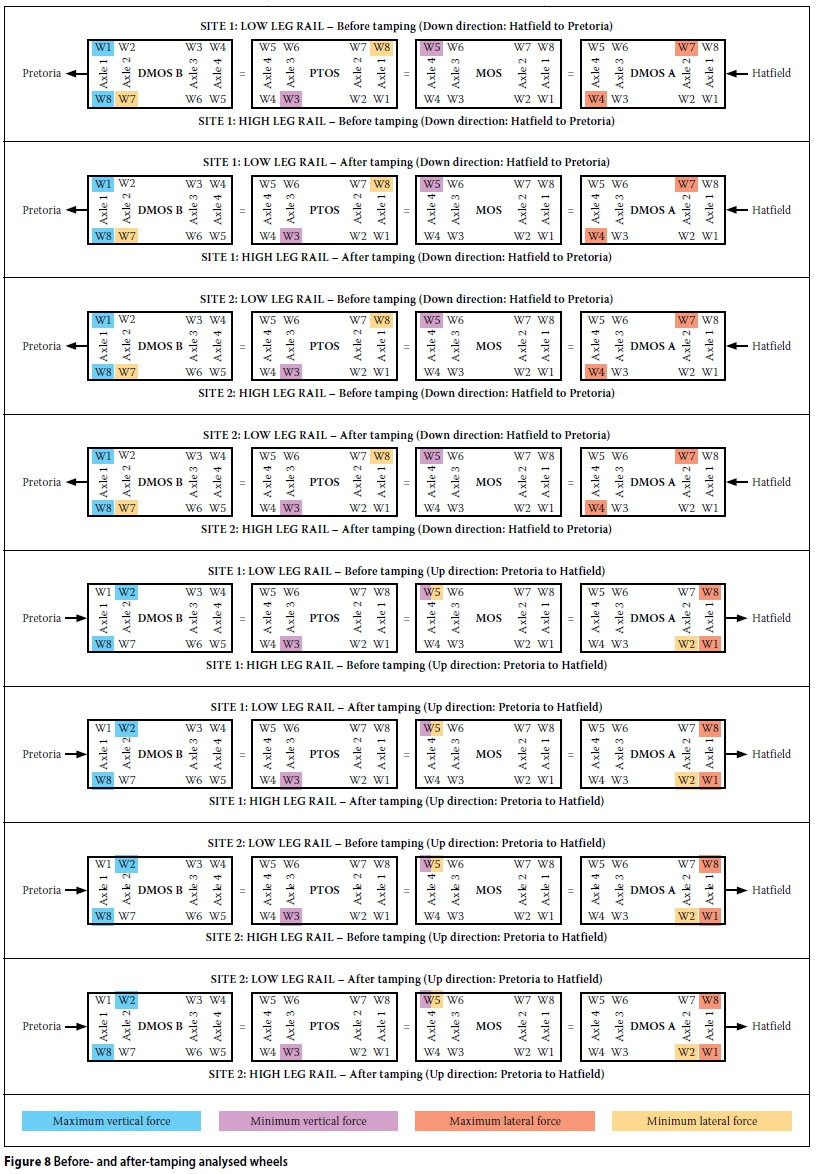
As a starting point the before-tamping data was analysed in order to determine which wheels to focus the analyses on, and from the before-tamping wheel selections the same wheels were assessed after tamping and compared to the before-tamping results. Figure 8 (on page 31) shows which wheels were chosen for analyses for the test runs in the down and up directions.
The locations of the various analysed wheel positions, specifically with reference to the direction in which the test trains were travelling, are discussed below.
Maximum and minimum vertical force wheel positions
The maximum vertical force on the high leg remained in the absolute same bogie, axle and wheel position (DMOS B 8) on the train for both directions of travel. In the down direction DMOS B 8 was on the leading axle of the leading bogie of the leading vehicle of the four-car train (DMOS B), whereas in the up direction DMOS B 8 was on the trailing axle of the trailing bogie of the rear vehicle of the four-car train (DMOS B).
The maximum vertical force on the low leg remained in the absolute same bogie position, and remained in the same relative axle position in relation to this bogie, namely DMOS B 1 in the down direction and DMOS B 2 in the up direction. In the down direction DMOS B 1 was on the leading axle of the leading bogie of the leading vehicle of the four-car train (DMOS B), whereas in the up direction DMOS B 2 was on the leading axle of the trailing bogie of the rear vehicle of the four-car train (DMOS B).
The minimum vertical force on the high leg remained in the absolute same bogie, axle and wheel position (PTOS 3) on the train for both directions of travel. In the down direction PTOS 3 was on the trailing axle of the leading bogie of the second vehicle of the four-car train (PTOS), whereas in the up direction PTOS 3 was on the leading axle of the trailing bogie of the third vehicle of the four-car train (PTOS).
The minimum vertical force on the low leg remained in the absolute same bogie, axle and wheel position (MOS 5) on the train for both directions of travel. In the down direction MOS 5 was on the leading axle of the leading bogie of the third vehicle of the four-car train (MOS), whereas in the up direction MOS 5 was on the trailing axle of the trailing bogie of the second vehicle of the four-car train (MOS).
In summary it is therefore interesting to note that, of the four vertical forces under consideration (vertical, maximum and minimum for both the high leg and the low leg), three of them (DMOS B 8, PTOS 3 and MOS 5) stayed in the exact same absolute position on the train for both the down and the up directions, while the other one (DMOS B 1 vs DMOS B 2) stayed in the absolute same bogie position and the same relative axle position in relation to this bogie for the down versus the up direction.
Maximum and minimum lateral force wheel positions
The maximum lateral force on the high leg remained in the same relative position (DMOS A 4 vs DMOS A 1) on a specific vehicle for the down versus the up direction. In the down direction DMOS A 4 is on the leading axle of the leading bogie of the trailing vehicle of the four-car train (DMOS A), whereas in the up direction DMOS A 1 is on the leading axle of the leading bogie of the leading vehicle of the four-car train (DMOS A).
The maximum lateral force on the low leg remained in the same relative axle position on the same bogie on the same vehicle (DMOS A 7 vs DMOS A 8) for the down versus the up direction. In the down direction DMOS A 7 was on the leading axle of the trailing bogie of the rear vehicle of the four-car train (DMOS A), whereas in the up direction DMOS A 8 was on the leading axle of the leading bogie of the leading vehicle of the four-car train (DMOS A).
The minimum lateral force on the high leg remained in the same relative position (DMOS B 7 vs DMOS A 2) on the train for both directions of travel. In the down direction DMOS B 7 was on the trailing axle of the leading bogie of the leading vehicle of the four-car train, whereas in the up direction DMOS A 2 was on the trailing axle of the leading bogie of the leading vehicle of the four-car train.
The minimum lateral force on the low leg remained in the same relative position (PTOS 8 vs MOS 5) on the train for both directions of travel. In the down direction PTOS 8 was on the trailing axle of the trailing bogie of the second vehicle of the four-car train, whereas in the up direction MOS 5 was on the trailing axle of the trailing bogie of the second vehicle of the four-car train.
In summary it is therefore interesting to note that, of the four lateral forces under consideration (lateral, maximum and minimum for both the high leg and the low leg), none of them stayed in the exact same absolute position on the train for both the up and the down directions. Instead, two of them (DMOS B 7 vs DMOS A 2 and PTOS 8 vs MOS 5) stayed in the same relative position on the train for the down versus the up direction. One of them (DMOS A 4 vs DMOS A 1) stayed in the same relative position on a specific vehicle for the down versus the up direction. The last one (DMOS A 7 vs DMOS A 8) stayed in the same relative axle position on the same bogie on the same vehicle for the down versus the up direction.
DATA INTERPRETATION
From the collected data, the measured maximum and minimum wheel force data could be summed (while ensuring that sign convention was taken into account) to assess the collected experimental data from a bogie, individual car and four-car train point of view, in addition to the assessed wheel force data. Balancing force graphs for the vertical and lateral forces at the various speeds could then be plotted for all levels of assessed data. Adding trend lines, and determining the equations of these trend lines, allowed for the intersection points between the high and low leg, and the vertical and lateral forces before and after tamping to be determined.
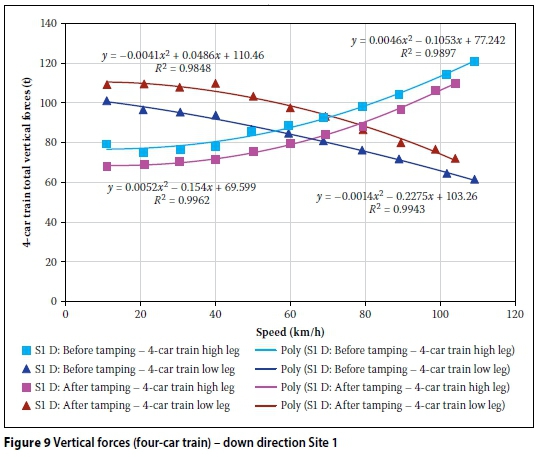
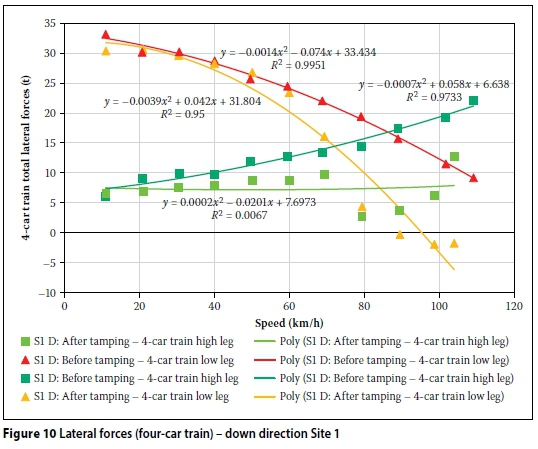
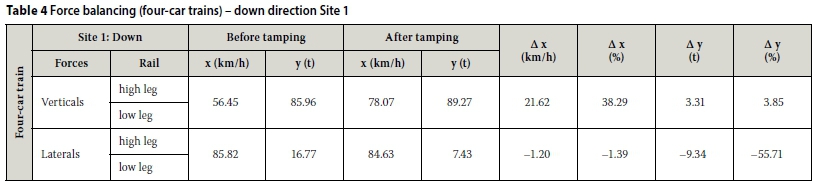
Figures 9 and 10 provide examples of these plots for Site 1 in the down direction, showing both the before- and after-tamping vertical force data (Figure 9) and lateral force data (Figure 10) for a four-car train. Solving for the trend lines shown on Figures 9 and 10 yields the force balancing information shown in Table 4. With reference to Table 4, for Site 1 in the down direction the balanced vertical force generated by the four-car train as a whole for the high and low leg was 85.96 t at a speed of 56.45 km/h before tamping and 89.27 t at a speed of 78.07 km/h after tamping. For the lateral forces the balanced lateral force generated by the four-car train as a whole for the high and low leg was 16.77 t at a speed of 85.82 km/h before tamping and 7.43 t at a speed of 84.63 km/h after tamping.
Similar detailed assessments were done at wheel, bogie, car and four-car train level for both sites, in both directions and the summarised results of these analyses are presented in the Results and Discussion section below.
Discontinuities that can be seen in Figures 9 and 10 most likely arise from one of the following situations:
■ Under certain operating conditions train wheels may not simultaneously find their desired or preferred running path, and then enter into a state of hunting in order to try and achieve their preferred running path, with hunting oscillation being defined as a periodic motion in lateral displacement. Hunting could therefore have a significant effect on the lateral loads, and to a certain degree the vertical loads as well, dependent on the wheel positions on the rail heads of both the high and low legs at the location of the strain gauges.
■ Driver behaviour, such as braking or accelerating in the vicinity of the strain gauges, could also influence the measured values, thus also undermining a good coefficient of determination value for the data (shown in Figures 9 and 10 as R2), while nonetheless still providing insights into the general trend line shapes, albeit with a less than ideal R2value. In this experiment the drivers were cautious not to compromise the integrity of the data, driving as consistently as possible, but nonetheless, varying a train's speed from 10 - 110 km/h through a 318 m long curve will invariably incorporate some inconsistencies between test runs.
■ With specific reference to the analysis dealing with lateral forces, possible explanations for discontinuities in the data could be due to the low forces involved when dealing with lateral forces. One train could measure a maximum lateral wheel force of -0.5 t, while the next train measures a maximum lateral wheel force of +0.5 t, which is only an absolute difference of 1 t, but equates to a 200% increase in force. Several train runs could then fluctuate between negative and positive values, which would have a noticeably detrimental effect on the R2 value.
RESULTS AND DISCUSSION
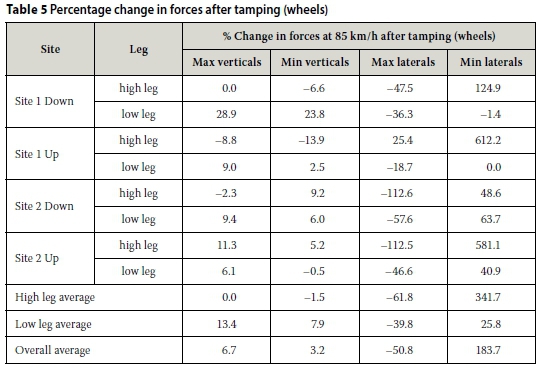
The operational speed of the experimental curve is one of the variables that remained constant both before and after tamping, and there is no intention of changing the operational speed, due to the effect that this will have on the timetable, signalling system, etc. Therefore the specific effect that changing the cant had on the rail forces at a train speed of 85 km/h was assessed in detail, and the percentage change in vertical and lateral forces after tamping at wheel level are shown in Table 5, and at wheel, bogie, car and four-car train level in Tables 6 and 7 respectively.
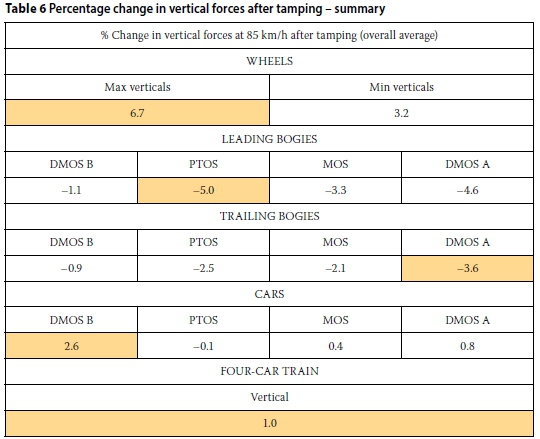
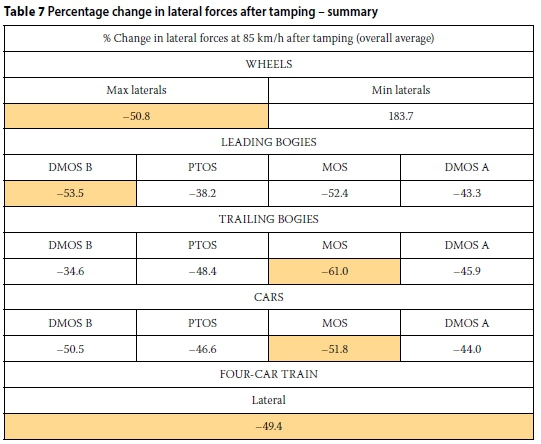
In Tables 6 and 7 the highlighted values indicate the largest changes at each level of assessment. The summarised information presented in Tables 6 and 7 shows good consistency between the changes in vertical and lateral forces at the various levels of assessment (wheel, bogie, car and four-car train). Although the changes in vertical and lateral forces after tamping were not empirically predictable, the relatively small range of the after-tamping vertical force changes (-5.0% to 6.7%) and the relatively small range of the after-tamping lateral force changes (-61.0% to -50.8%) indicates that the data at the various levels of assessment is reliable.
Vertical forces
The reduction of cant had a minimal effect on the magnitude of the vertical forces, but did result in a transfer of loading between the high and low legs.
With reference to Table 5 there was a 6.7% increase in the maximum vertical wheel forces after the cant had been reduced, a 5% reduction in the maximum vertical leading bogie forces, a 3.6% reduction in the maximum vertical trailing bogie forces, a 2.6% increase in the maximum vertical car forces and a 1.0% increase in the maximum vertical four-car train forces.
The minimum vertical forces are of less interest, as only positive vertical forces are measured (see Figure 6), therefore the various minimum vertical forces that were assessed in detail throughout the research are covered by default when interpreting the maximum vertical forces experienced by the rail.
Lateral forces
The most significant finding when comparing the before- and after-tamping results was that, while the theory indicates that the reduction of the cant in this specific test curve, given all the other curve characteristics, should have resulted in an increase in the lateral forces, there was in fact a roughly 50% reduction in the lateral forces.
With reference to Table 7 there was a 50.8% reduction in the maximum lateral wheel forces after the cant had been reduced, a 53.5% reduction in the maximum lateral leading bogie forces, a 61.0% reduction in the maximum lateral trailing bogie forces, a 51.8% reduction in the maximum lateral car forces and a 49.4% reduction in the maximum lateral four-car train forces.
For the lateral forces data, the maxima and minima were of much more interest than for the vertical forces data, as negative lateral forces made up a significant proportion of the data collected, due to the fact that the sign of the force indicates in which direction the lateral force was acting on the rail (see Figure 6). Assessing the minimums therefore covered all of the forces to the inside of the rail.
Cant and train dynamics
In terms of the applied cant it was shown by Elkins and Eickhoff (1982) that an increase in cant deficiency makes both wheelsets run further out in a curve, to reduce the angle of attack of the leading wheelset and bring about a small negative angle of attack of the trailing wheelset. Expressed from a different perspective, Fröhling (2012) explains that cant excess reduces the curving performance of rolling stock, due to the inner wheel running on a larger radius than the outer wheel in a curve with cant excess.
Grassie and Elkins (2005) also mention how cant deficiency has a favourable effect on curving performance, due to the fact that cant deficiency brings about a change in distribution of tangential force between wheels, so that there is a more even distribution of creep forces and for all but the highest levels of tractive effort, traction on the high-rail wheels is lower than that on the low-rail wheels. As a result of the more even distribution of tangential force, the traction ratios overall are lower than for curving at balance speed. Grassie (2012) went on further to state that rail maintenance would be reduced if mixed traffic lines were canted for lower-speed freight traffic than for higher-speed passenger traffic. The converse is common, if not universal, practice.
Cant and derailment ratio analysis
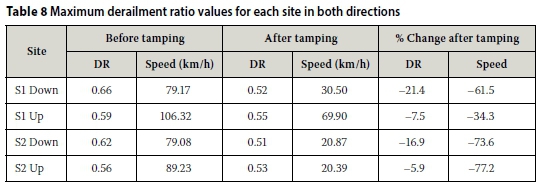
To estimate vehicle safety one can analyse the possibility of derailment. Various formulae exist as a guide for the derailment process, which gives the ratio between lateral and vertical forces for a particular wheel/rail combination. This ratio, usually called the "derailment ratio", is calculated by dividing the lateral forces by the vertical forces at the flange contact. The derailment ratio is used as a measure of the running safety of railway vehicles (Esveld 2004). According to UIC leaflet 518, a maximum derailment ratio value of 0.8 over 2 m is considered to be safe (UIC 2005).
Using the measured vertical and lateral wheel forces data as presented in Table 3, a derailment ratio (DR) analysis was under-taken to assess the running safety of the test trains through the experimental curve before and after tamping. The derailment ratio was calculated by dividing the maximum measured lateral forces by the maximum measured vertical forces for each wheel at each test train run speed. Using the maximum lateral and vertical forces for each wheel may not strictly give the worst-case scenario in terms of a derailment ratio, but does provide a good indication of what effect tamping had on the derailment ratio.
Table 8 indicates the maximum derailment ratio values for each site in both directions. As a derailment ratio of less than or equal to 0.8 over 2 m is considered to be safe, all the calculated derailment ratios in this case are considered to be safe.
CONCLUSIONS
The body of theoretical first principles knowledge with regard to the negotiation of a curve by a train is extensive, comprehensive and technically sound from a physics point of view. Accurately reproducing and/or measuring the expected data from a train negotiating a curve is, however, difficult to achieve. Furthermore, it is difficult to simultaneously assess vertical and lateral forces. As presented in this article, vertical and lateral forces need to be analysed separately, with separate balancing forces and balancing speeds being calculated for each one. This implies that an overarching equilibrium speed would be very difficult to achieve in practice, as a multitude of factors lead to variations in the vertical and lateral forces experienced by the rail.
The reduction of cant did result in a significant reduction in the lateral forces experienced by the curve, while having a negligible effect on the vertical forces. This outcome was counterintuitive to what was theoretically expected from a track perspective, but could be explained from a train dynamics point of view.
The cant of the curve before tamping was 107.1 mm, and this was reduced to 92.0 mm after tamping, which equates to a 14% reduction in cant. Assessing the percentage change in forces at wheel level at the operation speed of 85 km/h (see Table 5) revealed the following results for this 14% reduction in cant:
■ There was a zero net effect on the average maximum vertical high-leg forces, with a corresponding 13.4% increase in the maximum vertical low-leg forces. The average maximum vertical forces increased by 6.7%.
■ As discussed previously, the minimum vertical forces are of less interest, as only positive vertical forces are measured (see Figure 6).
■ An average reduction of 50.8% in maximum lateral forces was measured, with a 61.8% reduction in the maximum lateral high-leg forces and an average 39.8% reduction in the maximum lateral low-leg forces.
■ There are some large percentage changes in the minimum lateral forces (a 612.2% increase at Site 1 in the up direction on the high leg and a 581.1% increase at Site 2 in the up direction on the high leg). Assessing the absolute values of these changes, however, reveals that all the minimum lateral forces are between -1 t and 1 t, therefore the forces themselves are small, but the percentage changes relative to the small force are large.
From the above results it is significant to take note of the 50.8% reduction in maximum lateral wheel forces that occurred as a result of the 14% reduction in cant, as well as the 53.5% reduction in the maximum lateral leading bogie forces, the 61.0% reduction in the maximum lateral trailing bogie forces, the 51.8% reduction in the maximum lateral car forces and the 49.4% reduction in the maximum lateral four-car train force (see Table 7).
The wear of rail and wheels is strongly linked to the magnitude of forces that they experience. Although other factors also need to be taken into account, it is not unreasonable to presume that a 50% reduction in maximum lateral forces could lead to a halving of the wear rate of the rail and wheels in this curve.
Assessing vehicle safety by analysing the before- and after-tamping derailment ratio (see Table 7) revealed that tamping reduced the maximum derailment ratio at both sites and in both directions of travel, indicating that, from a running safety point of view, reducing the cant of the experimental curve made the running of trains through this curve safer. The speed at which the maximum derailment ratios were measured also all reduced after tamping, meaning that for this curve's normal operating speed of 85 km/h there has been an increase in safety due the risk of derailment having been reduced.
ACKNOWLEDGEMENTS
The Chair in Railway Engineering at the University of Pretoria (sponsored by Transnet Freight Rail) is gratefully acknowledged for technical input, financial support, as well as the use of various equipment items and facilities during the course of the study. The authors also wish to thank the Chair in Railway Engineering's 2015 team of research assistants (Mr P Vorster, Mr R Vandoorne, Mr R du Plooy and Mr A Ronda), as well as the Wayside and Services teams at Bombela Maintenance (Pty) Ltd for their invaluable assistance.
NOTES
Due to the volume of data collected as part of this investigation, only a snapshot of the results could be presented in this paper, with the primary aim being to relay the effect that changing the cant had on the track forces in the experimental railway curve in question. The detailed data and results analyses form part of a Masters in Engineering dissertation titled "An investigation into the relationship between vertical and lateral forces, speed and superelevation in railway curves", submitted to the University of Pretoria in November 2016 by the first author, AF Powell, under the supervision of Prof PJ Gräbe.
REFERENCES
Elkins, J A & Eickhoff, B M 1982. Advances in nonlinear wheel/rail force prediction methods and their validation. Journal of Dynamic Systems, Measurement, and Control, 104(2): 133-142. [ Links ]
Esveld, C 2004. Investigation of the train accident on 22 July 2004 near Pamukova, Turkey. Zaltbommel, Netherlands: ECS. [ Links ]
Esveld, C 2001. Modern Railway Track. Delft, Netherlands: MRT-Productions. [ Links ]
Fröhling, R 2012. Cant and maximum permissible speed in curves between Piet Retief and RBCT. Pretoria: Transnet Freight Rail. [ Links ]
Grassie, S L 2012. Traction, curving and surface damage of rails. Part 2: Rail damage. Proceedings, 9th International Conference on Contact Mechanics and Wear of Rail/Wheel Systems, 27-30 August, Chengdu, China. Elsevier, 1-8. [ Links ]
Grassie, S L & Elkins, J A 2005. Tractive effort, curving and surface damage of rail. Part 1. Forces exerted on the rails. Wear, 258: 1235-1244. [ Links ]
Lindahl, M 2001. Track geometry for high-speed railways. Stockholm, Sweden: Royal Institute of Technology. [ Links ]
Reitmann, E 2013. Vertical load cross-talk investigation on web-bending vs base-chevron lateral force measurement techniques. Pretoria: Transnet Freight Rail. [ Links ]
UIC (International Union of Railways) 2005. UIC Code 518 2005. Testing and Approval of Railway Vehicles from the Point of View of their Dynamic Behaviour -Safety - Track Fatigue - Ride Quality. Paris: UIC. [ Links ]
University of Pretoria 2010. Introductory course on multi-disciplinary concepts in railway engineering. Course notes. Pretoria: Continuing Education -University of Pretoria. [ Links ]
Wang, P, Gao, L & Hou, B-W. 2013. Influence of rail cant on wheel-rail contact relationship and dynamic performance in curves for heavy haul railway. Applied Mechanics and Materials, 365-366: 381-387. [ Links ]
 Correspondence:
A F Powell
Bombela Maintenance (Pty) Ltd
Gautrain Depot
Waterval K60 Road
Midrand
South Africa
T: +27 11 253 0136
E: alex.powell@bombardiersa.co.za
P J Gräbe
Transnet Freight Rail Chair in Railway Engineering
Department of Civil Engineering
University of Pretoria
Pretoria 000'
South Africa
T: +27 12 420 4723
E: hannes.grabe@up.ac.za

ALEX POWELL is an Associate Member of the South African Institution of Civil Engineering and a Candidate Engineer with the Engineering Council of South Africa. He obtained the following degrees: BEng Civil Engineering, BEng Hons Geotechnical Engineering, BEng Hons Environmental Engineering, and MEng Transportation Engineering. He has been employed by Bombela Maintenance (Pty) Ltd since 2012 as the track engineer responsible for technical inputs regarding track maintenance on the Gautrain Rapid Rail Link. He started his career in railway engineering in 2006 at Transnet Freight Rail in their Track Testing Centre in Jeppestown, Johannesburg, and was with Transnet Freight Rail until his move to Bombela Maintenance (Pty) Ltd.

PR0F HANNES GRÄBE Pr Eng, FSAICE, is a civil engineer with experience in the fields of track technology, geotechnology, advanced aboratory testing, field investigations, maintenance models and numerical analysis of track structures. He is currently employed by the University of Pretoria as Associate Professor: Transnet Freight Rail Chair in Railway Engineering, where he lectures under- and post-graduate courses in railway engineering. He is also responsible for railway research, as well as for continuing professional development in the form of short courses presented to industry.

