


Services on Demand
Article
 English (pdf)
 Article in xml format
 Article references
Indicators

Related links
-
 Cited by Google
 -
 Similars in Google
Share

 Permalink
Journal of the South African Institution of Civil Engineering
On-line version ISSN 2309-8775
Print version ISSN 1021-2019
J. S. Afr. Inst. Civ. Eng. vol.59 n.3 Midrand Sep. 2017
http://dx.doi.org/10.17159/2309-8775/2017/v59n3a2
TECHNICAL PAPER
Interpreting DPSH penetration values in sand soils
C J MacRobert
ABSTRACT
Site investigations to classify the underlying soil for geotechnical purposes often rely on in-situ penetrometer tests. Two common tests used in southern Africa are the Standard Penetration Test (SPT) and Dynamic Probe Super Heavy (DPSH) test. Although the specific work per blow is essentially the same in both tests, the resulting penetration values are not equivalent. The DPSH tends to be more variable than the SPT and has higher blow counts. A comparison of SPT and DPSH penetration values at a series of strata below sites has been undertaken. From this, new relative density descriptor boundaries, based on DPSH penetration values, are suggested for sand soils.
Keywords: site investigations, in-situ testing, penetrometers, soil classification, statistical analysis
INTRODUCTION
The Standard Penetration Test (SPT) and Dynamic Probe Super Heavy (DPSH) test are two common in-situ penetrometer tests employed in geotechnical site investigations in southern Africa. Although both tests have the same specific work per blow (Table 1), the SPT is carried out in an open hole and the DPSH is driven continuously into the soil. Despite this difference, the two tests are often assumed equivalent (Byrne & Berry 2008). MacRobert et al (2011) found this not to be the case and proposed an empirical correlation between the two tests. Since the publication of that paper, questions regarding the observed variability within the reported data and differences from other data sets have been raised (Harrison & A'Bear 2011; Shahien & Farouk 2013). Furthermore, additional data sets have become available to the current author. The aim of this paper is to shed light on this variability and propose new descriptor boundaries to classify the relative density of sand soils using DPSH penetration values.

INTERPRETATION OF PENETROMETER RESULTS
In-situ penetrometer tests are either "dynamic" or nominally "static", that is the probe is either hammered or pushed into the soil. Dynamic tests, such as the SPT and DPSH tests, have been criticised for their poor repeatability, due in particular to hammer energy inefficiencies and rod friction in the case of the DPSH (Broms & Flodin 1988). In southern African practice, the SPT blow count is counted over 300 mm and referred to as an N value; likewise, the DPSH blow count is counted over 300 mm and is referred to as an N30SB value. Reliance on this single qualitative parameter to determine requisite engineering design parameters has also been questioned (Mayne et al 2009). Consequently, static tests such as the cone penetration test (CPT) are increasingly being advocated due to higher accuracy and repeatability (Shukla 2015). Traditional CPT equipment measures both tip resistance and sleeve friction, with modern equipment measuring pore pressure and shear wave velocity (Robertson 2009). Engineering parameters can therefore be determined from a greater pool of measurements.
Despite the serious deficiencies of dynamic tests, they are still popular. This is particularly because they are cheap and have a long history of use (Broms & Flodin 1988). Virtually every geotechnical engineering design parameter has been correlated with SPT penetration values, although many of these correlations do not give any indication of statistical scatter (Mayne et al 2009). Robertson and Cabal (2012) conclude that SPT penetration values are suited to determining relative density of predominantly sand profiles, but only moderately so. This is typically done by comparing N values to the descriptor boundaries proposed in Table 2 (Terzaghi & Peck 1948).

Variability in penetration values arises from lateral variation in the soil profile and different testing procedures. It is difficult to separate these two sources of variability. Serota and Lowther (1973) determined that the coefficient of variation (COV), defined by Equation 1, for N values in a calibration chamber is between 12 and 10% for automatic trip hammers.
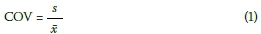
where  is the sample mean and s is the sample standard deviation.
Phoon and Kulhawy (1999), considering published site investigation data, suggested that the average COV in sand was 54% and ranged between 19% and 62%. The larger variability in the later study reflects lateral variation in site soil profiles and various hammer mechanisms, whereas the variability in the former study predominantly reflects variation within the testing procedure. No studies on variability in the DPSH are apparent in literature; however, similar variability to that reported for the SPT is likely.
CORRELATION BETWEEN N AND N30SB
Test sites
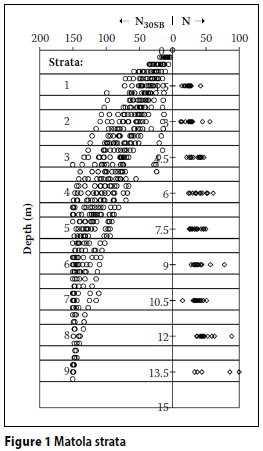
To investigate the correlation between N and N30SB, data from 13 site investigations were analysed. Data was collected from various engineering and contracting companies, with probing carried out according to best practice in southern Africa (MacRobert et al 2010). Consequently, relationships developed may not be applicable for different hammer efficiencies and where probing practices differ. Table 3 shows that all profiles probed consisted of sand soils, with Table 4 giving details of the probing undertaken at each site. Most sites were small and borehole logs indicated similar soil profiles, and so all N and N30SB profiles for such sites could be compared. For sites where probing was over a large area, N and N30SB profiles were separated into subsites with similar soil profiles based on borehole logs.
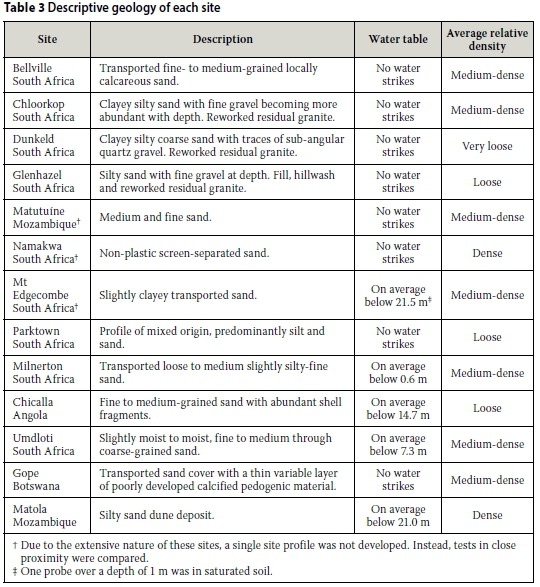
Soil profiles below sites (or subsites) were divided into 1 m thick strata centred at the depths where N values were determined. An example of these strata for the Matola site is given in Figure 1. The average and standard deviation of all N values within a stratum were then determined. For sites with only one N profile, the standard deviation was calculated assuming a COV of 25%. The corresponding range of N30SB values was determined as the average and standard deviation of all N30SB values within each 1 m thick stratum. This resulted in a series of strata for which average N and N30SB values and associated standard deviations were known.
For each of these strata the COV values of the N and N30SBvalues were calculated. Table 4 summarises the range of COV values for all strata at each site and gives the average. The average values are generally towards the lower range of the limits (19% to 62%) reported by Phoon and Kulhawy (1999). This suggests that there was limited lateral variation in the soil profiles. One site that exhibited significantly greater variability was the Parktown site. This site was characterised by material of mixed origin that included coal, ash and refuse which contributed to the large variation observed. Disregarding this site as anomalous, the average COV for N30SB was 32% and for N was 25%. Although the average COV values for the N30SB and N are similar, it is clear from the ranges of COV values for the two tests that N30SB showed greater variability.
Statistical methodology
In light of the variability in penetration values, individual values were not compared. Rather, the range of N values were compared to the corresponding range of N30SB values within a stratum across a site. Consequently energy corrections, such as proposed by Skempton (1986), were not applied, as these are more appropriate when considering individual N values. Assuming N values to be normally distributed, the probabilities of each stratum being classified into each of the five relative density ranges (Table 2) were calculated. Each stratum was then assigned a relative density based on which relative density resulted in the highest probability.
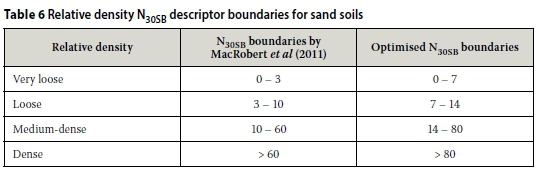
Equivalent N30SB relative density boundaries (Table 6) were calculated using the empirical correlation proposed by MacRobert et al (2011) from N boundaries in Table 2. Assuming N30SB values to be normally distributed, the probabilities of each stratum being classified into each of these relative density ranges were calculated. Each stratum was then assigned a relative density based on which relative density resulted in the highest probability. A comparison was then made between the relative density assigned by N values and N30SB values. The N30SB boundaries were subsequently optimised, using the entire data set, to maximise the number of strata assigned the same relative density by both tests.
RESULTS
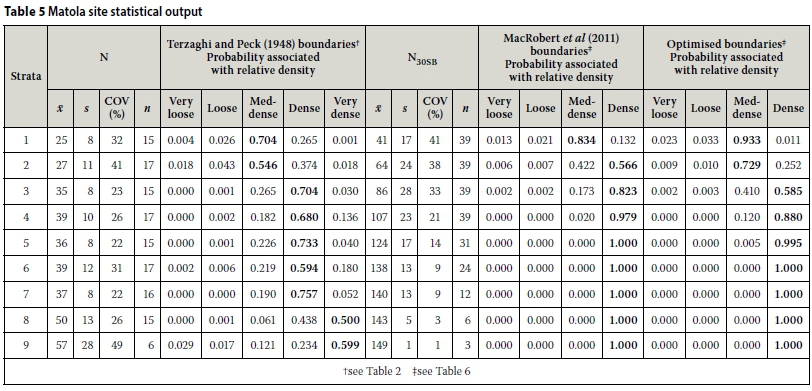
Prior to considering the entire data set, results for the Matola site are discussed. For each of the strata (Figure 1) average and standard deviation of N and N30SB values are given in Table 5. The calculated probability for each relative density, for each stratum, based on N values is given. Each stratum's assigned relative density and associated probability are indicated by bold type. Results from calculations performed on N30SBvalues are presented in a similar fashion. Based on the MacRobert et al (2011) boundaries, 6 stratum are assigned the same relative density by both tests, 1 is assigned a higher relative density by N30SB values and 2 are assigned a lower relative density by N30SB values. With the optimised boundaries, 7 stratum are assigned the same relative density by both tests and 2 are assigned a lower relative density by N30SB values. Considering the two strata assigned lower relative densities by N30SB values, the probabilities that these strata would be assigned the same lower relative density by N values are significant (> 0.05). This suggests that the optimised boundaries are adequate for categorising strata.
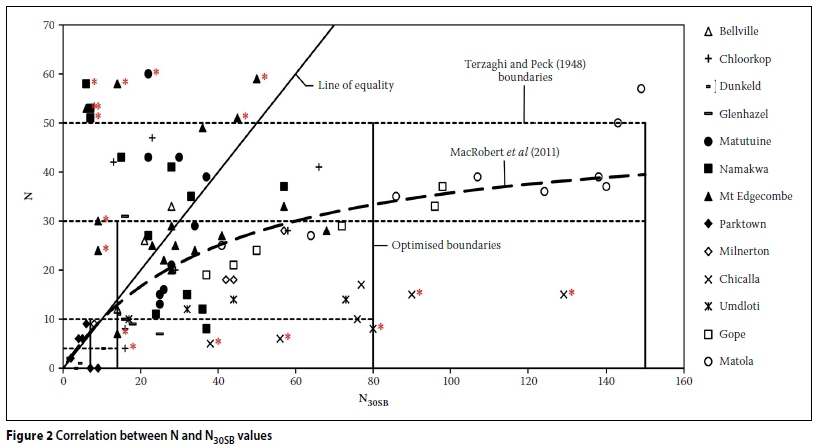
Figure 2 illustrates the average N and N30SB values for each stratum and for each site. In general, N30SB values are greater than respective N values. This is due to N30SB values increasing with depth at a greater rate than N values. Harrison and A'Bear (2011) attributed this to rods bowing during probing, causing jamming and sidewall collapse. This suggests that a correlation varying with depth may be appropriate. However, no such relationship was apparent when analysing the data. It is evident that the equation proposed by MacRobert et al (2011) is not sufficiently accurate to obtain equivalent N values from N30SBvalues. From the scatter in the graph, it is evidently impossible to define a single equation to obtain equivalent N from N30SB. However, it is possible to assign a relative density to a stratum with some confidence.
With the MacRobert et al (2011) descriptor boundaries, 49% of the strata were assigned the same relative density by both tests, 29% were assigned a lower relative density by N30SBvalues (i.e. a conservative estimate), and 22% were assigned a higher relative density by N30SBvalues. With the optimised descriptor boundaries, 57% of the strata were assigned the same relative density by both tests, 31% were assigned a lower relative density by N30SBvalues (i.e. a conservative estimate), and 12% were assigned a higher relative density by N30SB values.
Calculated probabilities associated with defining a stratum's relative density by N values and N30SB values (optimised descriptor boundaries) are considered in Figure 3. Figure 3(a) considers strata assigned the same relative density by both tests. As expected, the confidence with which these strata are assigned a relative density is high in both tests. However, individual probabilities are not comparable, as points do not lie along a line of equality. Figure 3(b) shows strata assigned a lower relative density by N30SBvalues than by N values. Ordinates are the probabilities that the N values would give the same lower relative density. In this case, the average probability that N values would give the same lower relative density is 0.15. Whilst this probability is small, it is greater than 0.05, suggesting there is nevertheless a significant chance that the strata are correctly defined by N30SB values. Figure 3(c) shows strata assigned a higher relative density by N30SB values than by N values. Ordinates are the probabilities that the N value would give the same higher relative density. In this case, the average probability that N values would give a similar higher relative density is 0.07, so there is a much lower chance that the strata are correctly defined by N30SB values. Referring to Figure 2 it is evident that most of the strata assigned a higher relative density based on N30SB are from the Chicalla site. As pointed out by MacRobert et al (2011), the ground profile at this site contained numerous shell fragments which may have resulted in the higher N30SB values. This highlights the need for a local knowledge of geology when interpreting N30SB values. Points marked with a red asterisk in Figure 2 indicate strata where the probability N would give the same relative density, as N30SBis less than 0.05. These points make up 12% of the data set.
CONCLUSIONS
A statistical analysis of 13 site investigations, in which 65 SPT and 121 DPSH profiles were determined, was undertaken. This was used to propose new N30SB relative density descriptor boundaries for sand soils. Considering the inherent variability of penetration values obtained from penetrometers, it is clear that defining a single equation to determine equivalent N values from N30SB values is futile. The practice of using N30SB values to obtain anything more than an estimate of relative density is therefore unwarranted.
ACKNOWLEDGEMENTS
The author acknowledges the various geo-technical consultants and contractors for kindly providing the analysed data. Stuart Hoepper's assistance in collecting the data is acknowledged; his untimely passing is a reminder of life's fragility. Dr Irvin Luker kindly provided valuable comments on the manuscript.
REFERENCES
Broms, B B & Flodin, N 1988. History of soil penetration testing. Proceedings, 1st International Symposium on Penetration Testing, ISOPT-1, 20-24 March, Orlando, FL. Rotterdam: AA Balkema, 157-220. [ Links ]
Byrne, G & Berry, A D 2008. A guide to practical geotechnical engineering in southern Africa. Sandton: Frankipile South Africa. [ Links ]
Harrison, B & A'Bear, T 2011. The dynamic probe super heavy penetrometer and its correlation with the Standard Penetration Test. In: Quadros, C & Jacobsz S W (Eds.), Proceedings, 15th African Regional Conference on Soil Mechanics and Geotechnical Engineering, Maputo, Mocambique. Amsterdam: IOS Press, 571-579. [ Links ]
MacRobert, C, Kalumba, D & Beales, P 2010. Penetration testing: Test procedures and design use in South Africa. Civil Engineering, 18(3): 29-38. [ Links ]
MacRobert, C, Kalumba, D & Beales, P 2011. Correlating standard penetration test and dynamic probe super heavy penetration resistance values in sandy soils. Journal of the South African Institution of Civil Engineering, 53(1), 46-54. [ Links ]
Mayne, P W, Coop, M R, Springman, S M, Huang, A-B & Zornberg, J G 2009. Geomaterial behavior and testing. Proceedings, 17th International Conference on Soil Mechanics and Geotechnical Engineering, Alexandria, Egypt. Amsterdam: IOS Press, 2777-2872. [ Links ]
Phoon, K-K & Kulhawy, F H 1999. Characterization of geotechnical variability. Canadian Geotechnical Journal, 36(4): 612-624. [ Links ]
Robertson, P 2009. Interpretation of cone penetration tests - a unified approach. Canadian Geotechnical Journal, 46(11): 1337-1355. [ Links ]
Robertson, P & Cabal, K 2012. Guide to cone penetration testing for geotechnical engineering. Signal Hill, CA: Gregg Drilling & Testing Inc. [ Links ]
Serota, S & Lowther, G 1973. Discussion: Accuracy of relative density measurements. Géotechnique, 23(2): 301-303. [ Links ]
Shahien, M M & Farouk, A 2013. Estimation of deformation modulus of gravelly soils using dynamic cone penetration tests. Ain Shams Engineering Journal, 4(4): 633-640. [ Links ]
Shukla, S K 2015. Core concepts of Geotechnical Engineering. London, ICE Publishers. [ Links ]
Skempton, A 1986. Standard penetration test procedures and the effects in sands of overburden pressure, relative density, particle size, ageing and overconsolidation. Géotechnique, 36(3): 425-447. [ Links ]
Terzaghi, K & Peck, R B 1948. Soil Mechanics In Engineering Practice. New York: Wiley. [ Links ]
 Correspondence:
C J MacRobert
School of Civil and Environmental Engineering
University of the Witwatersrand
Private Bag 3
PO Wits
2050
South Africa
T: +27 11 717 7156
E: charles.macrobert@wits.ac.za

DR CHARLES JOHN MACROBERT, who is an Associate Member of the South African Institution of Civil Engineering, received his BSc (Eng) degree from the University of Cape Town, and both his MSc (Eng) and PhD from the University of the Witwatersrand. He is currently a lecturer of geotechnical engineering in the School of Civil and Environmental Engineering at the University of the Witwatersrand. His research interests lie predominantly in the interaction of seepage with geo-materials, both from the grain-scale to the macro-scale level.

